3700
Volumetric glutamate-weighted MR imaging (gluCEST) enables in vivo detection of metabolic differences between human hippocampal subfields1Center for Magnetic Resonance and Optical Imaging, Department of Radiology, University of Pennsylvania, Philadelphia, PA, United States, 2Siemens Medical Solutions, USA, Malvern, PA, United States, 3Department of Diagnostic Imaging, St. Jude Children's Research Hospital, Memphis, TN, United States
Synopsis
We performed volumetric (3D) gluCEST with novel post-processing to image a slab containing the medial temporal lobe (MTL) in healthy human subjects. This data was segmented using a 7T atlas for hippocampal subfields. Upon further regional analysis, it was found that statistically significant differences exist between the mean gluCEST of MTL subfields; most prominently, that the dentate gyrus has greater gluCEST contrast than neighboring regions. We believe after some preliminary validation that this trend is independent of the B1 distribution or other variables. Moreover, it corroborates existing models of brain physiology identifying the DG as the locus of neurogenesis.
Introduction
The medial temporal lobe (MTL) has been identified by modern neuroscience to be the locus of learning and memory formation, and many neurodegenerative conditions wreak havoc on cognitive ability because of their damage to these structures. Thus, this region of the brain has been the focus of much investigation; however, there remain many unanswered questions about its molecular physiology even in healthy individuals. Glutamate is the primary excitatory neurotransmitter in the mammalian central nervous system and implicated in almost all neurophysiological processes; accordingly, dysregulation of its metabolism has been observed in many disease states. Glutamate-weighted Chemical Exchange Saturation Transfer (gluCEST) magnetic resonance imaging (MRI) is nearly unique in its ability to provide non-invasive, spatially resolved measurements of glutamate in vivo1. We recently developed an improved correction for B1 inhomogeneity of gluCEST images of the human brain2 which enabled truly volumetric (3D k-space) imaging, even in regions of the brain where B1 inhomogeneity is problematic. In this work, we extend single slice gluCEST MRI to partial 3D gluCEST imaging1,3 at 7T with this improved post-processing strategy2. GluCEST images of a slab which includes the MTL were generated and analyzed by registration with a high-resolution hippocampal subfield segmentation.Methods
Ten healthy adult subjects (3 female/7 male) ages 19-45 were scanned on a 7T scanner (MAGNETOM Terra, Siemens Healthcare, Erlangen, Germany) equipped with a 1Tx/32Rx head coil (Nova Medical, Wilmington, MA, USA). Our 3D CEST sequence is a spoiled gradient-echo acquisition, modified to include two saturation modules consisting of eight 100ms Hamming-windowed pulses at 3.1uT RMS B1, with a duty cycle of 99%. Our acquisition has 1 x 1 mm2 in-plane resolution with a field of view of 240 x 180 mm, and 16 slices of 2mm thickness each. The sequence includes GRAPPA with an acceleration factor of 2, and elliptical k-space acquisition with combined slice and phase-encode spiraling. Total acquisition time, including B0 and B1 maps, is approximately 15 minutes. Post-processing was performed using in-house code written in MATLAB and MEX, as described in1,3 and forthcoming work2. Segmentation of the MTL was performed using the Magdeburg 7T Atlas available in the Distributed Segmentation Service of ITK-SNAP9,10,11, with T1 and T2-weighted structural images as input. Regional and statistical analysis was performed using these segmentations and additional custom Matlab code, with visualizations shown in ITK- SNAP9.Results
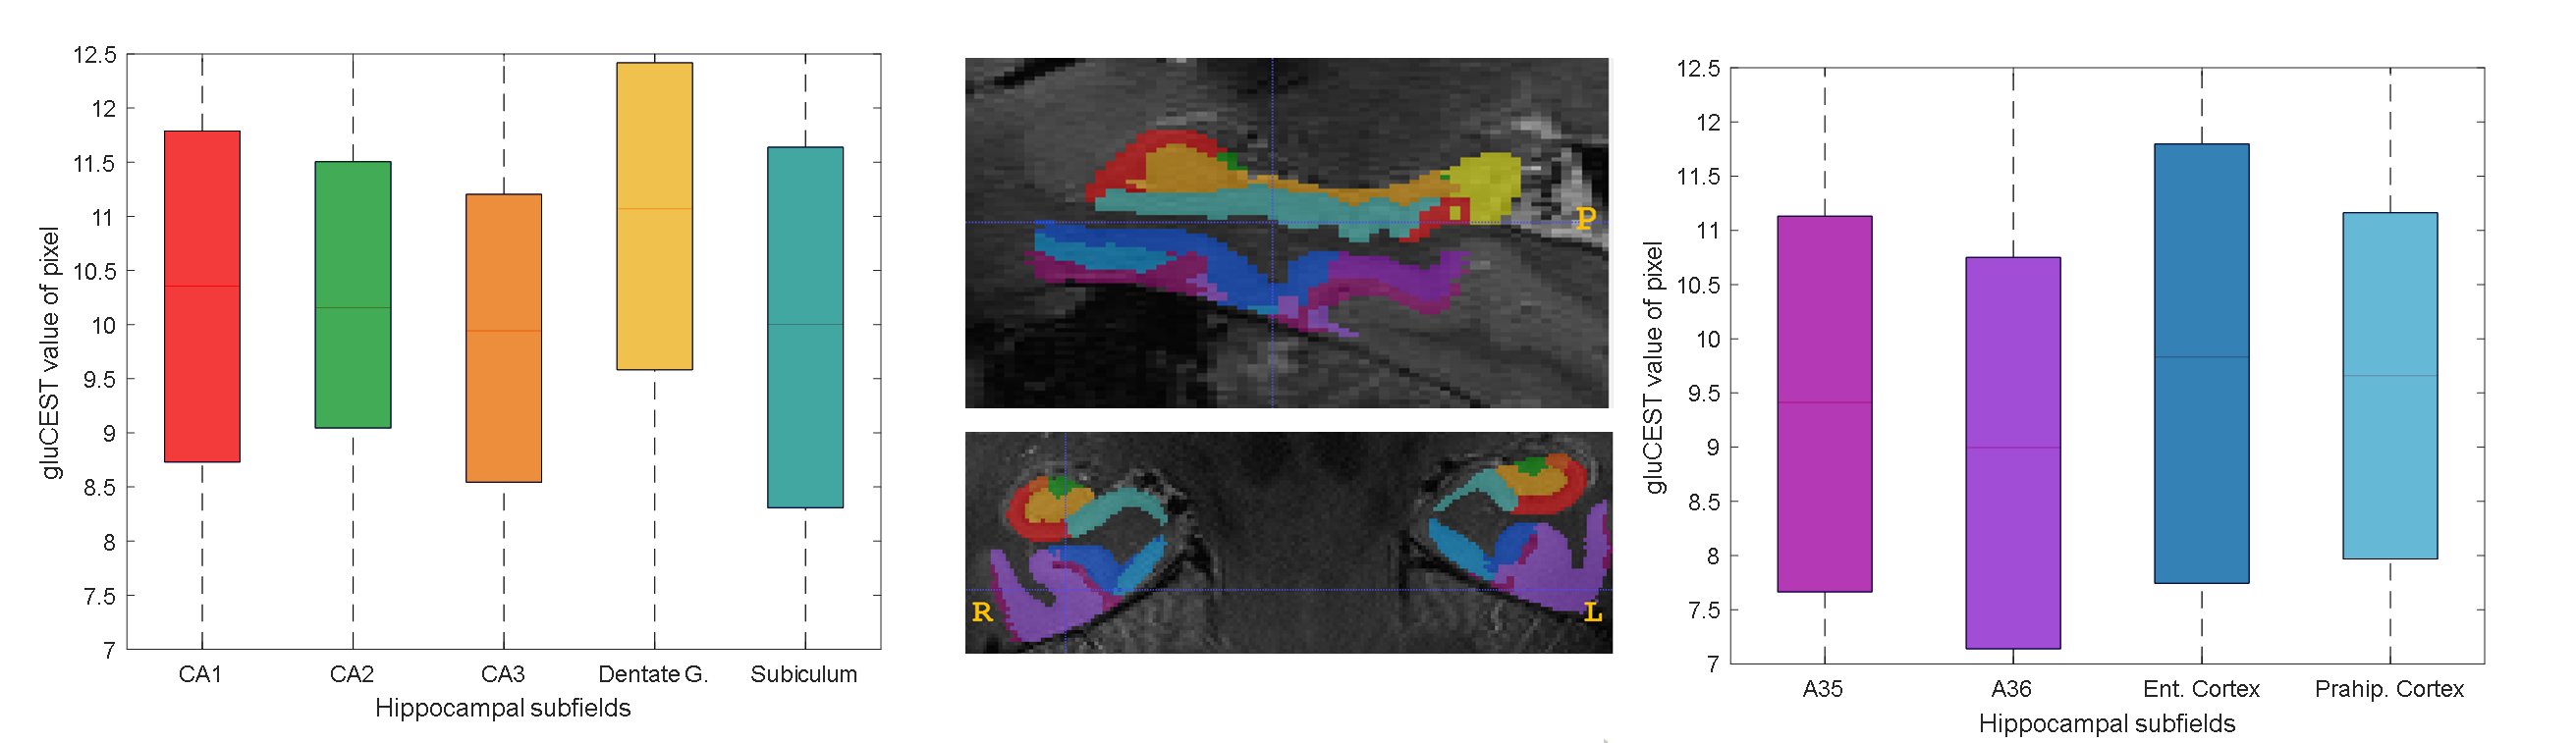
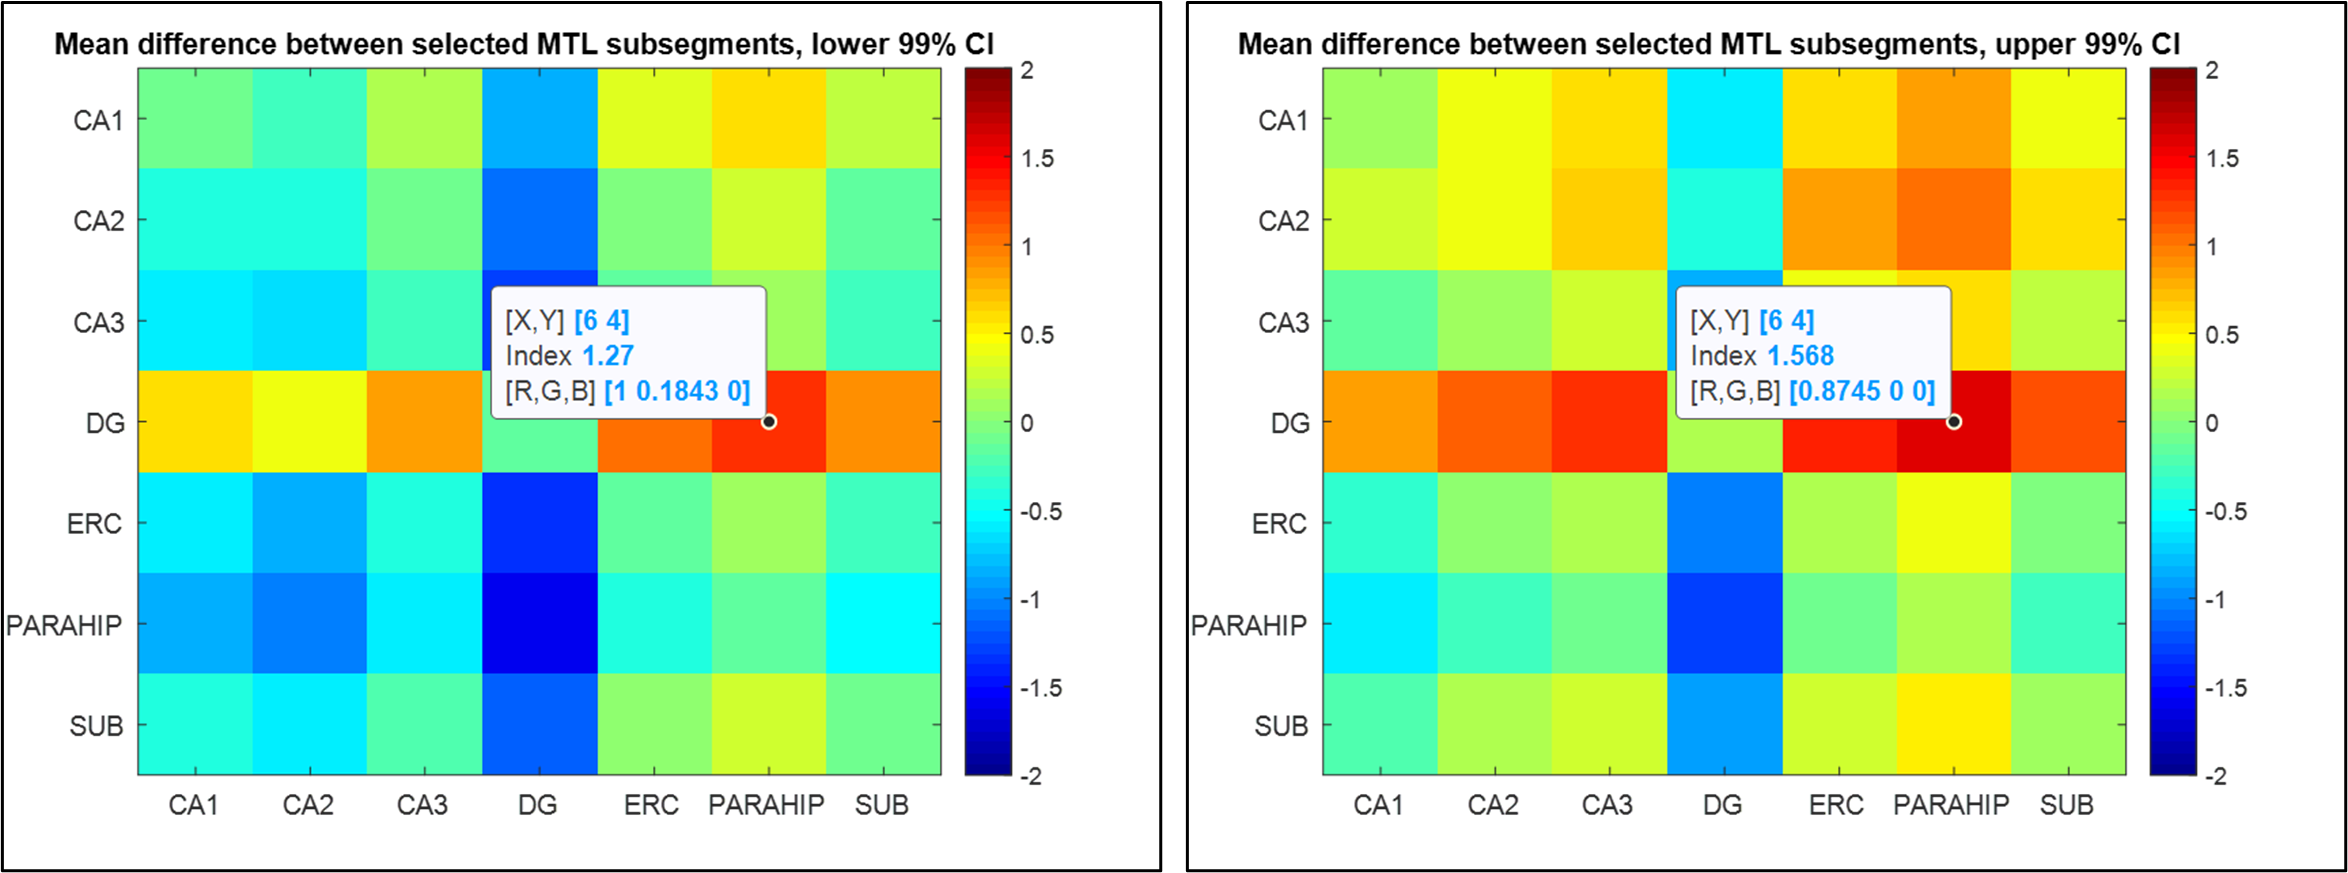
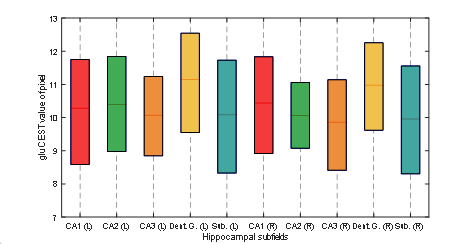
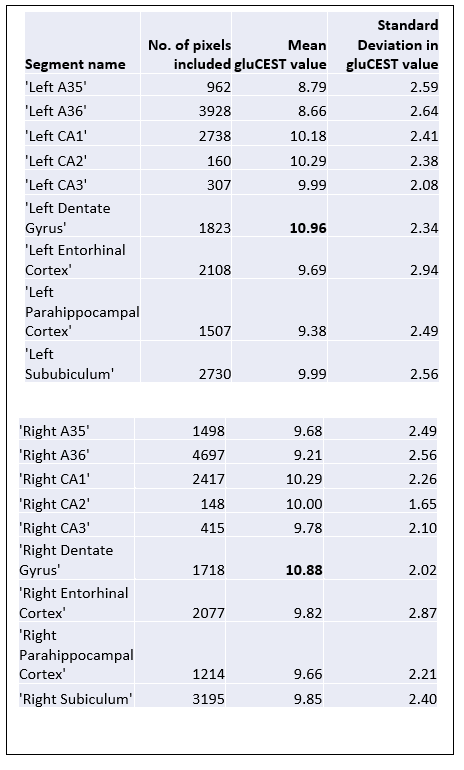
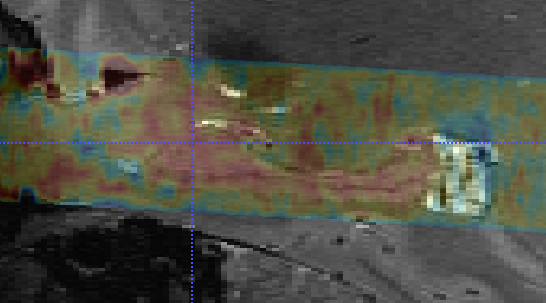
Figure 1 shows the medial temporal lobe (MTL) segmentation used, and color-coded box and whisker plots of gluCEST values over these segments, including all pixels for all ten subjects. The colored portion of the box represents the 25th and 75th percentiles of the distribution, with the line indicating the median. The Table indicates the number of pixels in each of these vectors, as well as the mean and standard deviation. However, the data in the Table is separated by laterality, while the right and left side vectors are combined for presentation of results shown in Figures 1 and 2. So, for example, the vector labeled as ‘A35’ in the purple boxplot includes 962+1498 = 2460 pixels. Figure 2 is a visual representation of the statistically estimated difference between segments in the form of colormaps representing the 99% confidence intervals. (The transpose of one element will be the additive inverse, representing the converse subtraction operation). The column representing the dentate gyrus (DG) is clearly the locus of the most significant difference. A35 and A36 of the perirhinal cortex were excluded from this analysis, because we currently suspect that results in these regions reflect the B1 headcoil distribution. In Figure 3, the gluCEST of the right and left hippocampal subfields is examined separately, illustrating that the dentate gyrus has an elevated signal relative to surrounding structures equivalently on both sides of the brain.Discussion
Based on the general awareness of finely specific physiology and function in the MTL4,5 and published studies of glutamate in rodent brains6,7,8, we hypothesized that there may be subtle, as of yet unmeasured physiological differences in glutamate concentration between various subfields of the hippocampus and neighboring structures of the human MTL. Our results suggest that we are indeed able to detect gluCEST differences in subfield anatomy in vivo; namely, an elevated glutamate signal in the dentate gyrus in comparison with the other MTL structures. There are several points of validation needed, specific to the gluCEST acquisition and in particular the method for correcting for B1 inhomogeneity, which is an essential step in the processing of gluCEST raw data. However, in terms of the dentate gyrus, we have undertaken several of these tests already, and the finding has held thus far. Moreover, a somewhat elevated concentration of glutmate in this region is in line with the paradigm maintaining that the dentate gyrus is a locus of neurogenesis.Conclusions
Our findings indicating that glutamate may be elevated in the dentate gyrus compared to other medial temporal lobe substructures corroborate existing understanding of neurophysiology. We believe that this result has not previously been demonstrated in living human beings, for lack of technology capable of measuring it. These preliminary findings demonstrate the exciting potential of 3D gluCEST MRI for measuring substructural glutamate differences in the human brain.Acknowledgements
A. Cember would like to thank the human subjects for their participation in this study.References
1. Cai K, et al. Nat. Med. 2012; 18(2):302-306.
2. Cember A, et al. Under Review.
3. Nanga RPR, et al. Proc. Intl. Soc. Mag. Reson. Med. 2019; (27) 3996.
4. Berron D, et al. Neurobiol. Aging. 2018; 65: 86-97
5. Baker S, et al. Curr. Biol. 2016; 26 (19): 2629-2634
6. Pepin J, et al. Proc. Intl. Soc. Mag. Reson. Med. 2017; 25: 3741
7. Bagga P, et al. J Neurochem. 2016; 139(3):432-439.
8. Crescenzi R, et al. Hippocampus. 2017;27(3):285-302.
9. Yushkevich P, et al. Hum. Brain Mapp. 2015; 36:258–287
10. Berron D, et al. Neuroimage Clin. 2017; 15:466–482.
11. Berron D et at. J. Neurosci.: 2019; 39 (44) 8788-8797.
Figures