3699
A digital human head phantom for validation of retrospective motion correction in glucoCEST MRI
Patrick M. Lehmann1, Mads Andersen2, Anina Seidemo1, Xiang Xu3,4, Xu Li4,5, Nirbhay Yadav4,5, Ronnie Wirestam1, Frederik Testud6, Patrick A. Liebig7, Pia C. Sundgren8,9, Peter C. M. van Zijl4,5, and Linda Knutsson1,4
1Department of Medical Radiation Physics, Lund University, Lund, Sweden, 2Philips Healthcare, Copenhagen, Denmark, 3BioMedical Engineering and Imaging Institute, Icahn School of Medicine at Mount Sinai, New York, NY, United States, 4Russell H. Morgan Department of Radiology and Radiological Science, Johns Hopkins University School of Medicine, Baltimore, MD, United States, 5F.M. Kirby Research Center for Functional Brain Imaging, Kennedy Krieger Institute, Baltimore, MD, United States, 6Siemens Healthcare AB, Malmö, Sweden, 7Siemens Healthcare GmbH, Erlangen, Germany, 8Department of Radiology, Lund University, Lund, Sweden, 9Lund University Bioimaging Centre, Lund University, Lund, Sweden
1Department of Medical Radiation Physics, Lund University, Lund, Sweden, 2Philips Healthcare, Copenhagen, Denmark, 3BioMedical Engineering and Imaging Institute, Icahn School of Medicine at Mount Sinai, New York, NY, United States, 4Russell H. Morgan Department of Radiology and Radiological Science, Johns Hopkins University School of Medicine, Baltimore, MD, United States, 5F.M. Kirby Research Center for Functional Brain Imaging, Kennedy Krieger Institute, Baltimore, MD, United States, 6Siemens Healthcare AB, Malmö, Sweden, 7Siemens Healthcare GmbH, Erlangen, Germany, 8Department of Radiology, Lund University, Lund, Sweden, 9Lund University Bioimaging Centre, Lund University, Lund, Sweden
Synopsis
D-glucose was recently suggested as a CEST-based biodegradable alternative to gadolinium-based contrast agents. Dynamic glucose-enhanced (DGE) MRI can retrieve information about glucose uptake, determined by tissue perfusion, transport, and metabolism. Motion artefacts in DGE-MRI can be mistaken for CEST effects, while motion correction may erroneously alter true DGE signal. A digital human head phantom based on a realistic glucose infusion protocol was developed to analyse motion artefacts and validate rigid-head retrospective motion correction. This phantom can be used for testing different correction approaches using various motion patterns and contrast responses to better understand these effects in vivo.
Introduction
Dynamic glucose-enhanced (DGE) MRI uses the phenomenon of chemical exchange saturation transfer (CEST) or exchange-enhanced relaxation to study D-glucose uptake, which is determined by tissue perfusion, transport and metabolism 1-5. However, at clinical field strengths, the CEST effect is small (~1% of the water signal), and analysing DGE data in human brain is associated with challenges such as artefacts due to motion 6. These artefacts can be mistaken for CEST effects, while motion correction may erroneously alter true DGE signal. In this study, a digital human head phantom was developed to simulate the DGE contrast at 3 T. This phantom can be used for motion artefact analysis and optimization of different motion correction approaches.Methods
An MPRAGE brain image from a tumour patient (glioblastoma WHO IV) was used to segment grey matter (GM), white matter (WM), other soft tissue, cerebrospinal fluid (CSF), and bone. For further differentiation, regions of interest (ROIs) were drawn to select veins (V), arteries (A), lateral ventricles (LV), and tumour tissue (T). GlucoCEST effect sizes (normalized intensities I) for V, A, GM, and WM at 3 T were derived using the Bloch-McConnell equations for a B1 = 2.0 µT (IV= 0.49 %, IA = 1.05 %, IGM = 0.19 %, IWM = 0.06 %), based on concentration changes of 10 mM in blood and ¼ of that in tissue 7. CSF was characterized by ICSF = 0.63 %, 60 % of IA 8, and for high-grade glioma IT = 0.73 % was assumed based on increased vascular contribution 9 and leakage into extravascular extracellular space. GlucoCEST curves were simulated based on DGE response curves observed at 3 T using a prototype sequence (MAGNETOM, Prisma, Siemens Healthcare, Erlangen, Germany) and 7 T (Achieva, Philips, Best, The Netherlands) 3, 10. GlucoCEST contrast curves and tissue segmentations were combined creating a glucoCEST time series, representing the ground truth. A dynamic time series with an acquisition time of 690 s and a temporal resolution of 5 s was simulated, including (non-saturated) data acquisition (20 s), baseline (20-140 s), D-glucose infusion (140-380 s), and signal rise and decay (380-690 s). One representative rigid-body motion pattern was applied to this time series (Figs.1, A, B). LVs can show a relative volume change of 1 % due to cardiac pulsation 11. D-glucose loading can lead to ventricular dilatation by about 2.4 % 12. Such non-rigid LV movement was therefore simulated by adding an affine transformation with a time-dependent scaling coefficient to the LV segmentation (Fig. 1, C). The glucoCEST time series were downsampled to (2×2×3) mm3 and Rician noise was added. Three simulated glucoCEST experiments were investigated: without motion and with infusion (ground truth), motion without infusion, and with motion and infusion illustrated in Fig. 2. Rigid-head-motion correction was performed using Elastix 13. DGE signal given by$$S_{DGE} (t)=\frac{S_{base}-S(t)}{S_{0}},$$
was calculated using the mean pre-infusion (baseline) signal $$$S_{base}$$$, the signal time course $$$S(t)$$$, and the non-saturated water signal $$$S_{0}$$$. ROIs were drawn for WM and tumour for extracting contrast response curves. Averaged area under curve (AUC) maps were created according to
$$AUC_{mean}=\frac{\sum_{0}^{t} S_{DGE}(t)}{N},$$
for pre-infusion (115 s), during infusion (245 s) and two post-infusion time intervals (45 s before, 160 s after peak) showing signal rise and decay. N indicates the number of averaged image time frames.
Results and Discussion
The simulated dynamic signal ratio $$$S_{sat}/S_{0}$$$ time series -and $$$S_{DGE}(t)$$$ are shown in Figs. 3A and 3B, respectively. The ground truth AUC maps (Fig. 4E) show a clear dynamic tissue response. Added motion (Figs. 4, A, B) introduced strong artefacts (pseudo-CEST contrast) in terms of hyperintensities at tissue interfaces and hypointensities in LVs. Even without D-glucose infusion, this caused apparent effects that have similar or higher effect size in the AUC maps as the ground truth (Fig. 4, A) and e. g. ~ - 0.8 % in tumour tissue (Fig. 5, A). Similar findings have been reported in vivo 6, 14.GlucoCEST contrast is more reliable after retrospective motion correction (Figs. 4, C, D; Figs. 5, B, D), removing the most severe artefacts, but not fully recovering original image series quality. Especially LVs and tissue interfaces show residual AUC effects in form of hyper- and hypointensities (Figs. 4, C, D). Pseudo- and true glucoCEST contrast could not be fully disentangled, which was attributed to smoothing and interpolation errors related to the motion correction algorithm. The signal without infusion but motion showed a strong and broad negative signal, where the signal with infusion is reduced (Figs.5, B, D). The signal drop corresponds to a sudden movement (255 s, Figs. 1, A, B). The measured pseudo-CEST effect depends strongly on the motion pattern.
Conclusion
A digital human head phantom simulating a glucoCEST experiment in combination with rigid-body movement and dynamic LV dilatation/contraction was developed. Motion induced pseudo-CEST effect was partially alleviated by rigid motion correction. Residual motion effects in tissue boundaries were tangled with true CEST contrast complicating image interpretation. This can lead to data misinterpretation. Artefacts similar to in vivo observations could be reproduced. The phantom presented here will be useful in developing proper analysis methods that can separate true signal effects from motion artefacts.Acknowledgements
No acknowledgement found.References
- Chan KW, McMahon MT, Kato Y, et al. Natural D-glucose as a biodegradable MRI contrast agent for detecting cancer. Magn Reson Med 2012;68(6):1764–1773.
- Walker-Samuel S, Ramasawmy R, Torrealdea F, et al. In vivo imaging of glucose uptake and metabolism in tumors. Nat Med. 2013;19:1067-1072.
- Xu X, Chan KWY, Knutsson L, et al. Dynamic glucose enhanced (DGE) MRI for combined imaging of blood–brain barrier break down and increased blood volume in brain cancer. Magnetic Resonance in Medicine 2015; 74(6): 1556-1563.
- Paech D, Schuenke P, Koehler C, et al. T1ρ-weighted Dynamic Glucose-enhanced MR Imaging in the Human Brain. Radiology 2017;285(3): 914–922.
- Schuenke P, Paech D, Koehler C, et al. Fast and quantitative T1ρ-weighted dynamic glucose enhanced MRI. Sci Rep 2017;7:42093
- Zaiss M, Herz K, Deshmane A, et al. Possible artifacts in dynamic CEST MRI due to motion and field alterations. J Magn Reson 2019;298:16-22.
- Xu X, Sehgal AA, Yadav NN, et al. d‐glucose weighted chemical exchange saturation transfer (glucoCEST)‐based dynamic glucose enhanced (DGE) MRI at 3T: early experience in healthy volunteers and brain tumor patients. MRM 2020;84:247-262.
- Karen R, Principles of Neurologic Infectious Diseases. McGraw Hill Higher Education. 2005;p.4:978-0-07-140816-5.
- La Violette PS, Cohen AD, Prah MA, et al. Vascular change measured with independent component analysis of dynamic susceptibility contrast MRI predicts bevacizumab response in high-grade glioma.Neuro-Oncology 2013;15:442-450.
- Knutsson L, Seidemo A, Rydhög Scherman A, et al. Arterial Input Functions and Tissue Response Curves in Dynamic Glucose-Enhanced (DGE) Imaging: Comparison Between glucoCEST and Blood Glucose Sampling in Humans. Tomography 2018;2379-1381.
- Zhu D, Xenos M, Linninger AA, et al. Dynamics of lateral ventricle and cerebrospinal fluid in normal and hydrocephalic brains. JMRI 2006;24:756-770.
- Puri B, Lewis H, Saeed N, et al. Volumetric change of the lateral ventricles in the human brain following glucose loading. Exp Phy 1999;84(1):223-226.
- Klein S, Staring M, Murphy K, et al. elastix: a toolbox for intensity‐based medical image registration. IEEE Trans Med Imaging. 2010;29:196–205.
- Herz K, Lindig T, Deshmane A, et al. T1ρ‐based dynamic glucose‐enhanced (DGEρ) MRI at 3 T: method development and early clinical experience in the human brain. Magn Reson Med. 2019;00:1-16.
Figures
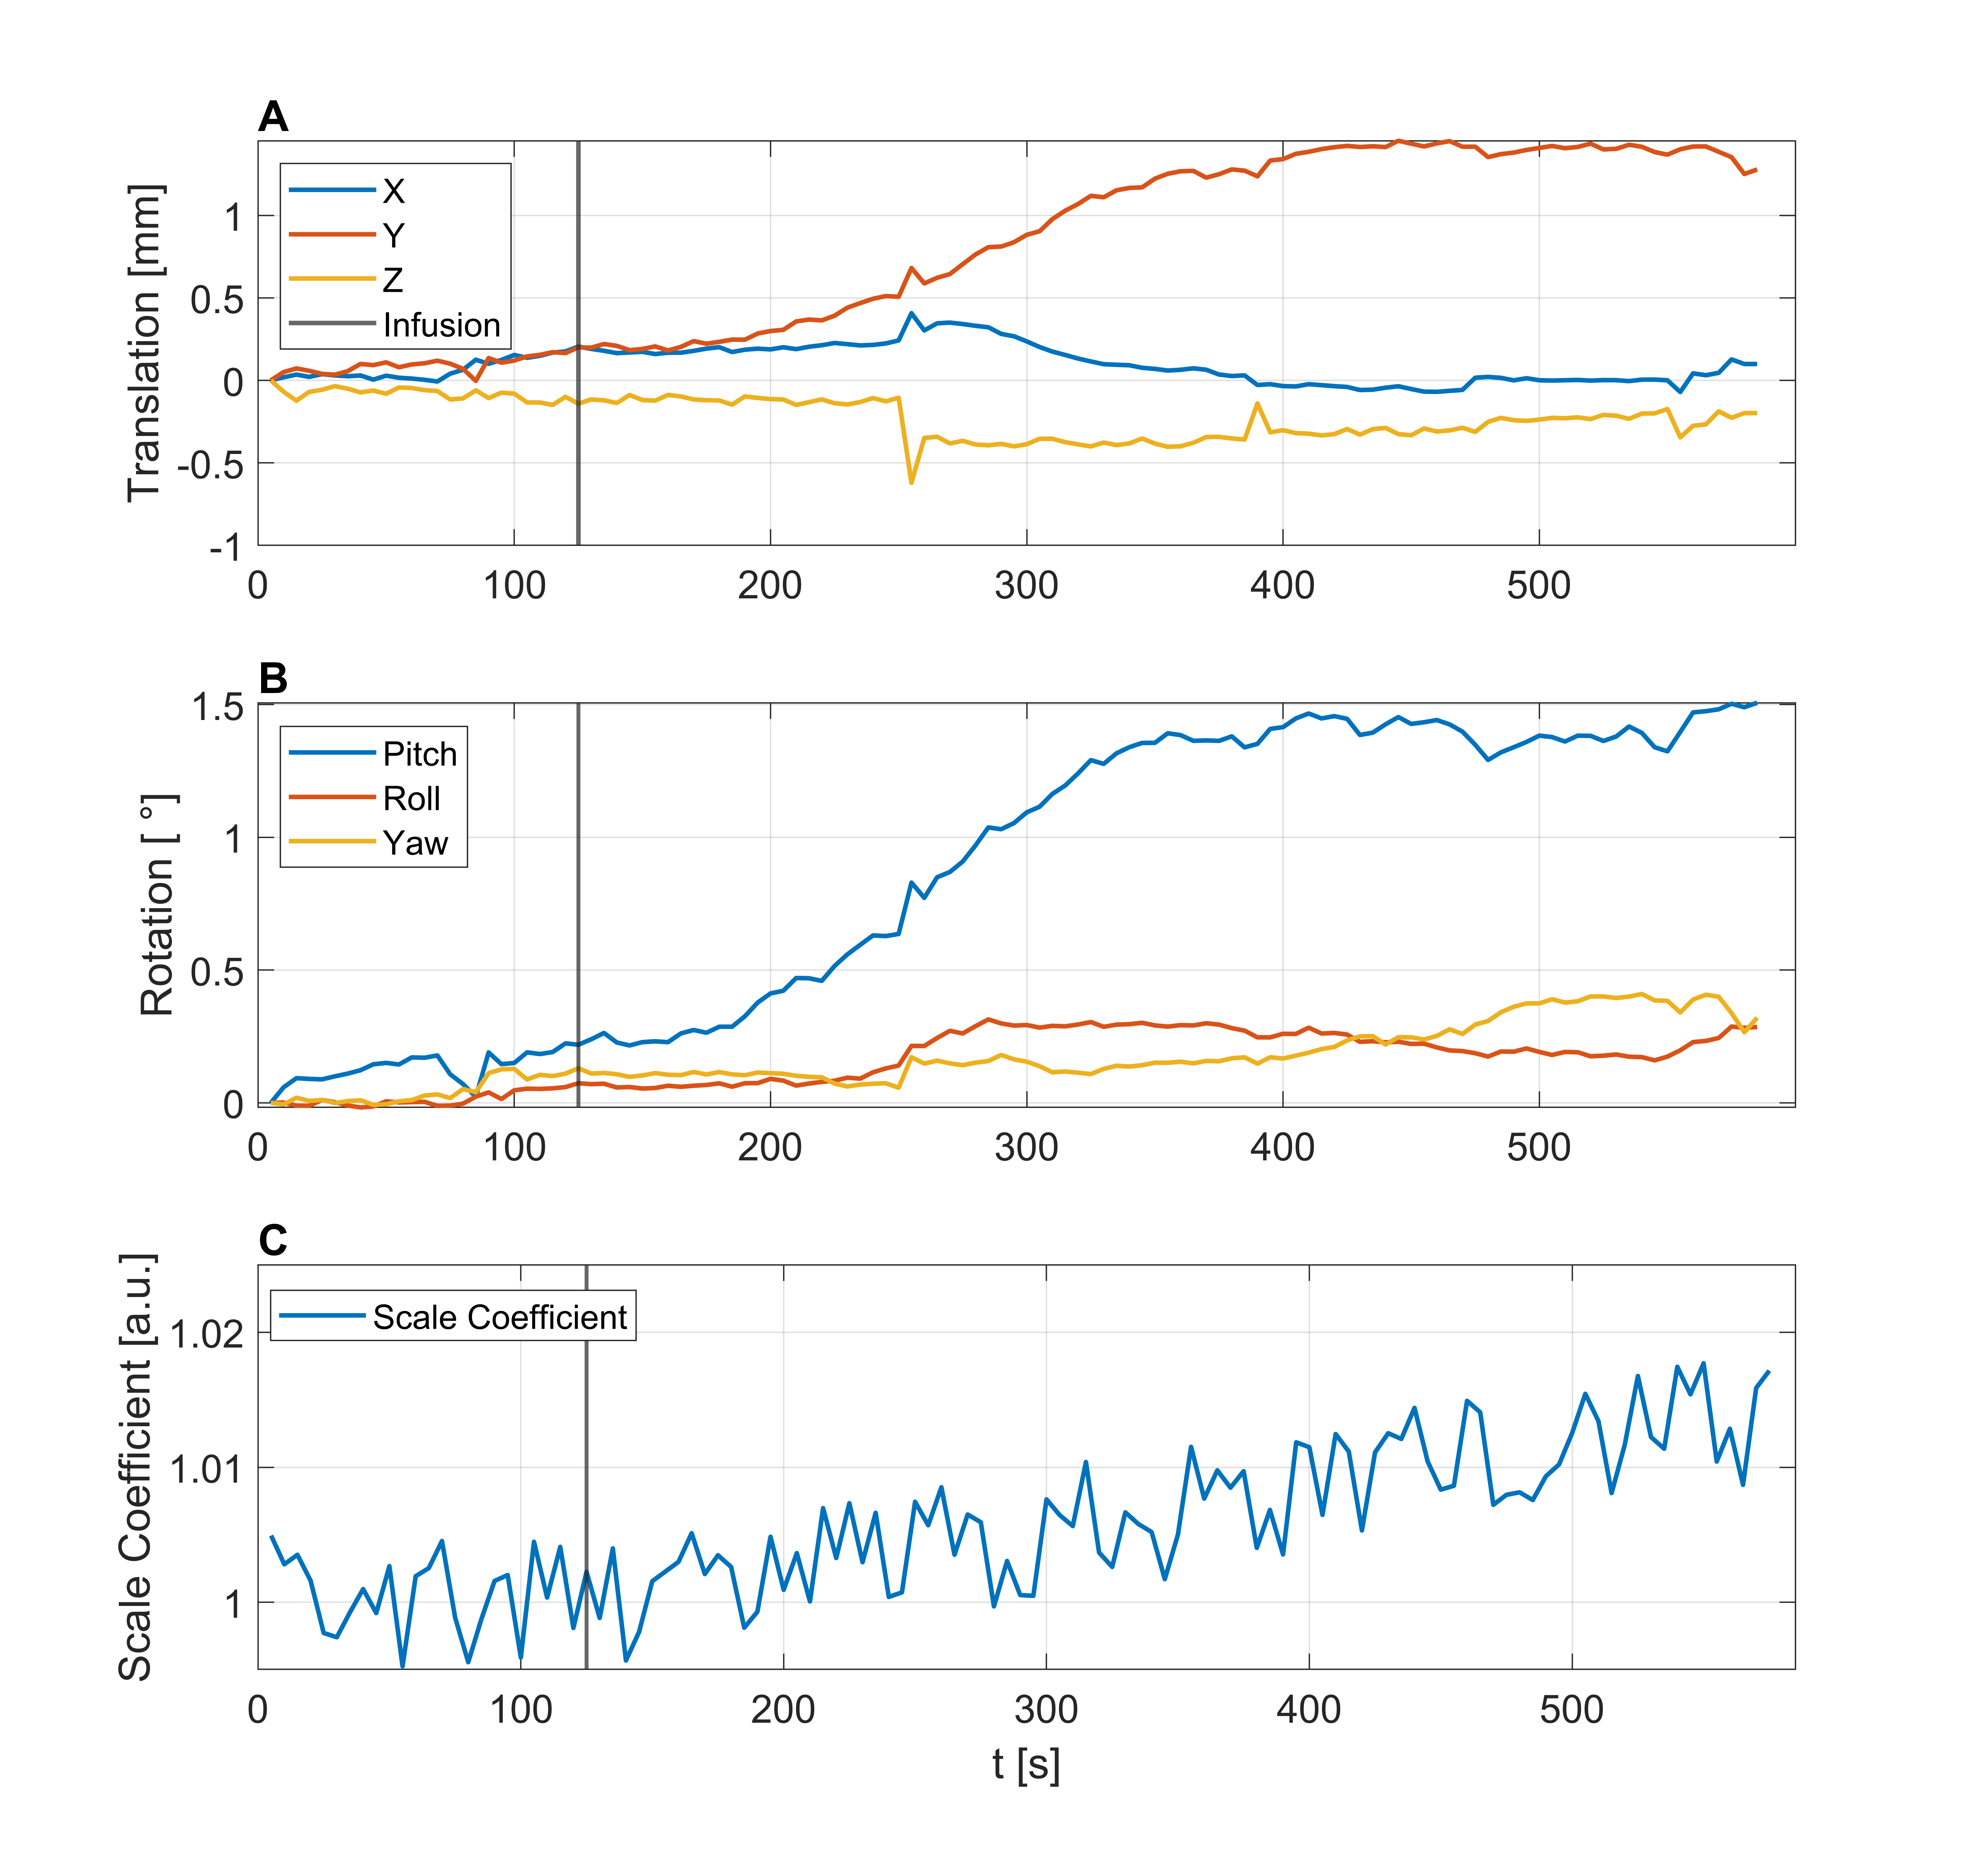
Figure 1: Rigid-head-motion estimates extracted from a glucoCEST
patient scan separated into translations (A) and rotations (B). Dynamically
varying scaling coefficient for lateral ventricles capturing volume dilatation and contraction due to glucose uptake and cardiac cycle (C).
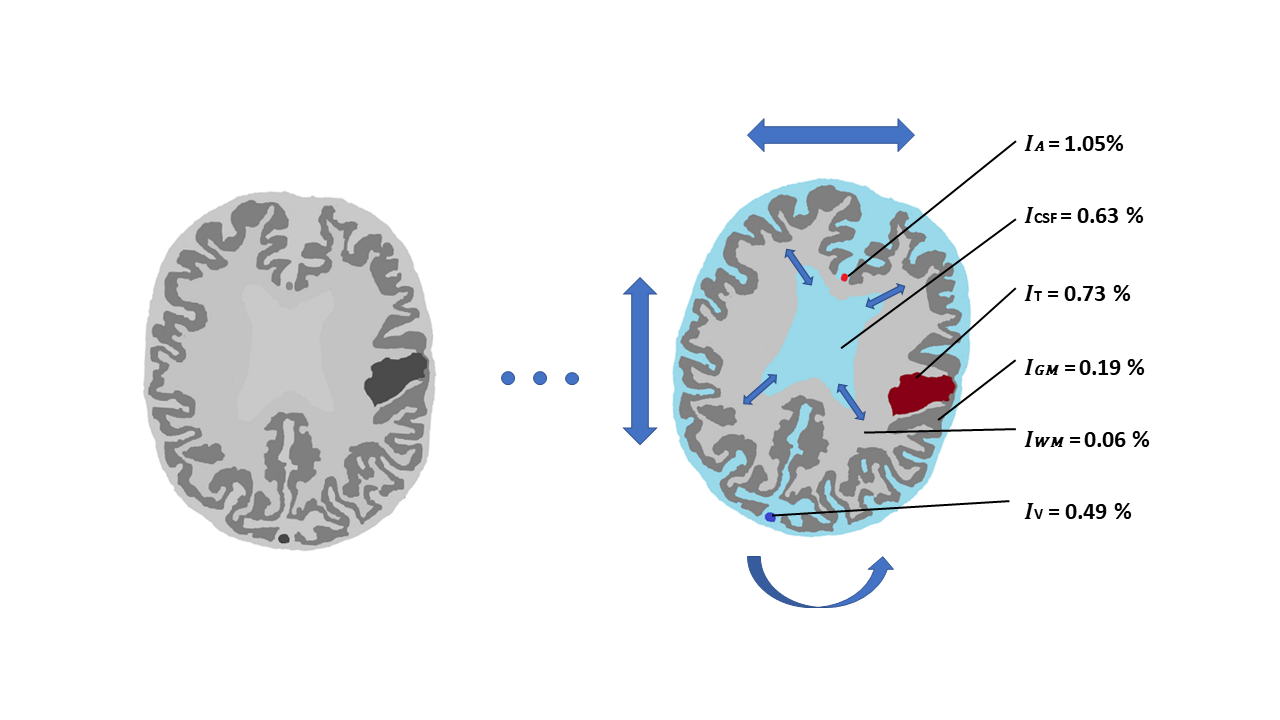
Figure 2: Illustration of a glucoCEST
scan of a patient with a brain tumour under the influence of D-glucose
infusion, rigid-head motion and dynamic lateral ventricle dilatation and
contraction.
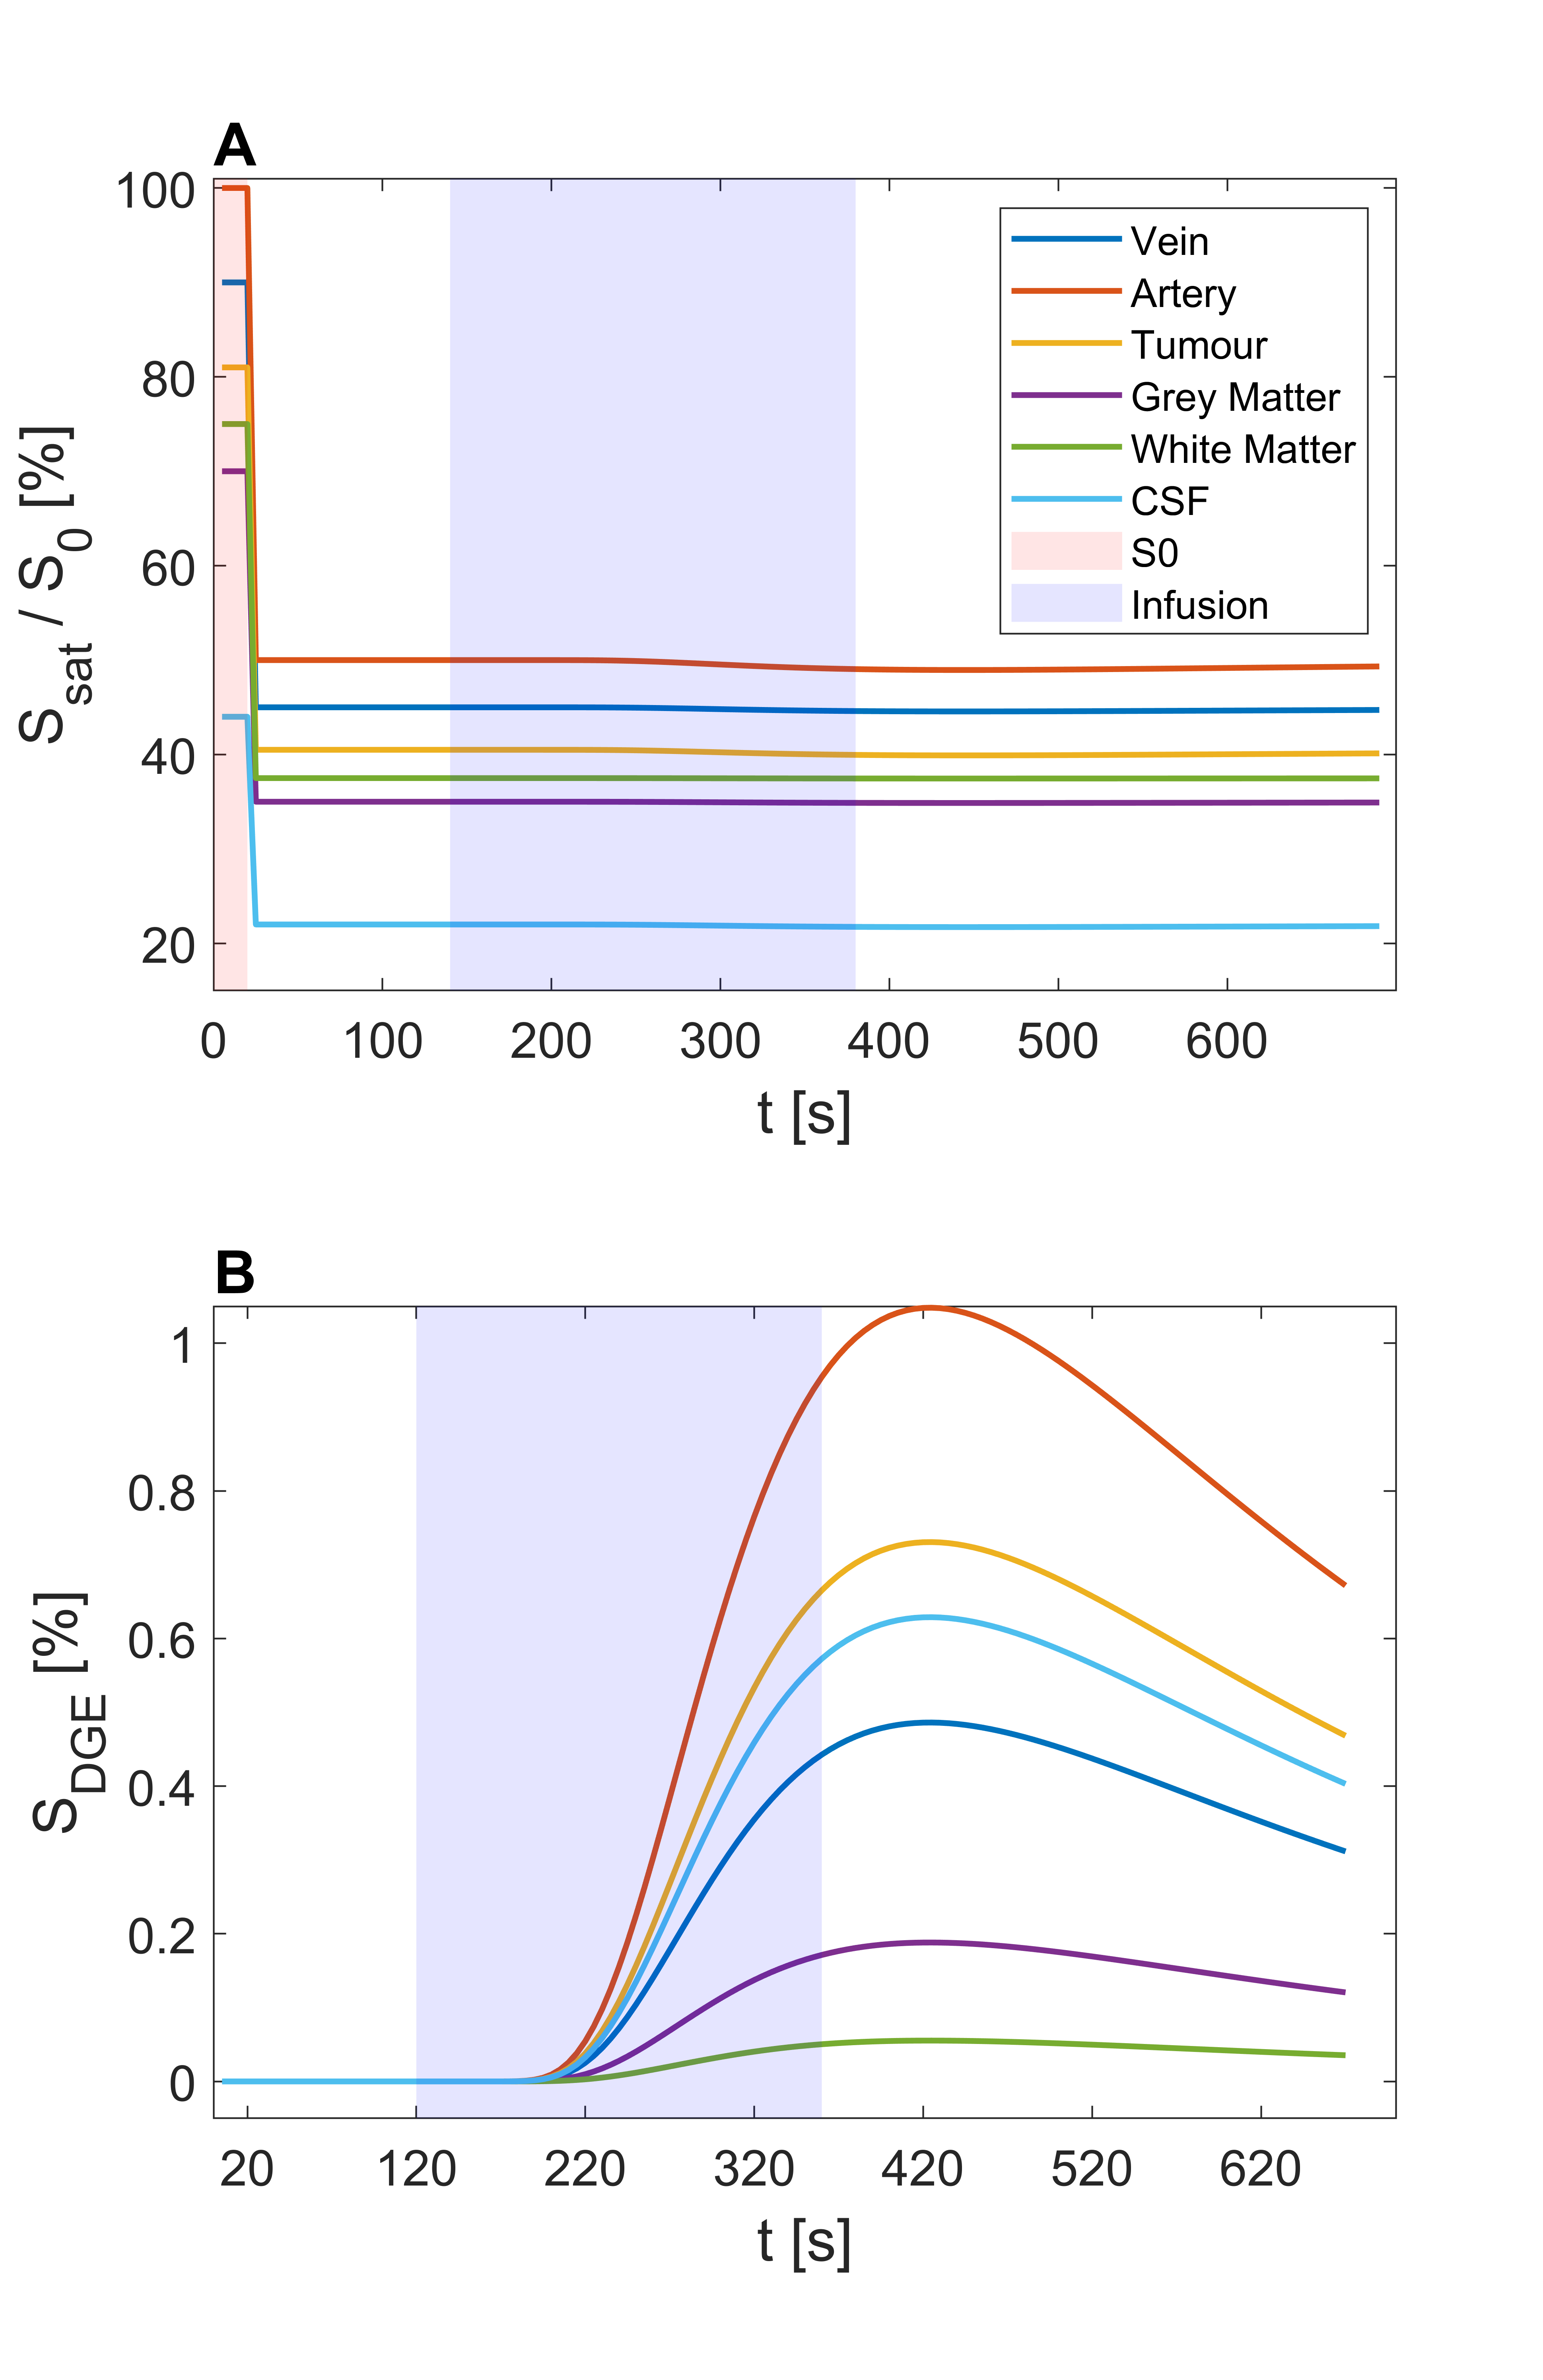
Figure 3: Normalized signals (A) and
derived DGE signals (B) of a simulated glucoCEST experiment for veins,
arteries, tumour tissue, grey matter, white matter, and CSF separated into $$$S_{0}$$$,
baseline, infusion, and post-infusion sections.
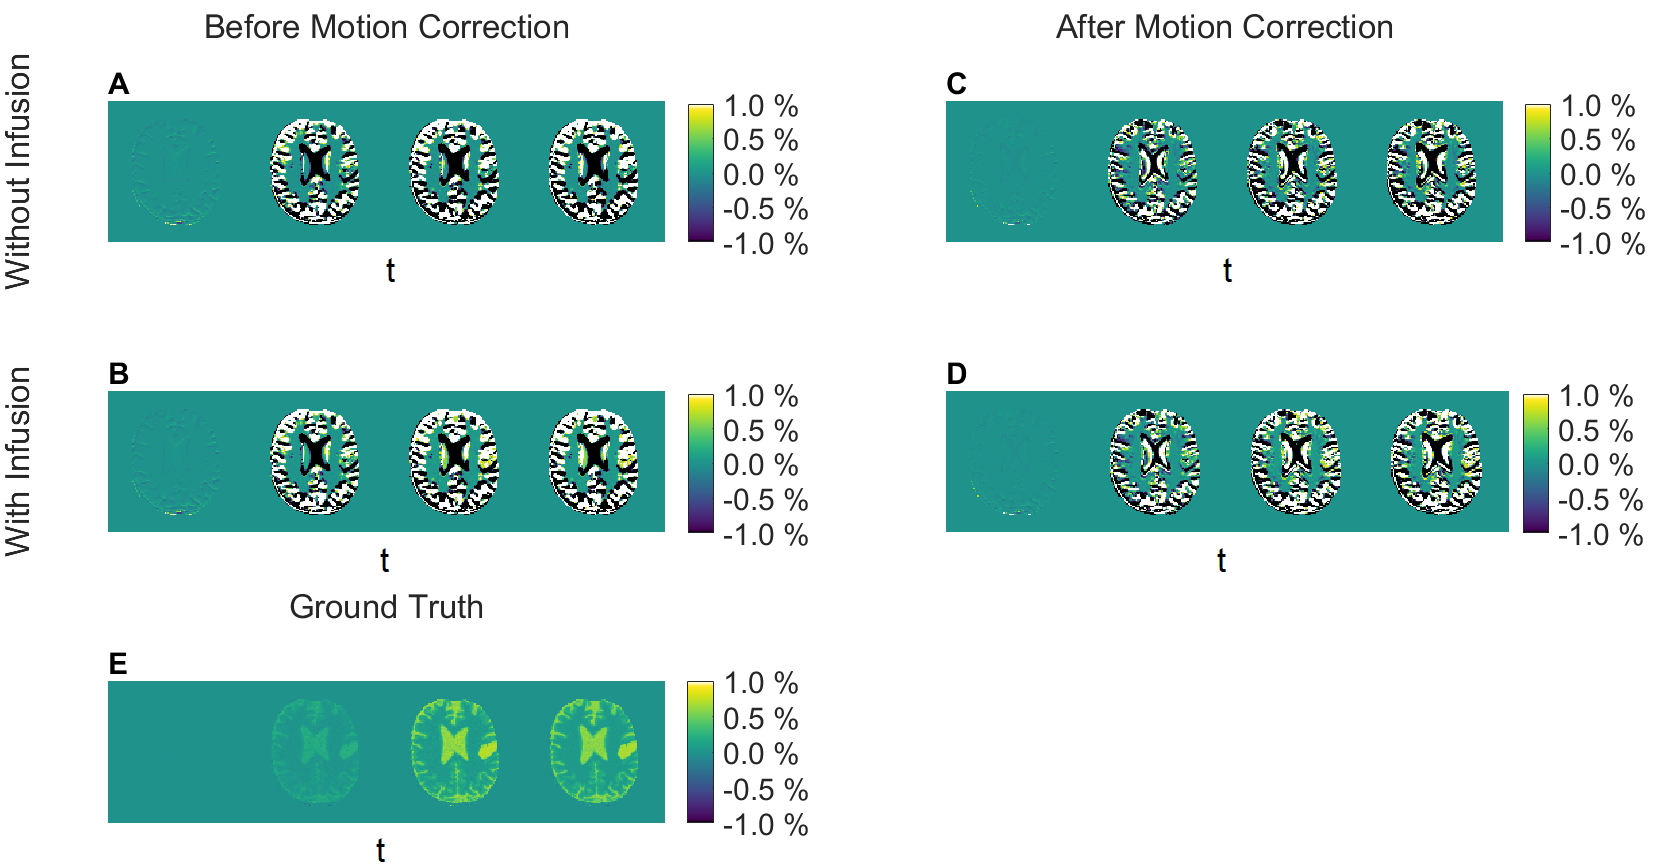
Figure 4: AUC (area under the curve) maps
depicting different intervals: Pre-infusion
(115 s), during infusion (245 s), and two post-infusion time intervals (45 s
before, 160 s after peak) showing signal rise and decay. Five cases showing ground
truth with D-glucose infusion and without motion (E), without infusion and with
motion (A, C), and with infusion and motion (B, D), before (A, B) and after (C,
D) retrospective motion correction.
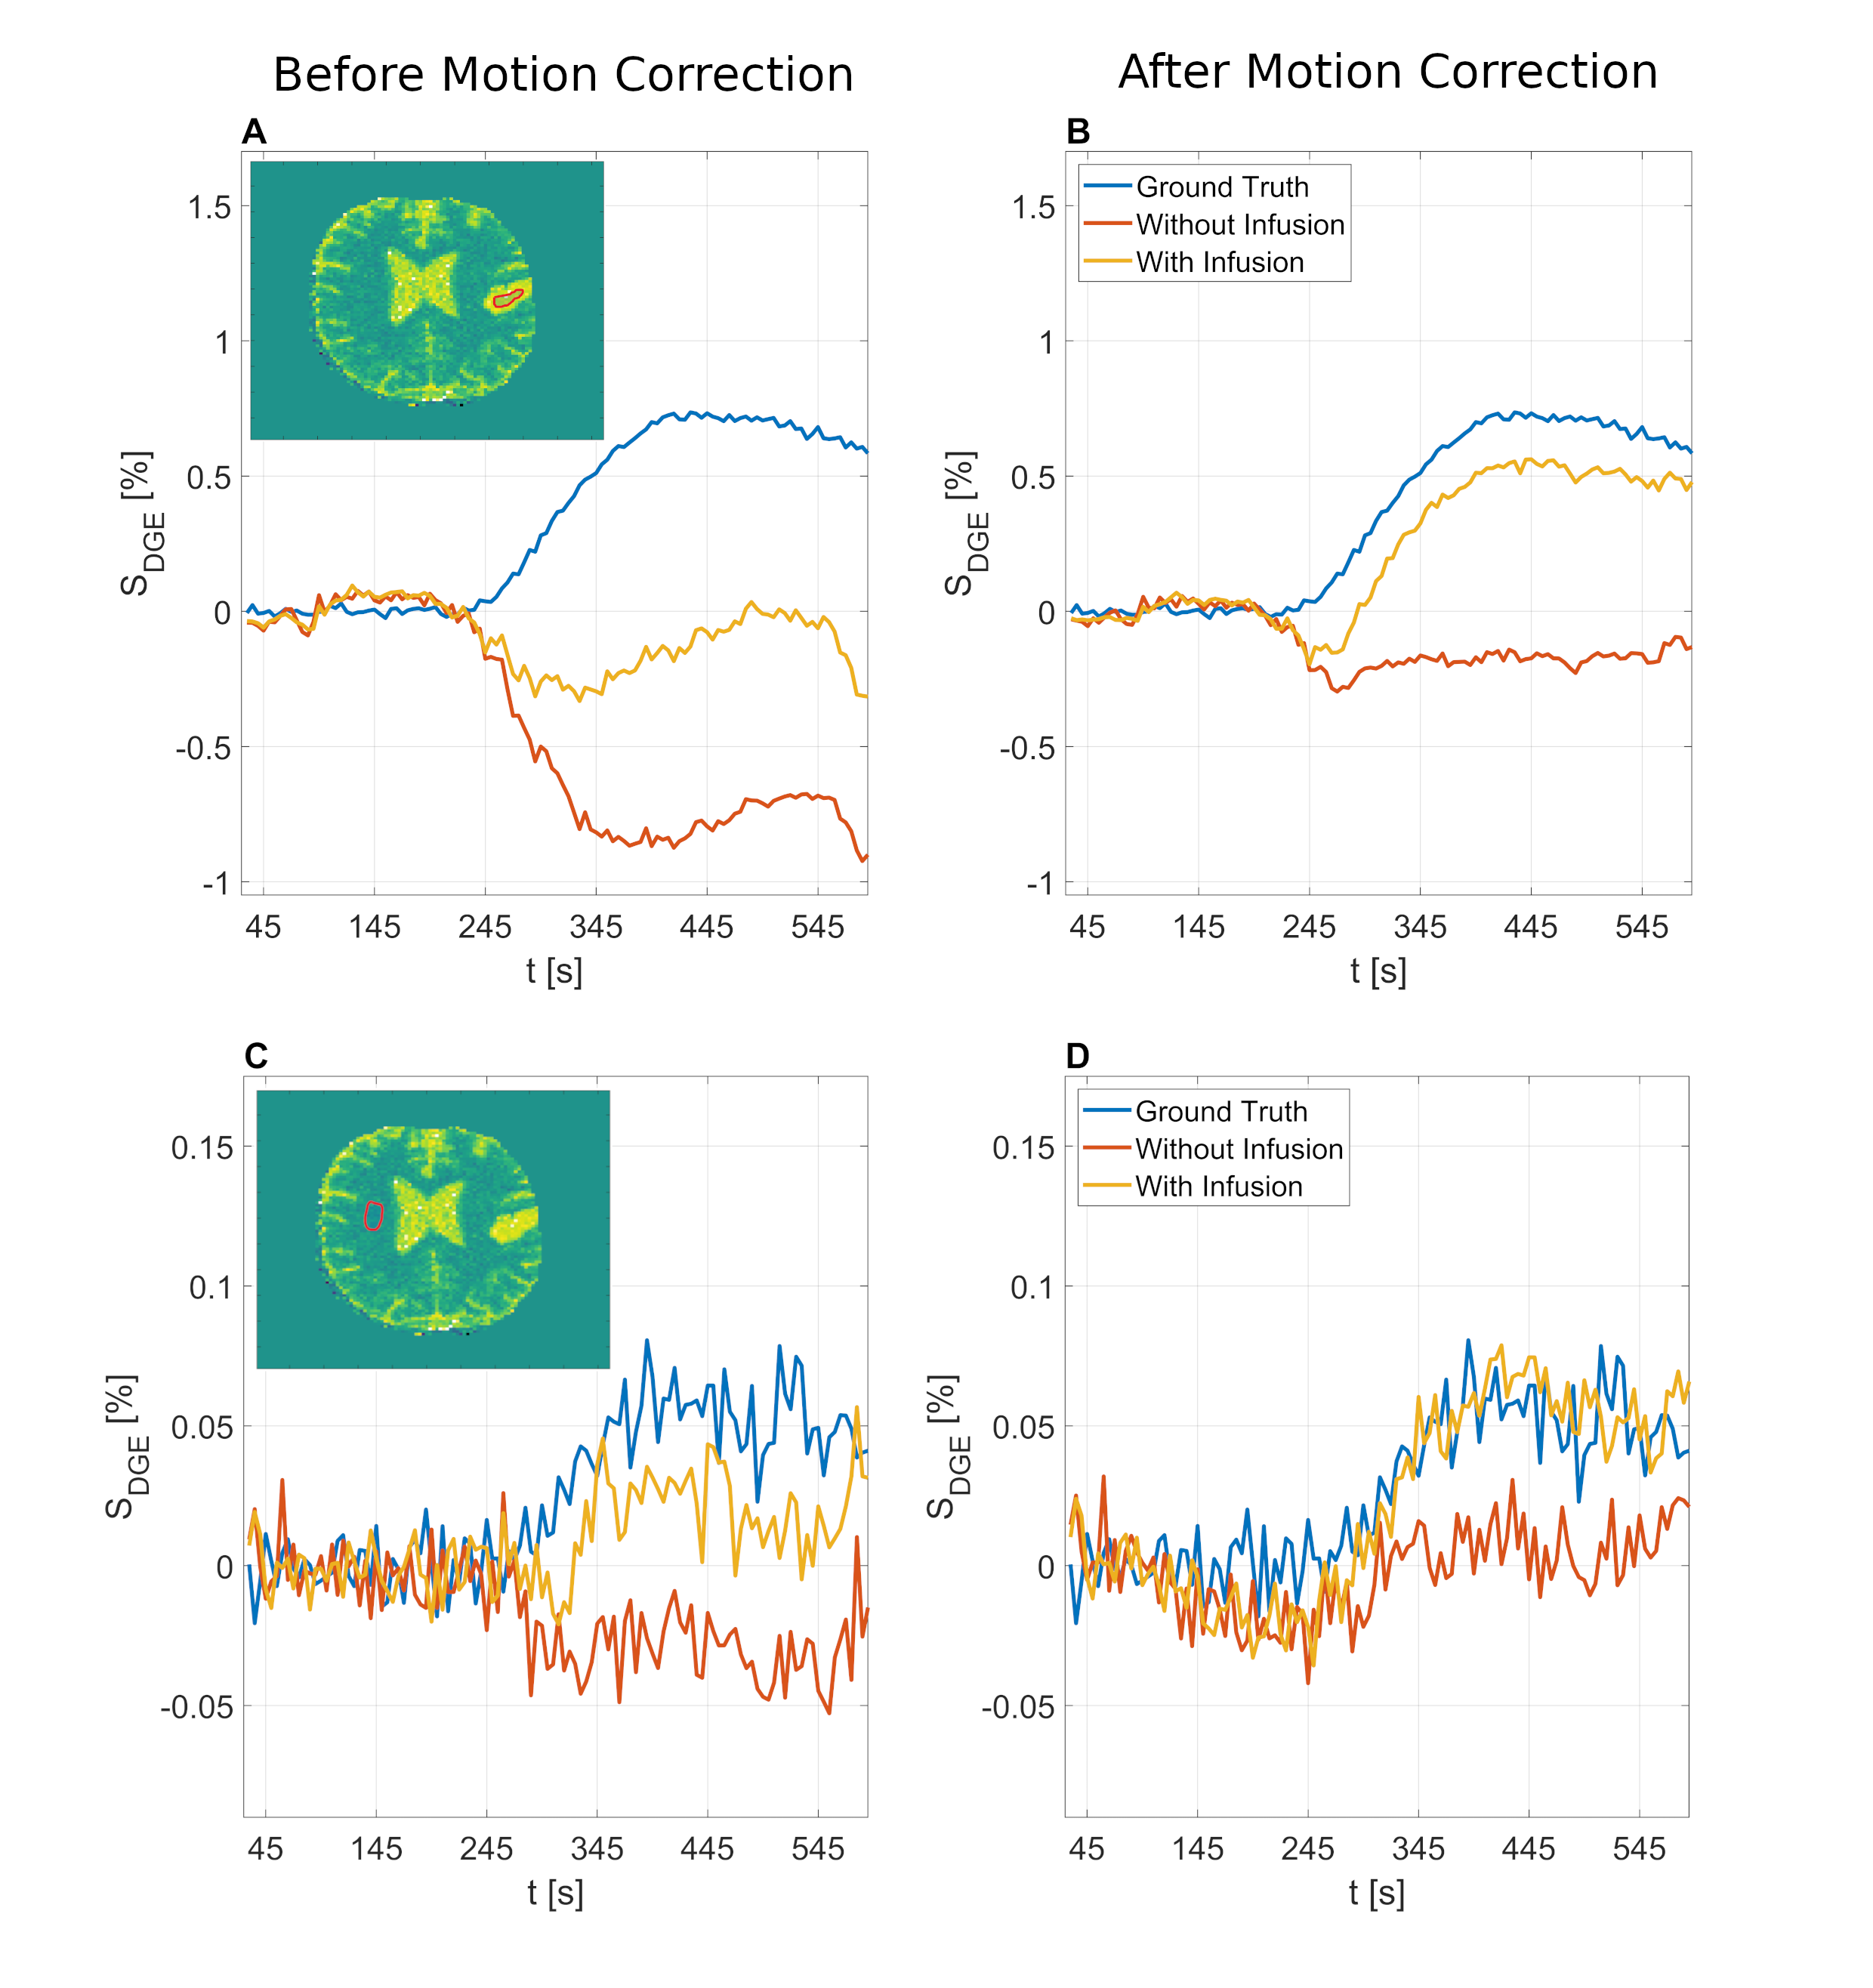
Figure 5: Dynamic
response curves derived from manually drawn ROIs in tumour (A, B) and white
matter (C, D) before (A, C) and after (B, D) motion correction with D-glucose
infusion and without infusion. The ground truth with D-glucose infusion and without
motion is added for comparison.