3698
Using Glutamate-Weighted MR Imaging (GluCEST) to Detect Effects of Transcranial Magnetic Stimulation1Center for Magnetic Resonance and Optical Imaging, Department of Radiology, University of Pennsylvania, Philadelphia, PA, United States, 2Department of Psychology, Drexel University, Philadelphia, PA, United States, 3Laboratory for Cognition and Neural Stimulation, Department of Neurology, University of Pennsylvania, Philadelphia, PA, United States
Synopsis
GluCEST was used to measure the effects of transcranial magnetic stimulation (TMS) to the motor cortex in healthy volunteers. Volunteers were scanned before and after stimulation or a sham, non-stimulating procedure. The data were analyzed by registering gluCEST maps to a cortical gray matter segmentation from Freesurfer and performing regional analysis. We find that this form of TMS, known as continuous theta-burst stimulation, had a consistent but non-local effect of decreasing the gluCEST signal in the brains of volunteers who received the stimulation in comparison to those who received a sham (placebo) procedure.
Introduction
Since seminal work in the early 1990s, transcranial magnetic stimulation (TMS) has emerged as a key noninvasive method to probe and ameliorate brain function in humans1,2,3. In current TMS practice, a figure-eight coil is used to generate a pulsed magnetic field that induces current in the brain tissue under the plane of coil, consequently inducing electrical current and resulting physiologic responses. TMS is currently being used as a therapy for neurological and psychiatric conditions, despite the fact that the mechanisms of the resulting effects are not yet clearly identified. Here, we used GluCEST4 to image the brains of subjects before and after undergoing a form of TMS known as continuous theta burst stimulation (cTBS) directed at the left motor cortex. Given the field’s current understanding of this particular TMS protocol, we hypothesized that cTBS would decrease the gluCEST signal in the either or both the ipsilateral and contralateral areas of the brain relative to the stimulation site.Methods
TMS and MEP measurements. cTBS as described previously5 was administered at 80% active motor threshold to a motor cortex (M1) site that induced motor evoked potentials (MEPs) as measured using electromyography on the right first dorsal interosseus muscle. This protocol was administered on ten healthy subjects (ages 21-40, 8 male/2 female) between repeated sessions of GluCEST imaging. During a separate session, MEP changes in the subjects were measured immediately after and 30 minutes after administration of cTBS. Five additional subjects (ages 20 – 35, 2 male/3 female) underwent the same MEP and MRI procedures but received only a “sham” (placebo) stimulation. Image Acquisition and Post-Processing. MR experiments were performed on a 7T scanner (MAGNETOM Terra, Siemens Healthcare, Erlangen, Germany) equipped with a 1Tx/32Rx head coil (Nova Medical, Wilmington, MA, USA). Prior to beginning the initial CEST measurement, structural and BOLD scans (fMRI) were acquired and processed immediately, in order to locate the target region. The 2D CEST slice capturing this area is acquired with a gradient-recalled echo sequence preceeded by a saturation module of eight 100ms Hanning-windowed pulses at 3.1uT RMS B1, with a duty cycle of 95%. The acquisition module used has TR/TE = 4.7/2.3ms at a 10 degree flip angle. The field of view is 156 x 192 mm and 5mm thick. Image post-processing was done with in-house Matlab code as described in4 and forthcoming work6. Regional and statistical analysis was performed using segmentations from Freesurfer8 and additional custom Matlab code, with visualizations shown in ITK- SNAP7.Results
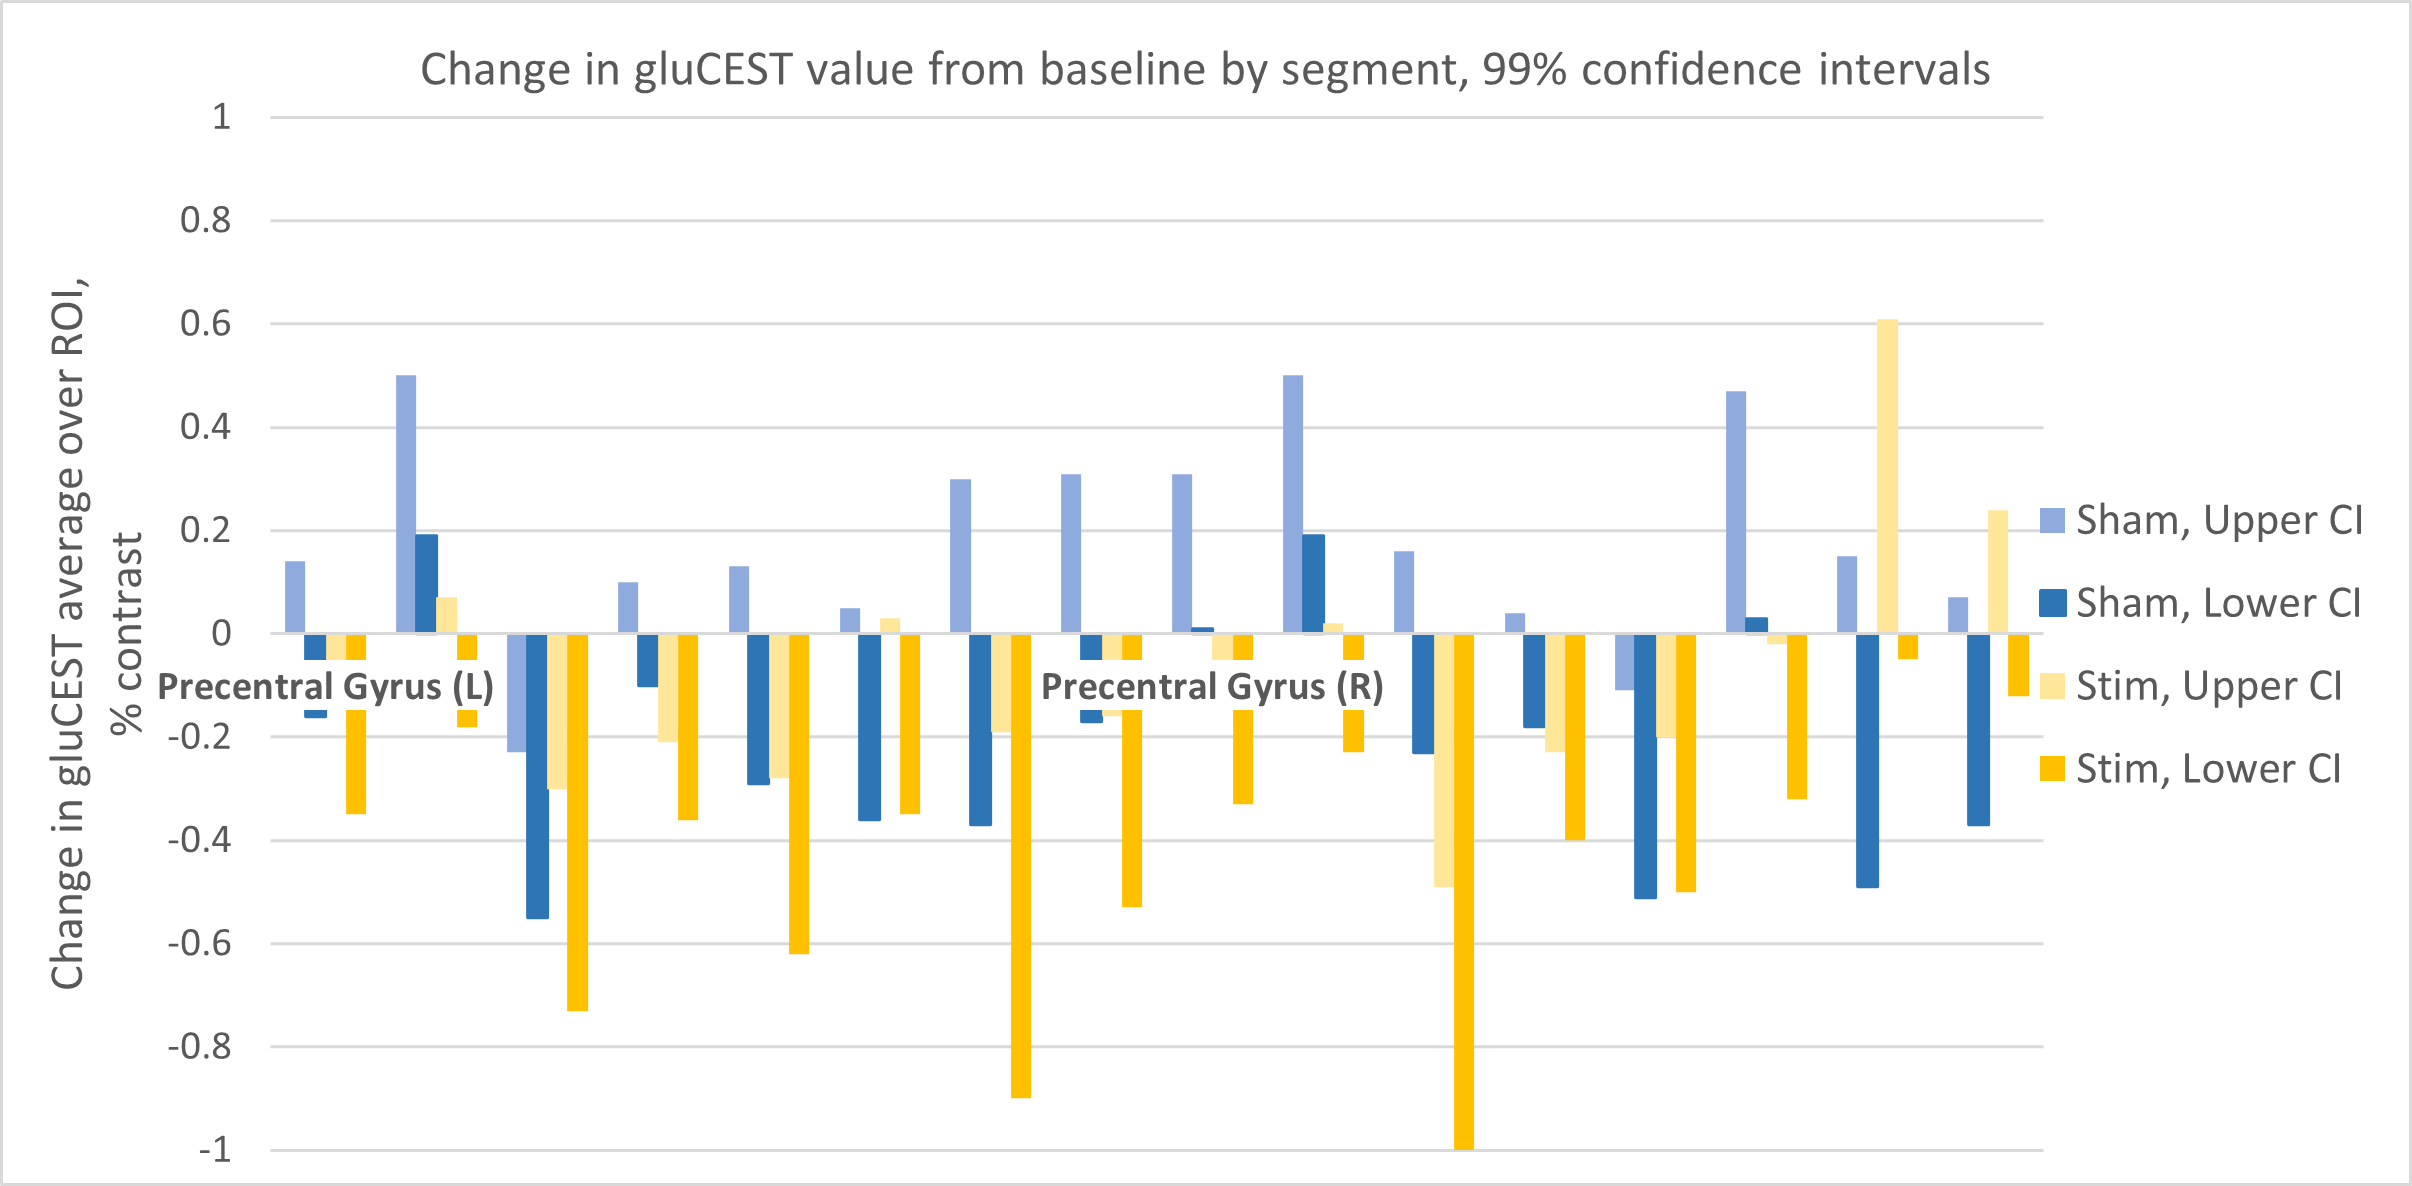
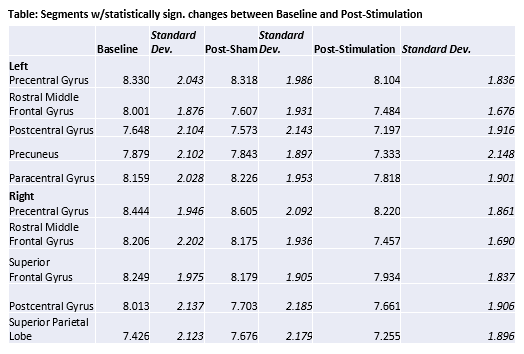
Figure 1 shows gluCEST data analyzed from all subjects, visualized as a projection on the anatomy of a single subject for the purpose of illustration. In each map shown, the average gluCEST by anatomical segment (mean of all pixels in all subjects) is represented by the color shade filling that segment. For example, the green arrow indicates the left precentral gyrus. The blue color filling this segment in the Baseline (A) and Post-Sham (B) maps corresponds to an average gluCEST value of ~8.3%, whereas the more purple color in the Post-Stimulation map (C) corresponds to ~8.1%, as indicated by the values in the Table. The Table gives mean gluCEST values for each segment where a statistically significant change was detected by Matlab’s unpaired T-test function where α = 0.01. Figure 2 plots the upper and lower confidence intervals (CI) calculated for all segments, including those not included in the Table. The order of the segments is as follows: {Precentral Gyrus, Caudal Middle Frontal Gyrus, Rostral Middle Frontal Gyrus, Superior Frontal Gyrus, Postcentral Gyrus, Superior Parietal Lobe, Precuneus, Paracentral Gyrus}.Discussion
cTBS is amongst those TMS protocols thought to be “inhibitory”, or decreasing the “excitability” of the targeted neural circuits. In the TMS field, this effect is generally quantified by measurement of a change in the MEP, but its molecular underpinnings are, to date, speculatory. We posited that a larger amount of glutmate may correlate with this property called “excitability” in the TMS field and that if cTBS is “inhibitory”, it may be effecting a physiological change by causing a transient decrease in the amount of glutamate in and around synapses.Our results indicate that cTBS indeed tends to decrease gluCEST values in the brains of subjects, as measured 20-30 minutes post-stimulation. What was suprising about these results was the apparent non-locality of the effect: while the targeted antaomy was the motor cortex (located in the anatomical segment labled as ‘Precentral Gyrus’), the gluCEST value in 10 of the 16 cortical gray matter segments analyzed (8 corresponding segments each in left/right hemisphere) exhibited a statistically significant change between baseline and post-stimulated measurements, and in all cases this change was negative (decrease in gluCEST). It should be noted that the same T-test indicates a “statisticaly significant” change in 6 of the segments for the post-sham data; however, the 99% confidence interval in these cases usually spans zero (see Figure 2).
Conclusions
The results presented here suggest that gluCEST may be a promising tool for studying TMS mediated metabolic changes in human brain. In the future, it may serve as a biomarker to help understand interpopulation variability in response to TMS.Acknowledgements
No acknowledgement found.References
1. Chervyakov AV, et al. Front. Hum. Neurosci 2015; 9:303.
2. Klomjai W, et al. Annals of Phys. Rehab. Med. 2015; 58: 208-213.
3. Lefaucher JP, et al. Clinical Neurophys. 2014; 125: 2150-2206.
4. Cai K, et al. Nat. Med. 2012: 18(2):302-306.
5. Huang YZ, et al. Neuron 2005; 45: 201-206.
6. Cember A, et al. Under Review.
7. Yushkevich P, et al. Neuroimage 2006; 31(3):1116-1128.
8. Available at: https://surfer.nmr.mgh.harvard.edu/
Figures
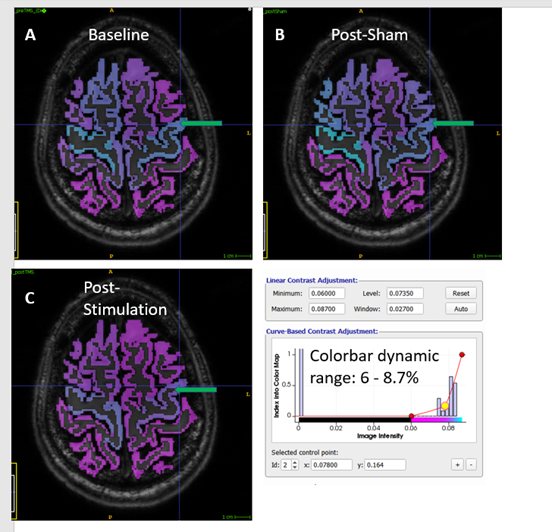
Figure 1. GluCEST maps: data from all subjects projected onto the anatomy of a single subject for visual representation. A) average gluCEST by segment, baseline (pre-stimulation) -15 subjects. B) post "sham" (placebo) stimulation - 5 subjects. C) post cTBS (real) stimulation -- 10 subjects. The colorscale is identical in all maps, with settings as shown in the screenshot from ITK-SNAP. Green arrow indicates the left precentral gyrus, the intended target of cTBS in stimulated subjects. Please see main text for full listing of anatomical segments treated distinctly in this analysis.