3697
Promising nerve imaging biomarkers for applications in inherited neuropathies1Neuroimaging Research, Barrow Neurological Institute, Phoenix, AZ, United States, 2Neurology, Wayne State University, Detroit, MI, United States
Synopsis
Five magnetization transfer (MT) imaging metrics extracted from the sciatic nerve (magnetization transfer ratio (MTR), cross-sectional area (CSA), circularity, eccentricity, and nerve fascicle density) were assessed for their ability to act as imaging biomarkers in patients with inherited neuropathies.
Introduction
Inherited neuropathies are a heterogeneous group of demyelinating/dysmyelinating (CMT1A: Charcot-Marie-Tooth Type 1A and HNPP: hereditary neuropathy with liability to pressure palsy) axonal (CMT2A: CMT Type 2A) neuropathies that typically present with distal limb muscle weakness, sensory loss, foot deformities, and absent reflexes1,2. Currently, disease progression is assessed using nerve conduction studies and disability scores (CMTNS: CMT neuropathy score). As clinical trials are anticipated, biomarkers are needed to monitor response and progression efficiently. Development of these biomarkers is made difficult by the slowly progressive nature of these diseases and the fact that therapies are more likely to slow or stop progression rather than reverse it3. A lack of suitable biomarkers leads to infeasible study sizes needed to show drug efficacy4. Other groups have used muscle-based biomarkers to measure effects downstream to the nerve damage5. The aim of this study is to evaluate five imaging metrics extracted from nerves, including both macrostructural (e.g. cross-sectional area, or CSA) and microstructural measures (e.g. myelin content from magnetization transfer, or MT).Methods
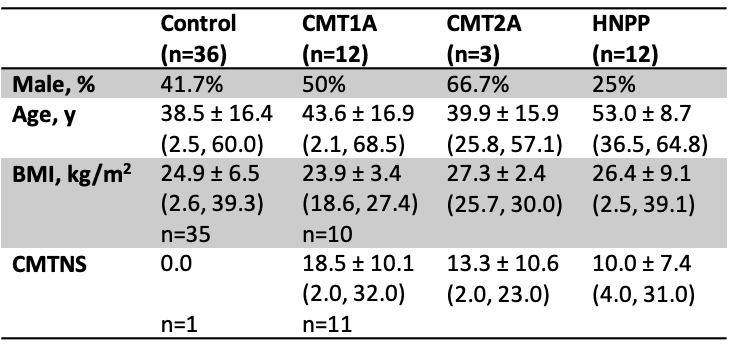
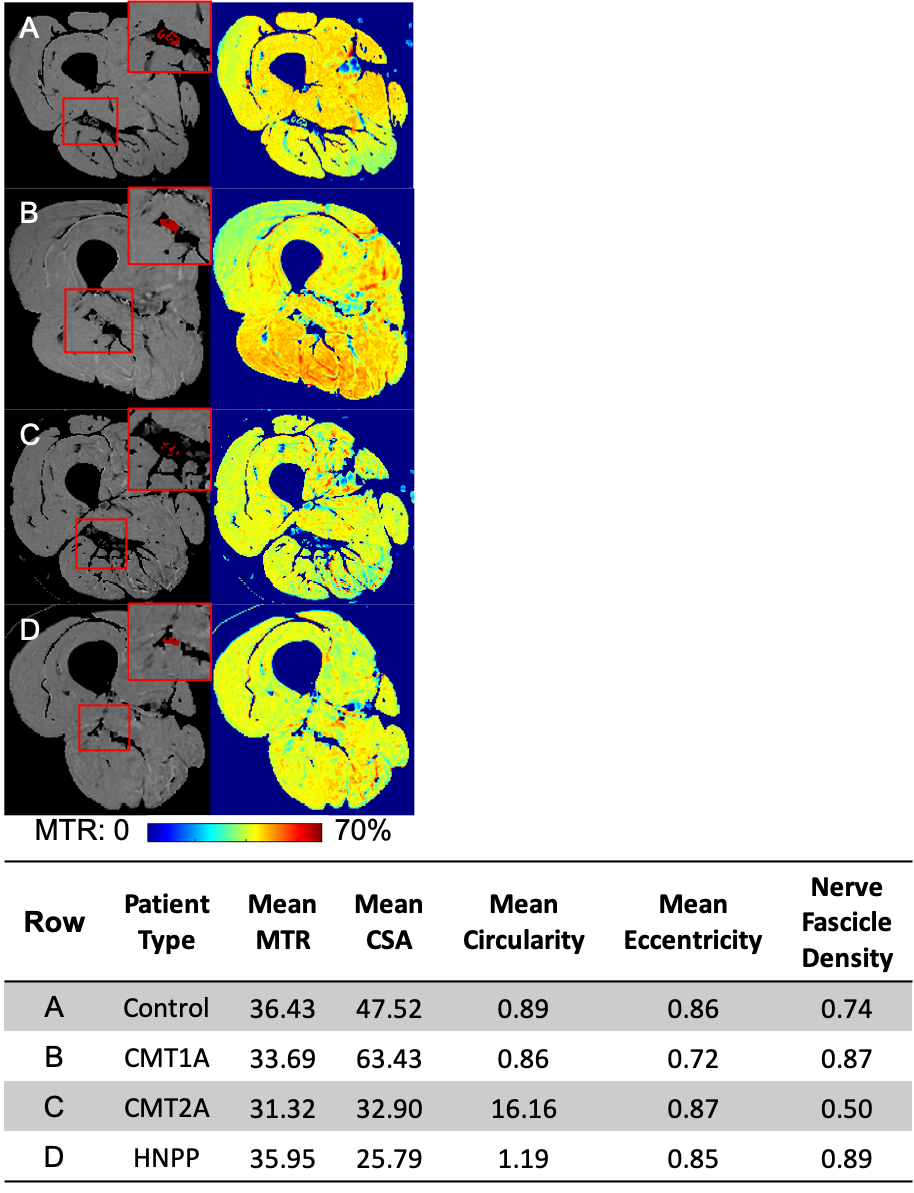
Twenty-seven patients and 36 healthy subjects were recruited (Table 1). The thigh of all subjects was scanned using a 3.0T Philips Ingenia MRI scanner. Images had an acquired/reconstructed resolution of 0.8x0.8x6mm3/0.75x0.75x3mm3 with a field-of-view. The repetition time, echo time, excitation flip angle, and scan time were 60 ms, 11 ms, 10°, and 6 minutes, respectively. Images were acquired with (MT-weighted) and without (reference) an MT saturation pulse (25-ms Gaussian, 1000° nominal flip angle, and 1.5 kHz off-resonance)6. A water-selective excitation pulse was applied to minimize bias from fat near the nerve, and the transmit radiofrequency (B1) was measured and corrected for7,8. The sciatic nerve (SN) was manually segmented and five metrics were extracted for each slice and averaged: MT ratio (MTR)9, CSA, circularity (roundness: computed as the ratio of the area to the perimeter2), eccentricity (the ratio of the distance between the eclipse foci to the major axis length), and nerve fascicle density (computed as the ratio of the area of nerve fascicles to the area encompassing the fascicles). Seven control subjects were scanned a second time (median=157 days between scans, range=7-189) to evaluate repeatability. Nine CMT patients received follow-up scans (media= 371 days between scans, range=251-1175) to evaluate responsiveness. A second rater identified the nerve on 13 subjects to evaluate inter-rater reliability. Clinical disability was measured by the CMTNS.Statistical analysis
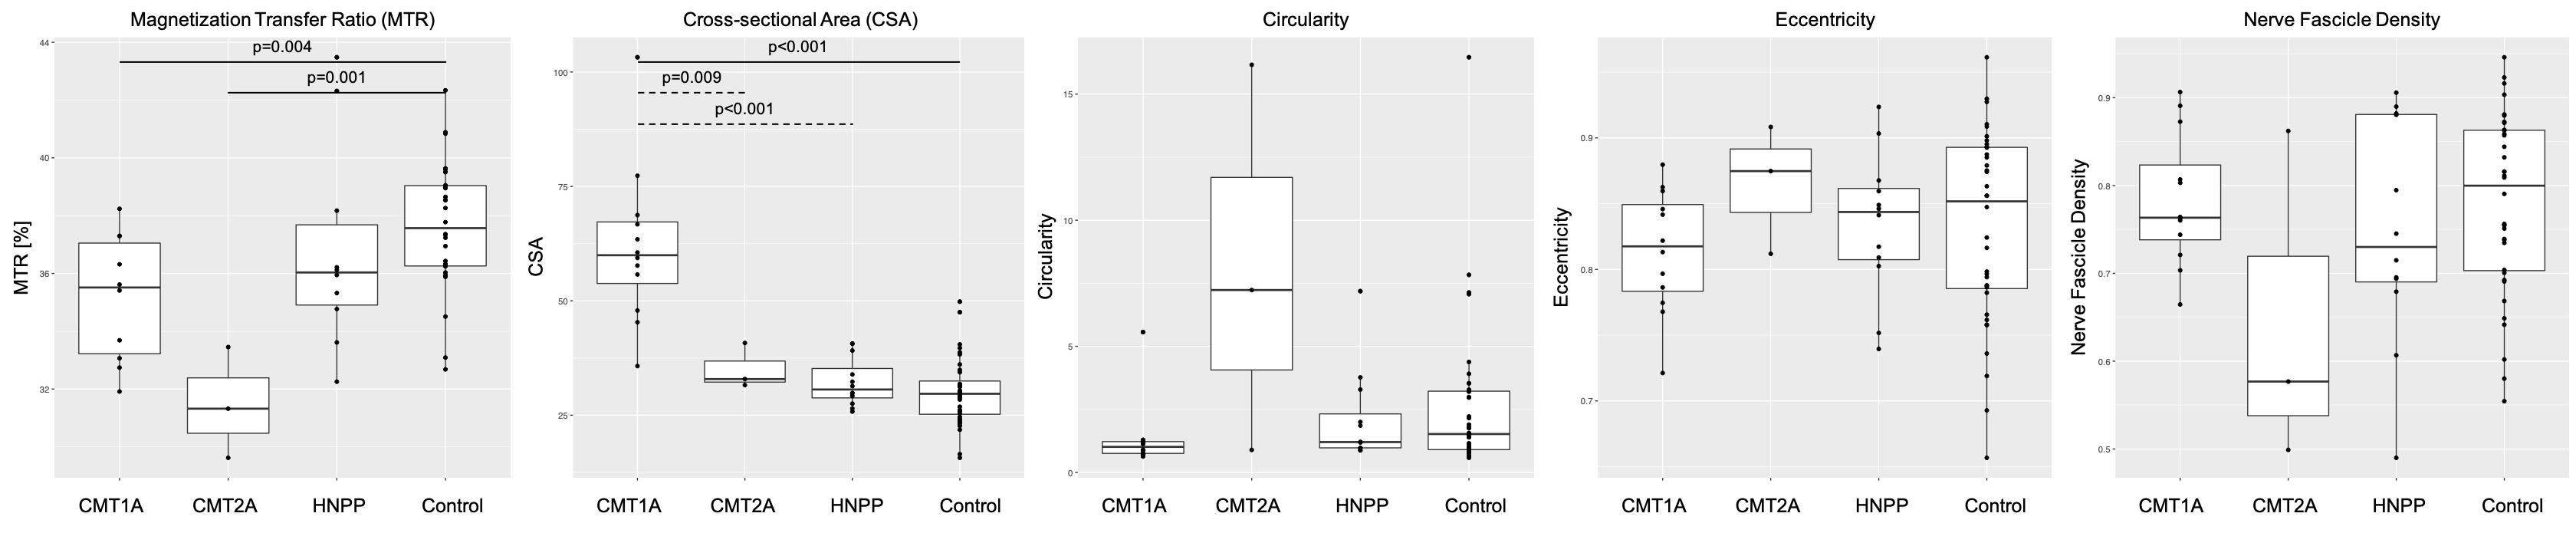
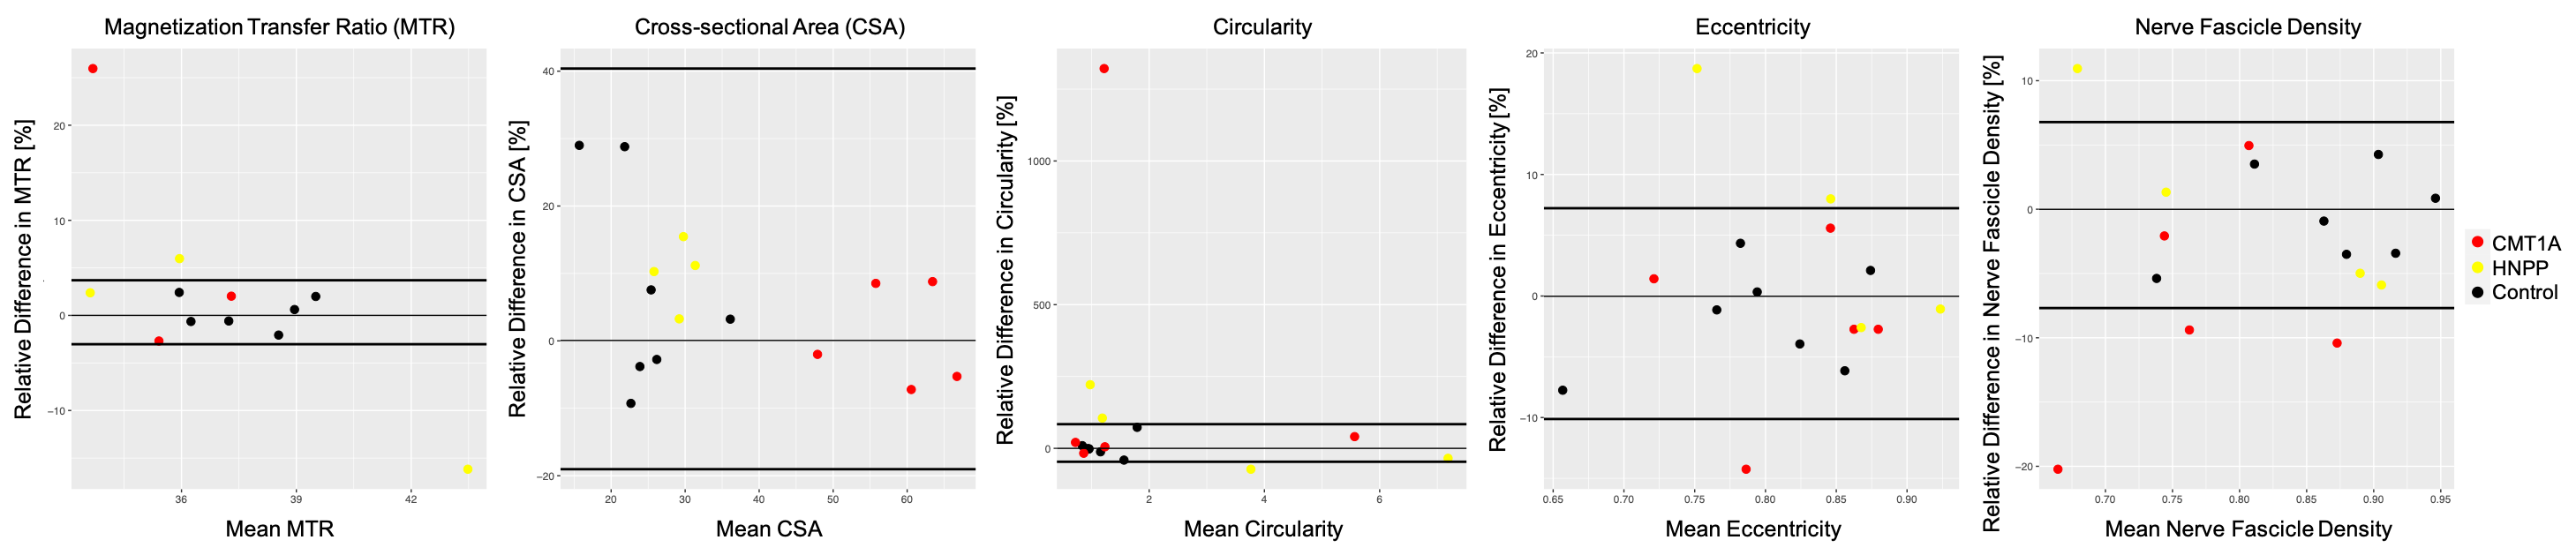
Differences between patients and control subjects were evaluated for each imaging metric using the Wilcoxon rank-sum test. Repeatability of each imaging measure was assessed using the intraclass correlation coefficient (ICC) and coefficient of variation (CV). In addition, the relative limits of agreement (LOA) were calculated according to Bland-Altman analysis10,11. A significant change in patients over time was defined as a change in an imaging metric outside of the corresponding LOA. Inter-rater reliability was determined for each potential imaging biomarker using ICC, CV, and the paired t-test. The potential imaging biomarkers were further assessed for relationships with CMTNS using Pearson correlation at the first scan. A multiple linear regression was performed to predict disability at the first scan based on a patient’s clinical (disease subtype, sex, age) and imaging features (MTR, CSA, circularity, eccentricity, nerve fascicle density). Backward feature selection based on Akaike Information Criterion (AIC) was performed to extract the most meaningful variables for this prediction. Finally, the concordance between the change in the potential imaging biomarkers and the change in disability (CMTNS) was assessed using Cohen’s weighted kappa. Disability was classified as increasing (ΔCMTNS>0), decreasing (ΔCMTNS<0), or no change (ΔCMTNS=0); and imaging metrics were classified as significantly increasing, decreasing, or no change according to the LOA.Results
Significant differences were found in MTR and CSA between patients and control subjects (p=0.001 and p<0.001, respectively). MTR, eccentricity, and nerve fascicle density were the most repeatable imaging metrics [ICC=0.92, 0.91, and 0.93; CV=1.72%, 4.26%, 3.58%, LOA=(-3.0%,3.7%),(-10.1%,7.2%),(-7.7%,6.8%)), respectively]. Patients had significant changes (outside LOA) for all imaging metrics except CSA, however, 5/6 patients had significant changes in MTR compared to 4/9, 3/9, and 4/9 for circularity, eccentricity, and nerve fascicle density, respectively. Between raters, MTR and nerve fascicle density were the most reliable (ICC>0.99, =0.99; CV=0.21%, 1.80%, respectively). Only CSA correlated significantly with disability (r=0.48, p=0.01). A multiple linear regression predicted disability based on disease type, sex, circularity, and eccentricity (adjusted R2=0.71, p<0.001). Changes in MTR corresponded best to changes in disability (weighted κ=0.73).Discussion
All five imaging metrics showed some potential as biomarkers. MTR was particularly promising, although it was not selected for inclusion in the multiple linear regression model. This may be related to the effect of tomacula in HNPP, which results in elevated baseline MTR values12. Not only were there significant differences in MTR between patients and control subjects, but it was repeatable, reliable, and change in MTR corresponded to change in disability. Other metrics demonstrated less evidence supporting their future development as imaging biomarkers in inherited neuropathies. Future work will focus on i) enrolling a larger cohort in our longitudinal study and ii) evaluating more quantitative MT methods for future multi-site studies in this cohort.Acknowledgements
This work was supported by the NINDS (R01NS115748), Detroit Medical Center Foundation (#2018-3328), and Philips Healthcare.
References
1. Katona I, Wu X, Feely SMEE, et al. PMP22 expression in dermal nerve myelin from patients with CMT1A. Brain [online serial]. 2009;132:1734–1740. Accessed at: https://doi.org/10.1093/brain/awp113.
2. Lewis RA, Sumner AJ. The electrodiagnostic distinctions between chronic familial and acquired demyelinative neuropathies. Neurology. United States; 1982;32:592–596.
3. Verhamme C, Van Schaik IN, Koelman JHTM, De Haan RJ, De Visser M. The natural history of Charcot-Marie-Tooth type 1A in adults: A 5-year follow-up study. Brain. 2009;132:3252–3262.
4. Shy ME, Chen L, Swan ER, et al. Neuropathy progression in Charcot-Marie-Tooth disease type 1A. Neurology [online serial]. 2008;70:378 LP – 383. Accessed at: http://n.neurology.org/content/70/5/378.abstract.
5. del Porto LA, Nicholson GA, Ketheswaren P. Correlation between muscle atrophy on MRI and manual strength testing in hereditary neuropathies. J Clin Neurosci. Epub 2010.
6. Smith SA, Farrell JAD, Jones CK, Reich DS, Calabresi PA, Van Zijl PCM. Pulsed magnetization transfer imaging with body coil transmission at 3 Tesla: Feasibility and application. Magn Reson Med. 2006;56:866–875.
7. Yarnykh VL. Actual flip-angle imaging in the pulsed steady state: A method for rapid three-dimensional mapping of the transmitted radiofrequency field. Magn Reson Med. 2007;57:192–200.
8. Sinclair CDJ, Morrow JM, Hanna MG, et al. Correcting radiofrequency inhomogeneity effects in skeletal muscle magnetisation transfer maps. NMR Biomed [online serial]. John Wiley & Sons, Ltd; 2012;25:262–270. Accessed at: https://doi.org/10.1002/nbm.1744.
9. Dortch RD, Dethrage LM, Gore JC, Smith SA, Li J. Proximal nerve magnetization transfer MRI relates to disability in Charcot-Marie-Tooth diseases. Neurology. 2014;83:1545–1553.
10. Bland JM, Altman DG. Measuring agreement in method comparison studies. Stat Methods Med Res. England; 1999;8:135–160.
11. Bland JM, Altman DG. Agreement Between Methods of Measurement with Multiple Observations Per Individual. J Biopharm Stat [online serial]. Taylor & Francis; 2007;17:571–582. Accessed at: https://doi.org/10.1080/10543400701329422.
12. Pridmore M, Castoro R, McCollum MS, Kang H, Li J, Dortch R. Length-dependent MRI of hereditary neuropathy with liability to pressure palsies. Ann Clin Transl Neurol [online serial]. John Wiley & Sons, Ltd; 2020;7:15–25. Accessed at: https://doi.org/10.1002/acn3.50953.
Figures