3696
Numerical Fit of Extrapolated Semisolid Magnetization Transfer Reference Signal (NEMR) for Improved pH-Weighted Imaging of Ischemic Stroke1Key Laboratory for Biomedical Engineering of Ministry of Education, Department of Biomedical Engineering, College of Biomedical Engineering & Instrument Science, Zhejiang University, Hangzhou, Zhejiang, China, 2The First Affiliated Hospital of Nanjing Medical University, Nanjing, Jiangsu, China, 3MR Collaboration, Siemens Healthcare Ltd., Shanghai, China
Synopsis
Amide proton transfer (APT) imaging can detect pH-related changes in ischemic stroke lesions. However, the widely-used magnetization transfer ratio asymmetry (MTRasym) analysis method is susceptible to various contamination sources. Here we improved the previous extrapolated semisolid magnetization transfer reference (EMR) method by numerical fitting of the EMR signal (NEMR) in the modified Bloch-McConnel equation. The proposed NEMR method was compared with the previous EMR method in Monte Carlo simulations, demonstrating superior accuracy. Furthermore, the NEMR maps were compared with EMR and MTRasym maps in nine ischemic stroke patients, yielding a better depiction of the ischemic lesions.
INTRODUCTION
Amide proton transfer (APT) imaging, a subtype of chemical exchange saturation transfer (CEST) imaging, has been successfully applied to ischemic stroke, given its ability to probe tissue pH (1). Since the widely-used magnetization transfer ratio asymmetry (MTRasym) analysis has contamination from multiple sources, several methods have been proposed to obtain cleaner CEST signals by removing confounding factors (2-4), among which the EMR (2) method generates an extrapolated semisolid magnetization transfer reference signal to be subtracted from the experimental z-spectrum. However, the EMR method is limited to a steady-state solution and cannot take into account the RF pulse shape used for CEST saturation. To address these limitations, we incorporated the lineshape of semisolid magnetization transfer (MT) pool into the Bloch-McConnell equation (5) and performed numerical fitting of the EMR signal (NEMR). The proposed NEMR method was compared with the original EMR method in stroke patients, demonstrating superior accuracy.THEORY
A two-pool system including water (pool a) and MT (pool b) subject to CEST saturation can be described as: $$\begin{array}{l}\frac{{d{M_x}_b}}{{dt}}=-\Delta{\omega_b}{M_{yb}}-{R_{2b}}{M_{xb}}\\\frac{{d{M_y}_b}}{{dt}}=\Delta{\omega_b}{M_{xb}}-{R_{2b}}{M_{yb}}-{\omega_1}{M_{zb}}\\\frac{{d{M_{zb}}}}{{dt}}={\omega_1}{M_{yb}}-{R_{1b}}({M_z}_b-{M_{0b}})+{k_{ab}}{M_{za}}-{k_{ba}}{M_z}_b\end{array}$$where $$$\Delta{\omega_b}$$$ is the frequency offset for pool b; R1b and R2b are longitudinal and transverse relaxation rates of pool b, respectively; kab is exchange rate from pool a to pool b and vice versa. Because T2 of MT is on the microsecond level, Mxb and Myb can be assumed to be in steady-state after millisecond-long saturation. Then Myb is
$${M}_{yb}=-\frac{{{\omega_1}{R_{2b}}}}{{{{(\Delta{\omega_b})}^2}+{{({R_{2b}})}^2}}}{M}_{zb}$$
which can be rewritten as $$${\omega_1}{M_y}_b=-{R}_{rfb}{M_z}_b$$$ by defining $$${R}_{rfb}=\frac{{\omega_1^2{R_{2b}}}}{{{{(\Delta{\omega_b})}^2}+{{({R_{2b}})}^2}}}$$$
Thus Mzb can be described as $$\frac{{d{M_{zb}}}}{{dt}}=-{R}_{rfb}{M}_{zb}-{R_{1b}}({M}_{zb}-{M_{0b}})+{k_{ab}}{M_{za}}-{k_{ba}}{M}_{zb}$$
Furthermore, Rrfb can be represented by a lineshape function g(), $$${R}_{rfb}{\rm{=}}\omega_1^2{\pi}g(2\pi\Delta{\omega_b})$$$, where g(·) could be lorentzian, gaussian, or super lorentzian (6). Hence, the lineshape of MT pool is integrated into Bloch-McConnell equation (5). Furthermore, when solving for Mzb numerically, the pulse shape of CEST satuation can be considered. In contrast, the conventional EMR method is based on analytical solution of the two-pool system that cannot take account of RF pulse shapes.
METHODS
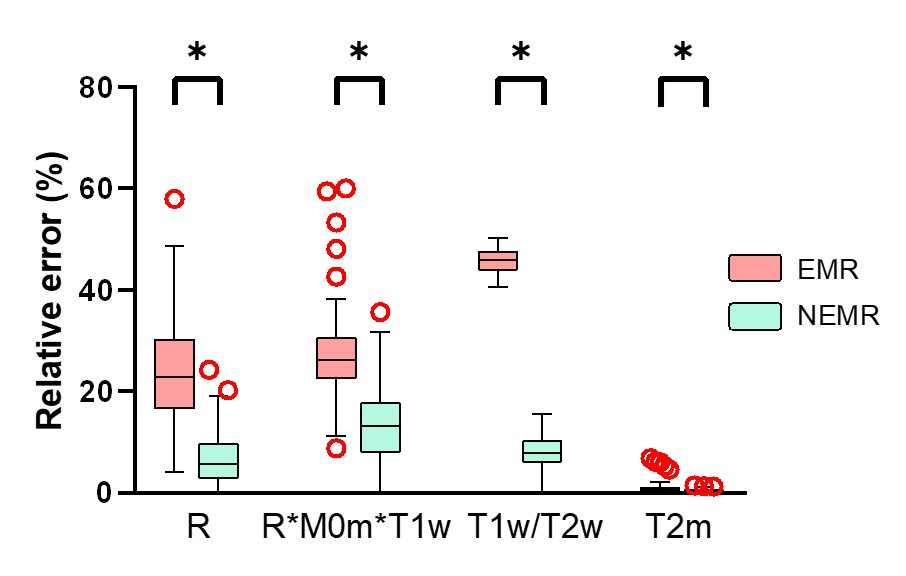
Monte Carlo simulation was performed to compare the accuracy of EMR and NEMR. First, a ground-truth z-spectrum was simulated using a four-pool model, including water, MT, amide, and NOE. Next, this z-spectrum was fitted using EMR and NEMR, respectively. Then, relative error of fitted parameters was calculated. This process was repeated 1000 times by using different exchange parameters in the four-pool model.Nine ischemic stroke patients were recruited, and were imaged on a 3T Siemens Skyra scanner. In addition to anatomical FLAIR and diffusion-weighted imaging (DWI) scans, CEST imaging was executed with frequency offsets from -6 to 80 ppm (7), TR/TE=3000/7.2ms, slice thickness=5mm, and FOV=185x185mm2. Depending on the status of the patients, CEST data were acquired using B1 power of 1, 1.5, and 2uT fully or partially, with each acquisition taking 3.1 minutes.
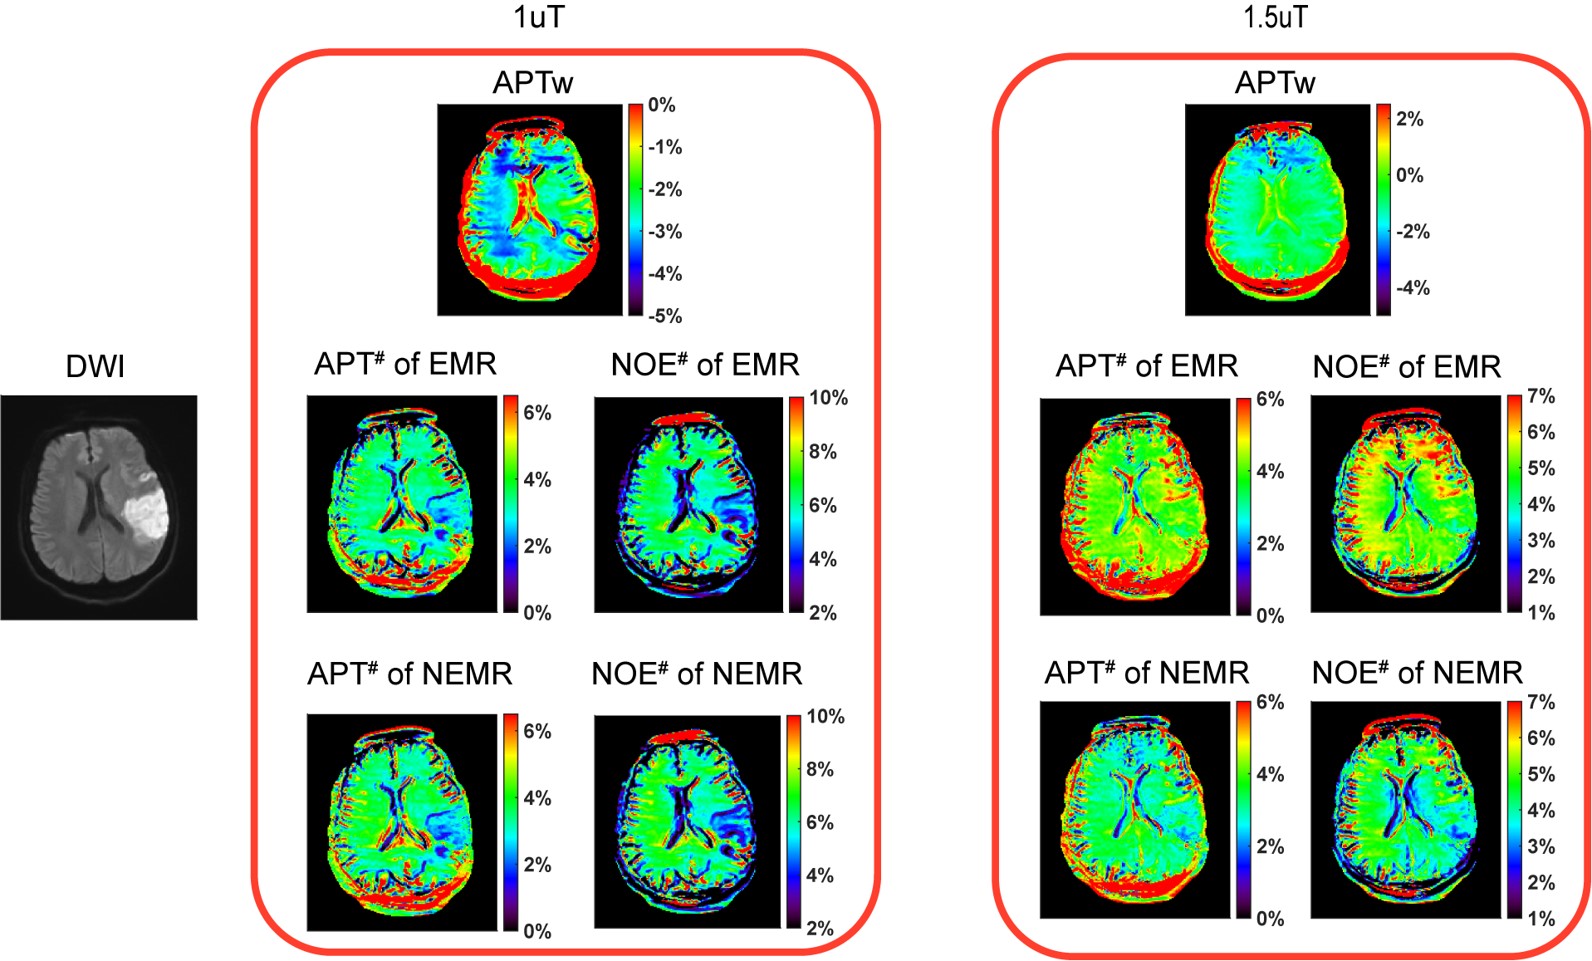
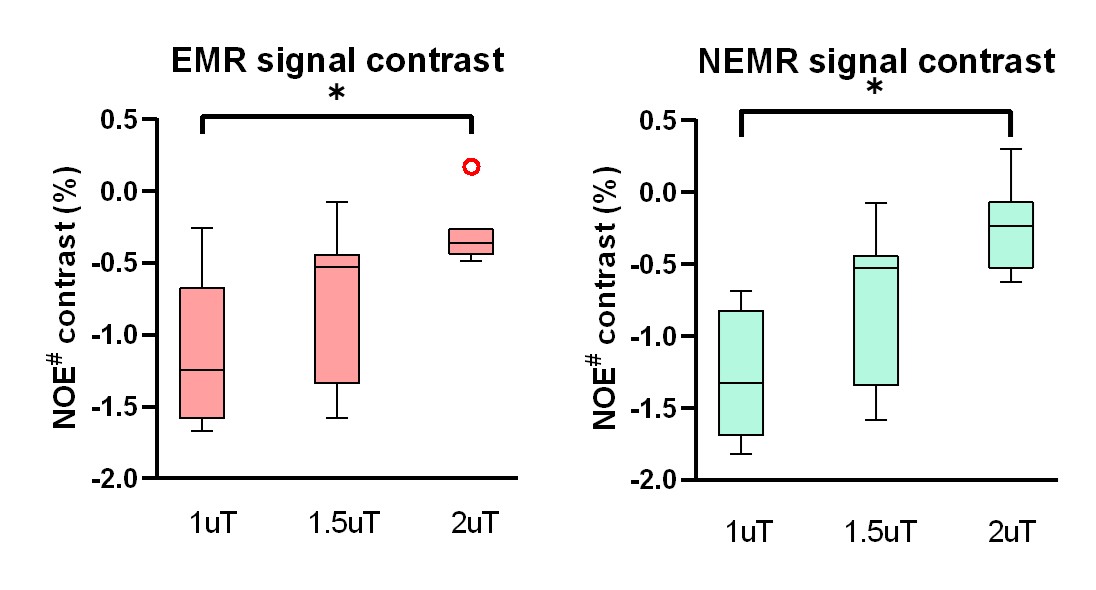
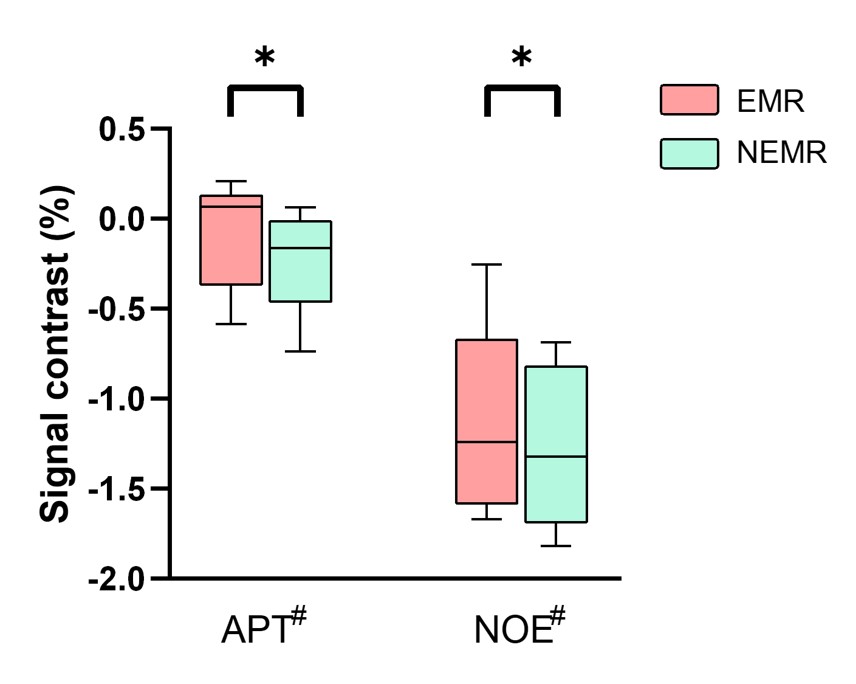
CEST images were registered to the frame at 3.5ppm (8), and B0-correction was performed with dual-echo gradient-echo images. Then EMR and NEMR fitting were performed voxelwise, respectively, giving corresponding APT# and NOE# map. Specifically, APT#=Zfit(3.5ppm)-Zexp(3.5ppm), NOE#=Zfit(-3.5ppm)-Zexp(-3.5ppm), where Zfit is the fitted z-spectrum by EMR or NEMR and Zexp is the z-spectrum acquired experimentally. An experienced radiologist delineated an ROI enclosing the whole ischemic lesion and drew a circular ROI in the contralateral normal-appearing white matter. Signal contrast was defined as difference of signal mean between these two ROIs. Paired t-test was conducted to compare (a) the signal contrast between EMR and NEMR, and (b) the signal contrast between 1uT, 1.5uT, and 2uT.
RESULTS
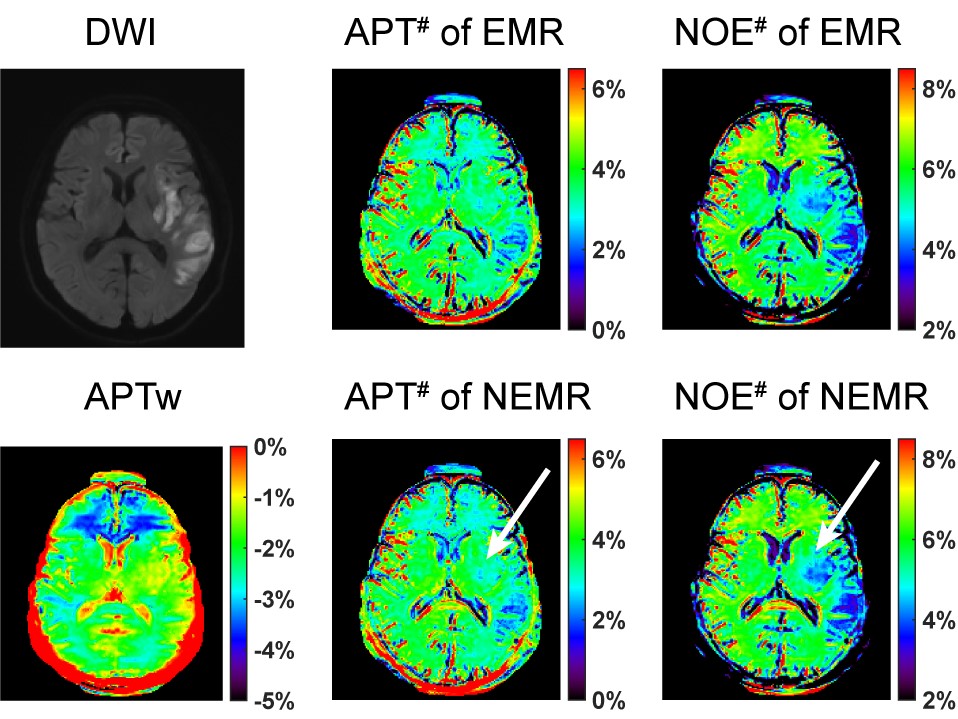
As shown in Fig. 1, the Monte Carlo simulation revealed that NEMR yielded significantly smaller relative errors than EMR (p<0.05). Fig. 2 shows the APT-weighted (APTw) image from MTRasym analysis had poor contrast and was not able to reliably separate the ischemic lesion from normal-appearing white matter. On the contrary, the APT# and NOE# maps exhibited marked hypointensity in the ischemic lesion. Notably, the ischemic lesion in APT# and NOE# images were better depicted at 1uT than 1.5uT. Furthermore, the NEMR maps presented a better contrast between the lesion and normal tissues than the EMR maps at a B1 level of 1.5uT. In Fig. 3, quantitative analysis revealed that both APT# (result not shown) and NOE# signals at 1uT had significantly stronger contrast (p<0.05) than those at 2uT. Fig. 4 illustrates that NEMR had significantly larger contrast (p<0.05) than EMR, and the NOE# contrast was greater than APT#. Fig. 5 presents images from a representative case at 1uT, which again demonstrated the superior contrast of NEMR maps to APTw images. Importantly, the NOE# map showed a lesion that was not visible on the APT# map.DISCUSSION and CONCLUSION
The EMR method assumes steady-state for both pools, which is often not valid, e.g. for saturation duration <1sec. Differently, NEMR assumes steady-state for MT pool only, which is essentially true. Besides, NEMR can incorporate the RF pulse shape during fitting which EMR cannot. Thus NEMR is more accurate than EMR, as indicated by the Monte Carlo simulation. Here, we demonstrated the superior performance of the proposed NEMR method to the previous EMR method. Furthermore, our results showed a B1 power of 1uT generated stronger contrast than 1.5uT and 2uT for imaging ischemic stroke lesions. Finally, the NOE# maps yielded better contrast than APT#.Acknowledgements
NSFC grant number: 81971605, 61801421.References
1. Zhou J, Payen JF, Wilson DA, Traystman RJ, Van Zijl PCM. Using the amide proton signals of intracellular proteins and peptides to detect pH effects in MRI. Nature Medicine. Volume 9; 2003. p 1085-1090.
2. Heo H-YY, Zhang Y, Jiang S, Lee D-HH, Zhou J. Quantitative assessment of amide proton transfer (APT) and nuclear overhauser enhancement (NOE) imaging with extrapolated semisolid magnetization transfer reference (EMR) signals: II. Comparison of three EMR models and application to human brain glioma at. Magnetic Resonance in Medicine. Volume 75; 2016. p 1630-1639.
3. Zaiß M, Schmitt B, Bachert P. Quantitative separation of CEST effect from magnetization transfer and spillover effects by Lorentzian-line-fit analysis of z-spectra. Journal of Magnetic Resonance. Volume 211; 2011. p 149-155.
4. Zaiss M, Xu J, Goerke S, Khan IS, Singer RJ, Gore JC, Gochberg DF, Bachert P. Inverse Z-spectrum analysis for spillover-, MT-, and T1-corrected steady-state pulsed CEST-MRI - application to pH-weighted MRI of acute stroke. NMR in Biomedicine. Volume 27; 2014. p 240-252.
5. Desmond KL, Stanisz GJ. Understanding quantitative pulsed CEST in the presence of MT. Magnetic Resonance in Medicine. Volume 67; 2012. p 979-990.
6. Morrison C, Mark Henkelman R. A Model for Magnetization Transfer in Tissues. Magnetic Resonance in Medicine. Volume 33; 1995. p 475-482.
7. Heo HY, Zhang Y, Jiang S, Lee DH, Zhou J. Quantitative assessment of amide proton transfer (APT) and nuclear overhauser enhancement (NOE) imaging with extrapolated semisolid magnetization transfer reference (EMR) signals: II. Comparison of three EMR models and application to human brain glioma at 3 Tesla. Magn Reson Med 2016;75(4):1630-1639.
8. Zhang Y, Heo HY, Lee DH, Zhao X, Jiang S, Zhang K, Li H, Zhou J. Selecting the reference image for registration of CEST series. J Magn Reson Imaging 2016;43(3):756-761.
Figures