3695
The Effect of Cariporide on Tumour Intracellular pH: A Study in Rat C6 Glioma using AACID-CEST-MRI1Robarts Research Institute, London, ON, Canada, 2Department of Medical Biophysics, Western University, London, ON, Canada
Synopsis
The results of this study suggest the non-invasive assessment of tissue pH may provide value for monitoring the progression of diseases such as brain cancer that involve pH modification. This study also demonstrates that tissue acidification in a rat C6 glioma model and in contralateral tissue can be measured following drug injection by endogenous pH-weighted contrast produced by CEST-MRI. It is noteworthy that drugs like cariporide can acidify tumours and normal tissue. However, such drugs could enhance the efficacy of existing standard treatments in different human malignancies.
Introduction
Chemical exchange saturation transfer (CEST) MRI is sensitive to tissue microenvironment properties, particularly intracellular pH (pHi), and provides high spatial and temporal resolution. In CEST-MRI, contrast is produced by exciting exchangeable tissue protons at their specific absorption frequency and observing the transfer of magnetization to bulk tissue water. These exchangeable protons are commonly found in amide and amine groups on mobile proteins and peptides predominantly within the intracellular space. The magnitude of the CEST contrast is related to the proton exchange rate, which is pH-dependent.1-4 A CEST-MRI technique called amine and amide concentration-independent detection (AACID) was previously developed as an indicator of tissue pH. The AACID value is inversely related to tissue pH and heavily weighted to the intracellular compartments. AACID utilizes the ratio of endogenous amine and amide protons to measure pH.4,5 In biological systems, the difference between intracellular and extracellular pH produces a pH gradient across the cell membrane. The regulation of this pH gradient is dependent on the activity of several plasma membrane transporters that facilitate hydrogen ion efflux to maintain an alkaline pHi and acidic extracellular pH in tumour cells. One of the main acid-base regulators in cells is the Na+/H+ exchanger isoform 1 (NHE1), which has been directly associated with pH regulation.6-10 One way to achieve tumour acidification as a therapeutic strategy is by blocking the NHE1 transporter trapping protons inside cells and consequently decreasing pHi. Cariporide is a potent inhibitor of NHE1 which is well tolerated in humans.11-15 We have shown that cariporide can selectively acidify U87MG gliomas in mice.16 The goal of this study is to monitor the change in tumour pHi over time to determine whether cariporide can also selectively acidify rat C6 glioblastoma following cariporide injection. We hypothesized that blockage of NHE1 by cariporide would produce selective intracellular tumour acidification detectable by AACID-CEST-MRI.Methods
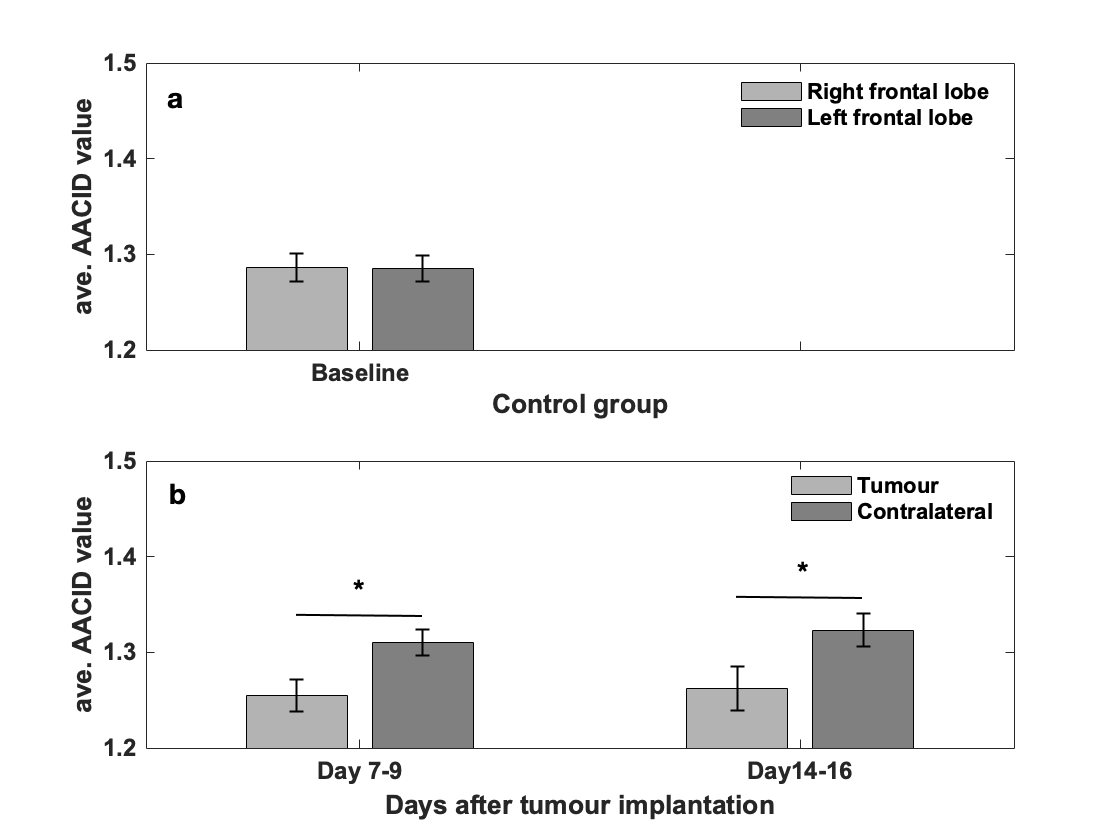
Approximately 106 C6 glioma cells were manually injected over 5 minutes into the right frontal lobe of 8-week-old male Wistar rats. CEST-MRI was performed at baseline (N=15), 7-9 days (N=22), and 14-16 days (N=20) post-implantation on a 9.4T MRI. To evaluate the effect of cariporide on tumour pHi, six rats received an intraperitoneal injection of cariporide (dose:6mg/kg in 2ml) two weeks after tumour implantation. Animals received the drug inside the scanner to measure the change in pHi following injection. CEST images were acquired for the slice of interest using a fast-spin-echo pulse sequence with parameters: TR=7s, TE=25ms, preceded by a continuous wave RF pulse with an amplitude of 1.5μT and 4s duration. CEST images were acquired at saturation frequencies from 1.2-6.6ppm to create CEST spectra for each pixel in the image and analyzed using custom software in MATLAB. AACID values are typically measured on a pixel-by-pixel basis to generate parametric maps.4 A paired t-test was used to measure differences in AACID value between tumour and contralateral regions between day 7-9 and 14-16, and to measure changes in AACID value following injection of cariporide.Results
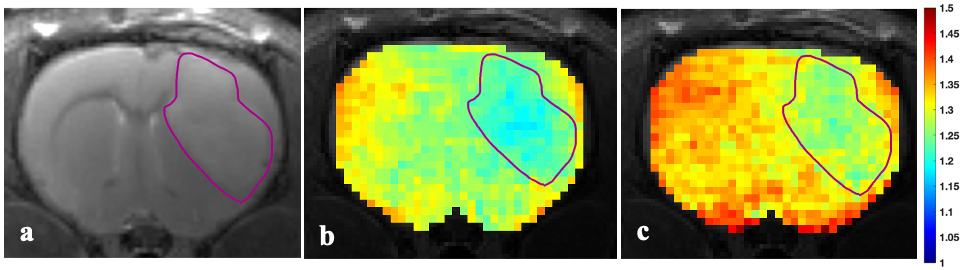
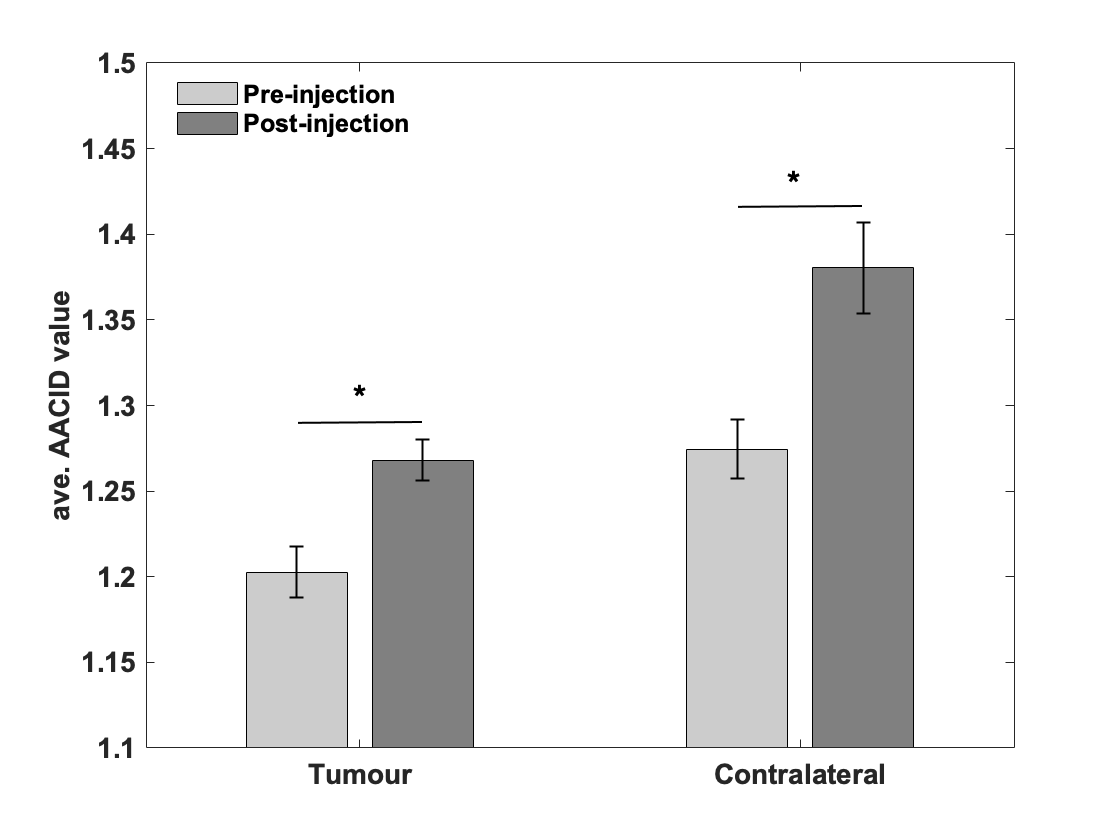
Figure 1-a shows that there is no difference in AACID value between left and right frontal lobes in control animals. The average AACID values at baseline were almost similar to values in contralateral tissue at days 7-9, shown in figure 1-b. The AACID value was significantly lower (p<0.05) in the tumour compared to the contralateral region at day 7-9 and day 14-16 (Fig.1-b). At day 7-9, the average AACID value was 4.4% lower in the tumour compared to the contralateral side indicating a 0.22 higher pHi. At day 14-16, the average AACID value was ~4.8% lower in tumour indicating a 0.24 higher pHi. Approximately five minutes after drug injection we started collecting CEST-MRI for three hours. For data analysis, we compare the first maximum change in AACID value post-injection with the pre-injection value. Figure 2 shows the AACID maps obtained for a representative experimental rat superimposed on an anatomical image, before and after injection of cariporide. Approximately 60 minutes after injection, the average AACID value in the tumour significantly increased (p<0.05). The average AACID value in tumour post-injection was 5.4% higher compared to pre-injection corresponding to a 0.26 lower pHi (Fig.3). The average AACID value in contralateral tissue also increased in a similar way.Discussion and Conclusion
pH may be a valuable indicator in the assessment of brain cancer progression. Our results showed the expected difference between tumour and contralateral tissue pHi in the rat C6 glioma model. However, this difference was consistent over time. This result was surprising as a previous study in this model showed a greater pHi in the tumour as size increased.17 The rat C6 glioma is a highly proliferating and aggressive solid tumour. Therefore, the bulk effect of the tumour at day 14-16 may have impacted contralateral tissue pH.18 Interestingly, we also did not observe selective tumour acidification following injection as was observed in the mouse U87MG glioma model.16 The reason for this discrepancy is currently unknown but may be related to potential differences in tumour vasculature compared to the U87MG model that may limit the ability of cariporide to infiltrate the tumour.19 Future work includes increasing cariporide dose and modifying our quantification method to increase the temporal stability of the AACID measurement.Acknowledgements
We gratefully acknowledge funding for this research from the Canadian Institutes of Health Research (CIHR) and The Canada First Research Excellence Fund (the Fund).References
1. Ward KM, Balaban RS. Determination of pH using water protons and chemical exchange dependent saturation transfer (CEST). Magn Reson Med. 2000; 44(5):799-802.
2. Jinyuan Zhou, Peter C.M. van Zijl, Chemical exchange saturation transfer imaging and spectroscopy, Progress in Nuclear Magnetic Resonance Spectroscopy 2006; 48(2-3): 109-136,
3. Terreno E, Castelli DD Aime S. Encoding the frequency dependence in MRI contrast media: the emerging class of CEST agents. Contrast Media Mol Imaging. 2010; 5(2):78-98.
4. McVicar N, Li AX, Gonçalves DF, Bellyou M, Meakin SO, Prado MA, Bartha R. Quantitative tissue pH measurement during cerebral ischemia using amine and amide concentration-independent detection (AACID) with MRI. J Cereb Blood Flow Metab. 2014; 34(4):690-8.
5. McVicar N, Li AX, Meakin SO, Bartha R. Imaging chemical exchange saturation transfer (CEST) effects following tumor-selective acidification using lonidamine. NMR Biomed. 2015; 28(5):566-75.
6. Swietach P. What is pH regulation and why do cancer cells need it. Cancer and Metastasis Review 2019; 38(1):5-15.
7. Boedtkjer E, Bunch L, Pedersen SF. Physiology, pharmacology and pathophysiology of the pH regulatory transport proteins NHE1 and NBCn1: similarities, differences, and implications for cancer therapy. Curr Pharm Des. 2012; 18(10):1345-71.
8. Webb BA, Chimenti M, Jacobson MP, Barber DL. Dysregulated pH: a perfect storm for cancer progression. Nat Rev Cancer. 2011; 11(9):671-7.
9. Gerweck LE, Seetharaman K. Cellular pH gradient in tumor versus normal tissue: potential exploitation for the treatment of cancer. Cancer Res. 1996; 56(6):1194-8.
10. Srivastava J, Barber DL, Jacobson MP. Intracellular pH sensors: design principles and functional significance. Physiology (Bethesda). 2007; 22:30-9.
11. Harguindey, S., Arranz, J.L., Polo Orozco, J.D. et al. Cariporide and other new and powerful NHE1 inhibitors as potentially selective anticancer drugs – an integral molecular/biochemical/metabolic/clinical approach after one hundred years of cancer research. J Transl Med 2013; 11(282):1-17.
12. Guan, X., Hasan, M.N., Begum, G. et al. Blockade of Na/H exchanger stimulates glioma tumor immunogenicity and enhances combinatorial TMZ and anti-PD-1 therapy. Cell Death and Dissease 2018; 9(1010):1-16
13. Stock C, Pedersen SF. Roles of pH and the Na+/H+ exchanger NHE1 in cancer: From cell biology and animal models to an emerging translational perspective? Semin Cancer Biol. 2017; 43:5-16.
14. J. Reshkin, Stephan; A. Cardone, Rosa; Harguindey, Salvador. Na+-H+ Exchanger, pH Regulation and Cancer. Recent Patents on Anti-Cancer Drug Discovery 2013; 8(1):85-99.
15. Loo SY, Chang MK, Chua CS, Kumar AP, Pervaiz S, Clement MV. NHE-1: a promising target for novel anti-cancer therapeutics. Curr Pharm Des. 2012; 18(10):1372-82.
16. Albatany M, Li A, Meakin S, Bartha R. In vivo detection of acute intracellular acidification in glioblastoma multiforme following a single dose of cariporide. Int J Clin Oncol. 2018; 23(5):812-819.
17. Lim H, Albatany M, Martínez-Santiesteban F, Bartha R, Scholl TJ. Longitudinal Measurements of Intra- and Extracellular pH Gradient in a Rat Model of Glioma. Tomography. 2018; 4(2):46-54.
18. Stocchetti N, Maas AI. Traumatic intracranial hypertension. N Engl J Med. 2014; 370:2121-2130.
19. Doblas S, He T, Saunders D, Pearson J, Hoyle J, Smith N, Lerner M, Towner RA. Glioma morphology and tumor-induced vascular alterations revealed in seven rodent glioma models by in vivo magnetic resonance imaging and angiography. J Magn Reson Imaging. 2010; 32(2):267-75.
Figures