3685
Value of Radiomics Approach Based on ADC Maps in Identifying the Pathologic Grade of Endometrioid Endometrial Adenocarcinoma1The First Affiliated Hospital of Dalian Medical University, Dalian, China, 2GE Healthcare, Shanghai, Shenyang, China
Synopsis
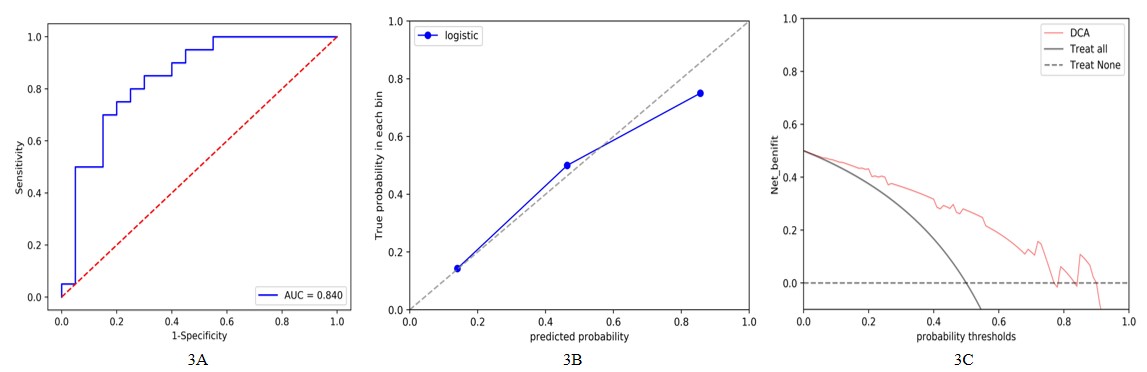
The aim of the study is to explore the value of radiomics approach based on apparent diffusion coefficient (ADC) maps in identifying the pathologic grade of Endometrioid Endometrial Adenocarcinoma (EEA). The AUC of the logistic model based on ADC maps in the testing set was 0.840, sensitivity of 80.0%, specificity of 75.0% and accuracy of 77.5%. The radiomics based on ADC maps has shown a promising identification potential in the pathologic grade of EEA.
Introduction
Endometrial cancer (EC) accounting for about 20-30% of endometrial malignant tumors in female reproductive system [1], is the most common gynecologic malignancy. Accounting for about 80%, Endometrioid Endometrial Adenocarcinoma (EEA) is the most common histological type of EC [2-3]. Compared with poor differentiated EEA (pathological grade G3) and other types of endometrial cancer, moderately and well differentiated EEA with (pathological grade G2 and G1, accounting for about 80%, is less invasive and lymphatic space infiltration is less likely to occur, thus the prognosis would be better [2-3]. Magnetic resonance imaging (MRI) has proved to be the most accurate noninvasive modality for staging endometrial and cervical carcinomas and often helps with risk stratification and making treatment decisions [4]. Diffusion-weighted imaging (DWI), a functional imaging technique whose contrast derives from the differences in restriction of motion of water molecules, has been steadily applied into the clinical use in patients with gynecologic malignancies [4]. Radiomics is capable of high-throughput quantitative extracting image features, and obtain information about heterogeneity within tumor tissues [5]. The present study aims to explore the value of radiomics approach based on ADC maps in identifying the pathologic grade of EEA.Methods
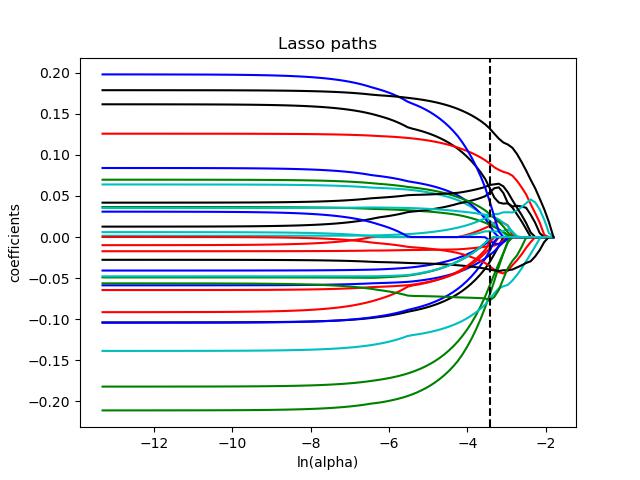
Ninety-seven patients with EEA, who underwent MRI including DWI sequence preoperatively from January 2012 to December 2019 in our hospital, were enrolled in this retrospective study. All the 97 cases were verified by operative pathology, 65 cases of which were well-moderate differentiated grade (including well differentiated, well-moderate differentiated, and moderate differentiated grade EEA), 32 cases of which were poor differentiated grade (including poor differentiated, moderate-poor differentiated grade EEA). Using synthetic minority oversampling technique (SMOTE) to achieve the poor differentiated grade EEA of 65 cases in order to avoid bias. Then, all the cases were divided into a training set (n= 90) and a testing set (n= 40). A total of 402 radiomics features were extracted from ADC maps based on the three-dimensional volume of the tumors. Least absolute shrinkage and selection operator (LASSO) methods, variance analysis and correlation analysis were used for data dimension reduction. Multivariate logistic regression was used to build a model. The identification performance and clinical application value were evaluated by the area under the curve (AUC) of receiver operating characteristics (ROC) and decision curves analysis (DCA).Results
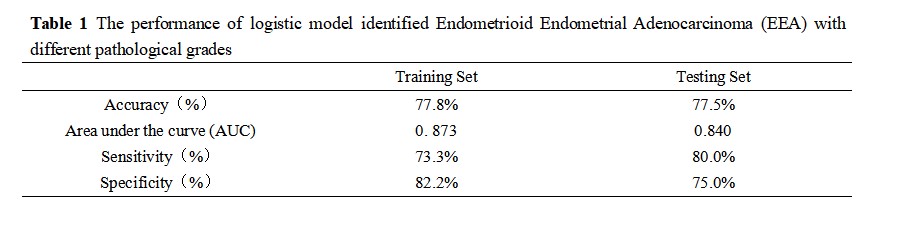
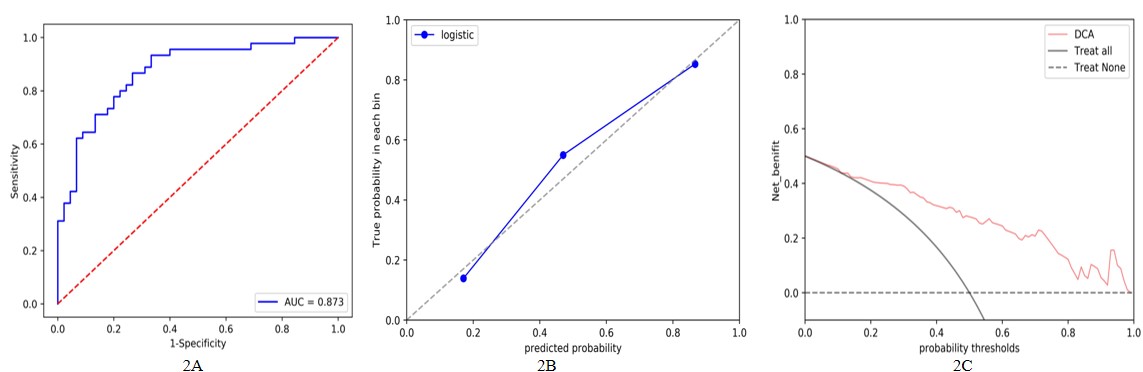
Eight radiomics features related to EEA pathological grade were finally obtained by dimensional reduction (Figure 1). The AUC of the logistic model based on ADC maps in the testing set was 0.840, sensitivity of 80.0%, specificity of 75.0% and accuracy of 77.5% (Table 1; Figure 2-3).Discussion and Conclusion
The accuracy, AUC, sensitivity, specificity, positive predictive value and negative predictive value were 77.5%, 0.84, 80.0% and 75.0%, 76.2% and 78.9%, respectively. A total of 8 features of great value that are finally included in the prediction model belong to three categories: Gray Level Co-occurrence Matrix (GLCM), Run Length Matrix (RLM) and Form Factor Features. GLCM features (entropy and Haralick features) reflect the complexity and texture thickness of lesions. The more complex the lesions are, the more chaotic and uneven the image texture is, and the greater the heterogeneity is [6]. RLM (SRE, LRHGLE, LRLGLE) mainly describes the complexity of lesions and the thickness of texture. The higher the value, the more complex and heterogeneous of the lesions [7]. The present study suggested that the radiomics based on ADC maps shown a promising identification potential in the pathologic grade of EEA.Acknowledgements
References
[1] Morice P, Leary A, Creutzberg C, et al. Endometrial cancer[J]. The Lancet, London, England: 2016, 387(10023): 1094–1108.
[2] Berceanu C, Stepan A E, Mehedinţu C, et al. Morphological, imaging and surgical aspects in endometrial endometrioid adenocarcinoma[J]. Romanian Journal of Morphology and Embryology, 2016, 57(3): 995–1002.
[3] Amant F, Moerman P, Neven P, et al. Endometrial cancer.[J]. Lancet (London, England), 2005, 366(9484): 491–505.
[4] Marcal L P. Optimization of MR Imaging for Pretreatment Evaluation of Patients with Endometrial and Cervical Cancer[J]. Radiographics A Review Publication of the Radiological Society of North America Inc, 2014, 34(4): 1082–1098.
[5] Lambin P, Rios-Velazquez E, Leijenaar R, et al. Radiomics: Extracting more information from medical images using advanced feature analysis[J]. European Journal of Cancer, 2012, 48(4): 441–446.
[6] Haralick R M. Textural features for image classification. IEEE Transaction on Systems, Man, and Cybernetics[J]. SMC, 1973, 3(6): 610–621.
[7] Galloway M M. Textural analysis using gray level run length[J]. 1975, 4(2): 172–179.
Figures