3678
Comparing the analysis of diffusion data from the placenta with a biexponential Intravoxel incoherent motion model and an Inverse Laplace
George Hutchinson1 and Penny Gowland1
1Sir Peter Mansfield Imaging Centre, University of Nottingham, Nottingham, United Kingdom
1Sir Peter Mansfield Imaging Centre, University of Nottingham, Nottingham, United Kingdom
Synopsis
Analysing diffusion data from the placenta using with biexponential Intravoxel incoherent motion model and an Inverse Laplace approach gave similar final measures for the IVIM fraction and Kurtosis but not for D.
Introduction
A biexponential diffusion model is commonly used to fit diffusion data in the placenta and other organs. One limitation of this approach is the need to predetermining the number of exponents to be fit for: commonly in the placenta a two-component bi-exponential decay is assumed, but this is not necessarily correct in such a complex organ. The goal of this abstract is to compare the fitting diffusion weighted placental images using the IVIM and an ILT approaches.Method
This study was approved by the local ethics committee and 8 women gave informed consent to participate. Data was acquired on a Philips 3T Achieva system using a respiratory gated pulse gradient spin echo (PGSE) EPI sequence at 19 b-values (0-500 s/mm2), with the women in the left or right decubitus position to avoid vena cava compression. The placenta was masked by hand into four ROIs (chorionic plate, placenta, basal plate, and uterine wall) on the b=0 image with regions of very low signal thresholded out as they could not be fit properly. Data was fit using an L2 regularised inverse Laplace model (Figure 1A), where the coefficient of the L2 term was selected by inspecting data using an L-curve [1] method and picking a suitable value to use over all subjects. 80 diffusion coefficients were evenly spaced through log-space from 10-1 to 103 (x10-3mm2/s) to be used for the final weightings from the ILT. The ILT could not fit negative weightings and had no boundary conditions. The weights over each ILT were normalised to sum to 1.Data was then fit voxelwise using non-linear least squares to a biexponential IVIM model with kurtosis included, $$$S=S_0[(1-f_{ivim})e^{-bD+(1/6)b^2D^2K}+f_{ivim}e^{-bD^*}$$$ limiting fit parameters to plausible biological values (Figure 1B). We selected various measures from the ILT to compare to the IVIM model:
IVIM comparison: The ILTs were then analysed using a similar method to Slator et al.[2], splitting the ILT into 3 sections (Figure 1A), with the section boundaries altered to better correspond to our data. The normalised weights were summed over each section as a measure of how much weighting each region had in a particular voxel. The normalised weights averaged over each section of the ILT was plotted against the corresponding mean IVIM value for each ROI (placenta etc) and each participant.
K comparison: The value of the ILT at D = 10-1 mm2/s was averaged over all voxels for each ROI for each subject and this was compared to the corresponding value of K, since kurtosis would be expected to correspond to very low diffusion coefficients in the ILT.
D comparison: A peak finding algorithm was used to find the location of every peak in the ILT for each voxel, and histograms of these peak positions were found over each ROI (Figure 2). The mode peak D for each section was then found for each ROI and each participant, and was plotted against the mean D from the IVIM fit.
Results
Figure 3 shows the summed weightings across sections 2 and 3 of the ILT both increase with increasing $$$f_{ivim}$$$. Figure 4 shows that the mean of the first ILT weighting (at D = 10-1 (x10-3 mm2/s)) shows positive correlation with K. Histograms of the positions of peaks within the ILT (figure 4) all contain a large peak within section 1 with a well-defined mode. This mode is plotted against the average diffusion coefficient from the biexponential fit in figure 5. The values are comparable but are typically larger from the ILT.Discussion
fIVIM from the IVIM model is strongly correlated with the weightings of regions 2 and 3 from the ILT of the data for all placental ROIs. This is expected as an increase in weighting in regions 2 and 3 correspond to regions that have a higher proportion of spins travelling faster than the diffusion coefficient of a voxel.Kurtosis data from the IVIM model also correlated well with the first value of the ILT. As the ILT has no way to compensate for Kurtosis.
However the ILT tends to estimate a higher diffusion coefficient than the IVIM fit and the results are not well correlated. It is possible that selecting the mode of the peaks from the ILT histograms skews the results.
These results suggest that similar information is available using both ILT and IVIM analysis of the placental. However the data from the chorionic plate always correlated differently compared to the other ROIs, possibly related to the faster flows in that area and the estimates of D did not agree well. This suggests that there may be slightly different information available from the ILT. Future work will aim at finding additional summary measures from the ILT that can provide additional information over traditional IVIM analysis.
Acknowledgements
This work was funded by the National Institute of Health and the EPSRC/MRC Oxford Nottingham Biomedical Imaging CDT.References
[1] - Hansen P. The l-curve and its use in the numerical treatment of inverse problems. Computational Inverse Problems in Electrocardiology, 4:119–142, 2001.
[2] - Slator, PJ, Hutter, J, Palombo, M. Combined diffusion‐relaxometry MRI to identify dysfunction in the human placenta. Magn Reson Med. 2019; 82: 95– 106. https://doi.org/10.1002/mrm.27733
Figures
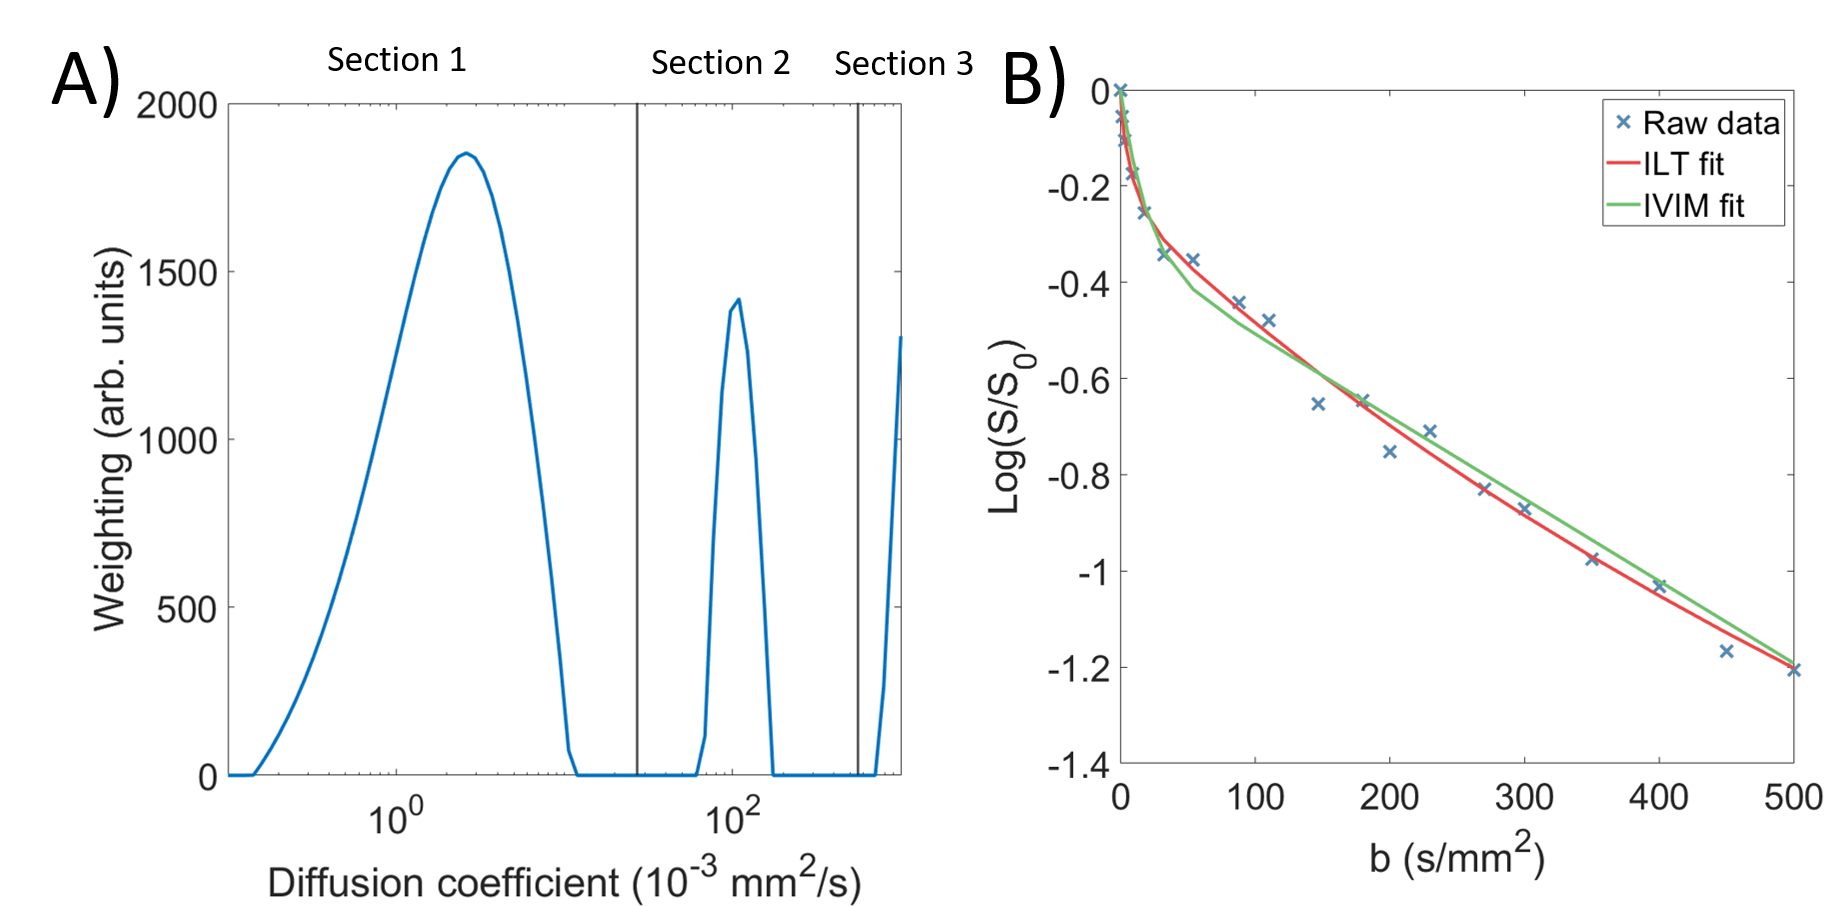
Figure 1 A) Example of weightings produced by the ILT for a single voxel, with sections overlaid.
B) The same voxel, with the fits produced by both the IVIM and ILT models
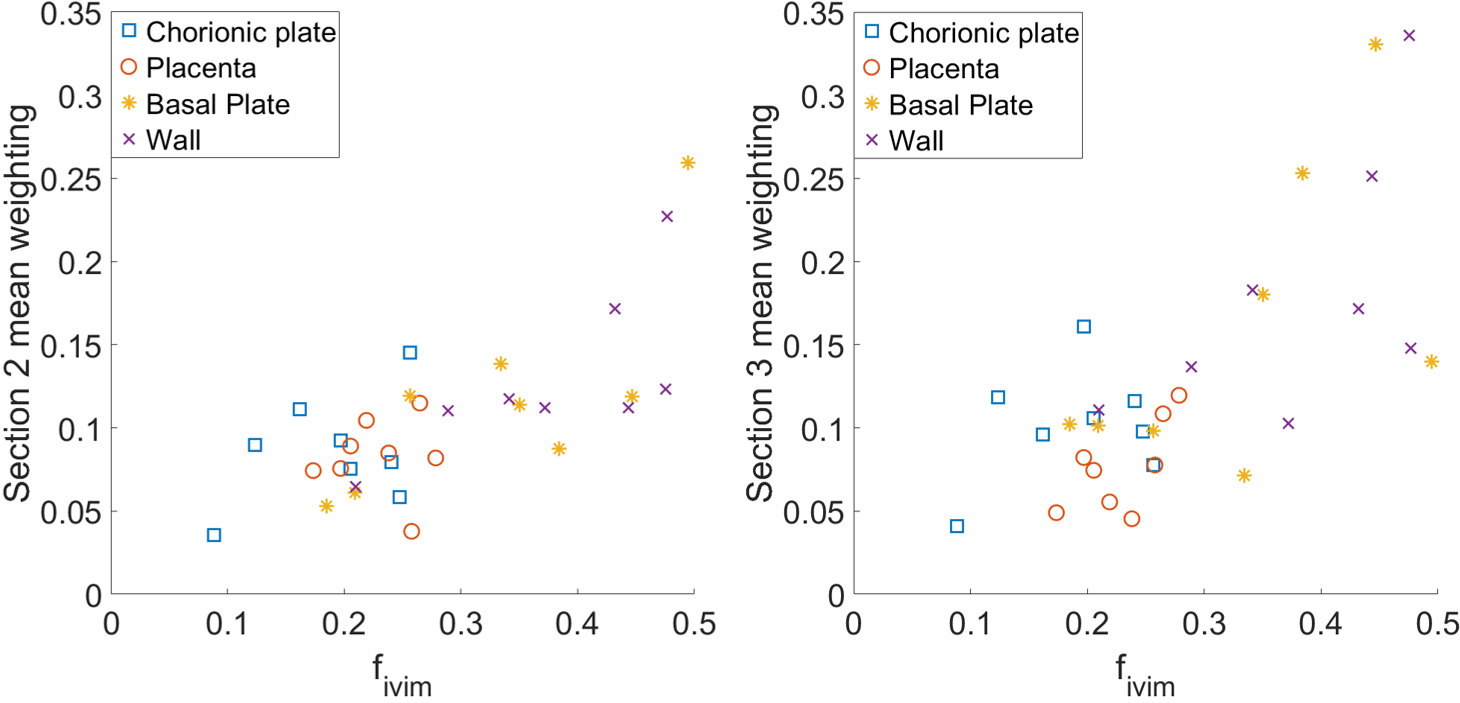
Figure 2 Mean weightings from A) section 2 and B) section 3 plotted against mean $$$f_{IVIM}$$$ for all participants over all regions.
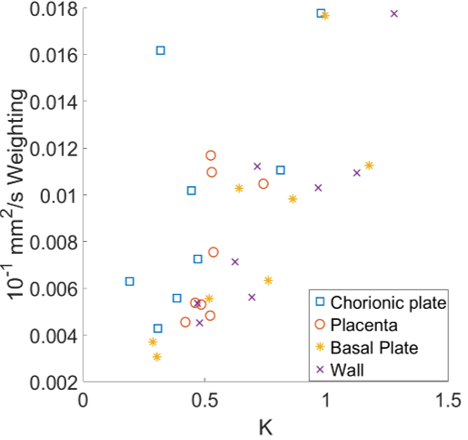
Figure 3 Mean weightings from the lowest diffusion coefficient fit for by the ILT against K for all participants over all regions.
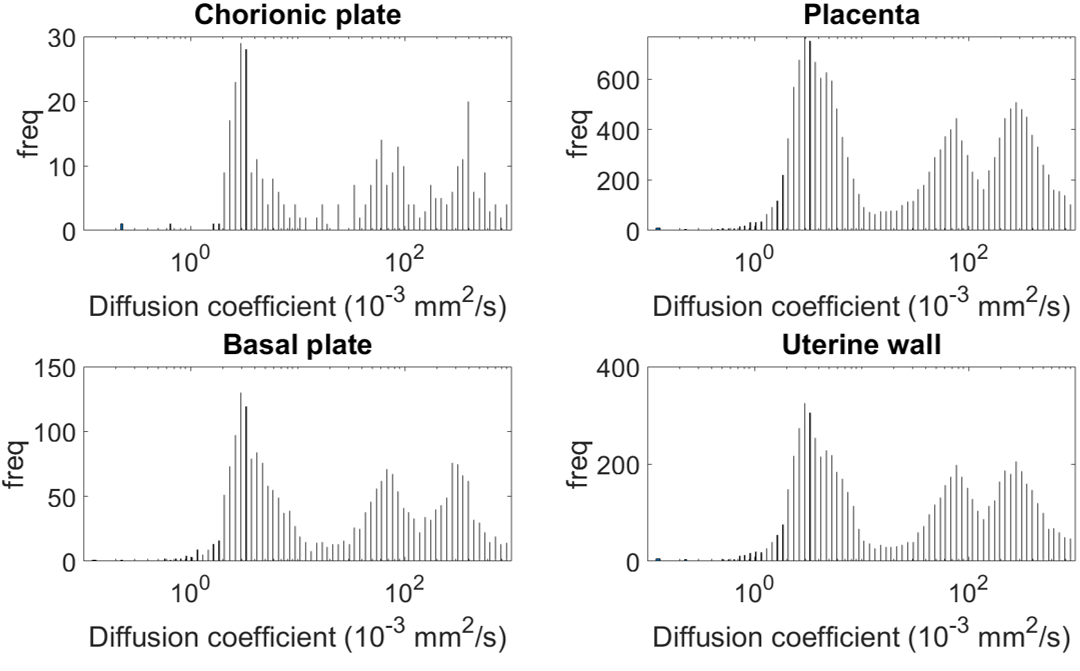
Figure 4 Histogram of peak positions from ILT fit over all ROI's from a single participant.
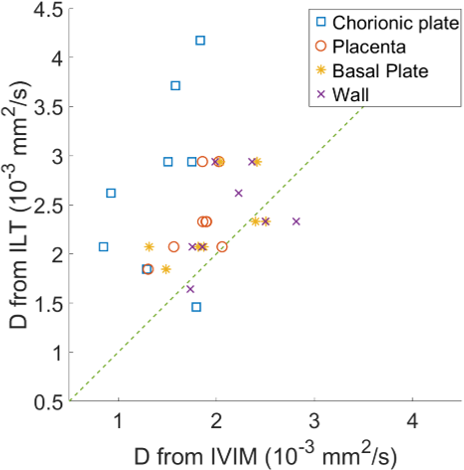
Figure 5 Comparison of estimated diffusion coefficient from the ILT peak histogram against diffusion coefficient from biexponential fit.