3676
Diffusion MRI based on a gamma distribution model for the differentiation of primary central nervous system lymphomas and glioblastomas1Molecular Imaging & Diagnosis, Kyushu University, Fukuoka, Japan, 2Clinical Radiology, Kyushu University, Fukuoka, Japan, 3Oral and Maxillofacial Radiology, Kyushu University, Fukuoka, Japan, 4Clinical Radiology, Teikyo University, Omuta, Japan
Synopsis
The aim of the present study was to determine whether the gamma distribution (GD) model is useful in the differentiation of glioblastomas (GBs) and primary CNS lymphomas (PCNSLs). The GD model well described the histological features of PCNSLs and GBs, and its use enabled the significant differentiation of these tumors. The κ, f2, and f3 values were significantly smaller and the f1 values were significantly larger in the PCNSLs than in the GBs. The GD model-derived parameters correlated well with the IVIM-derived parameters. The GD model may therefore contribute to the characterization of brain tumor from the histological viewpoint.
INTRODUCTION
The preoperative imaging-based differentiation of primary central nervous system lymphomas (PCNSLs) and glioblastomas (GBs) is of high importance since the therapeutic strategies differ substantially between these tumors. Many mathematical models have been proposed for the analysis of diffusion MRI. It has been reported that the mono-exponential model, bi-exponential IVIM model, and diffusion kurtosis model were useful in differentiating GBs and PCNSLs, but all have possible limitations. As one of the non-Gaussian distribution models, a statistical model based on the gamma distribution (GD) has been proposed1. The GD model is a two-parameter family of continuous probability distribution parametrized in terms of the shape parameters kappa (κ) and the scale parameter theta (θ), and this model assumes that the diffusion coefficient (D) is distributed continuously within a voxel. The GD model is suitable for realistically interpreting diffusion data in a histological context2-5. To the best of our knowledge, its application to brain tumors has never been reported. We conducted the present study to determine whether the GD model is useful in the differentiation of PCNSLs and GBs.METHODS
[Patients] Twenty-seven patients with PCNSLs and 57 patients with GBs.[MRI] Multi-b-value DWI was performed on a 3T scanner (Achieva 3.0TX or Ingenia 3.0T, Philips Healthcare, Best, The Netherlands). The DWI was performed by using a single-shot EPI sequence, with 13 b-values (0, 10, 20, 30, 50, 80, 100, 200, 300, 400, 600, 800, 1000 sec/mm2). The other imaging parameters were: repetition time, 2,500 msec; echo time, 70 msec; matrix, 128×126; slice thickness, 5 mm, field of view, 230×230 mm; number of slices, 11; SENSE factor, 1.5; scan time, 2 min 7 sec.
[Image Analysis] The DWI data were transferred to a personal computer and fit to the GD model, and then the κ and θ values were estimated using the Image J software program and self-built plug-ins. Three different areas under the probability density function (PDF) curve were defined as follows: f1, the fraction of D <1.0×10⁻³ mm2/sec; f2, the fraction of 1.0×10⁻³ to 3.0×10⁻³ mm2/sec; f3, the fraction of D >3.0×10⁻³ mm2/sec1. The f1 value is attributed to the intracellular component; the f2 is attributed to the extracellular extravascular component, and the f3 is attributed to the intravascular component. On the size-adjusted postcontrast T1-weighted images, areas showing contrast enhancement were manually segmented. The GD model-derived parameters were compared between PCNSLs and GBs with the Mann-Whitney U-test. ROC analyses were performed to assess diagnostic performance. The correlations with IVIM-derived parameters were evaluated.
RESULTS
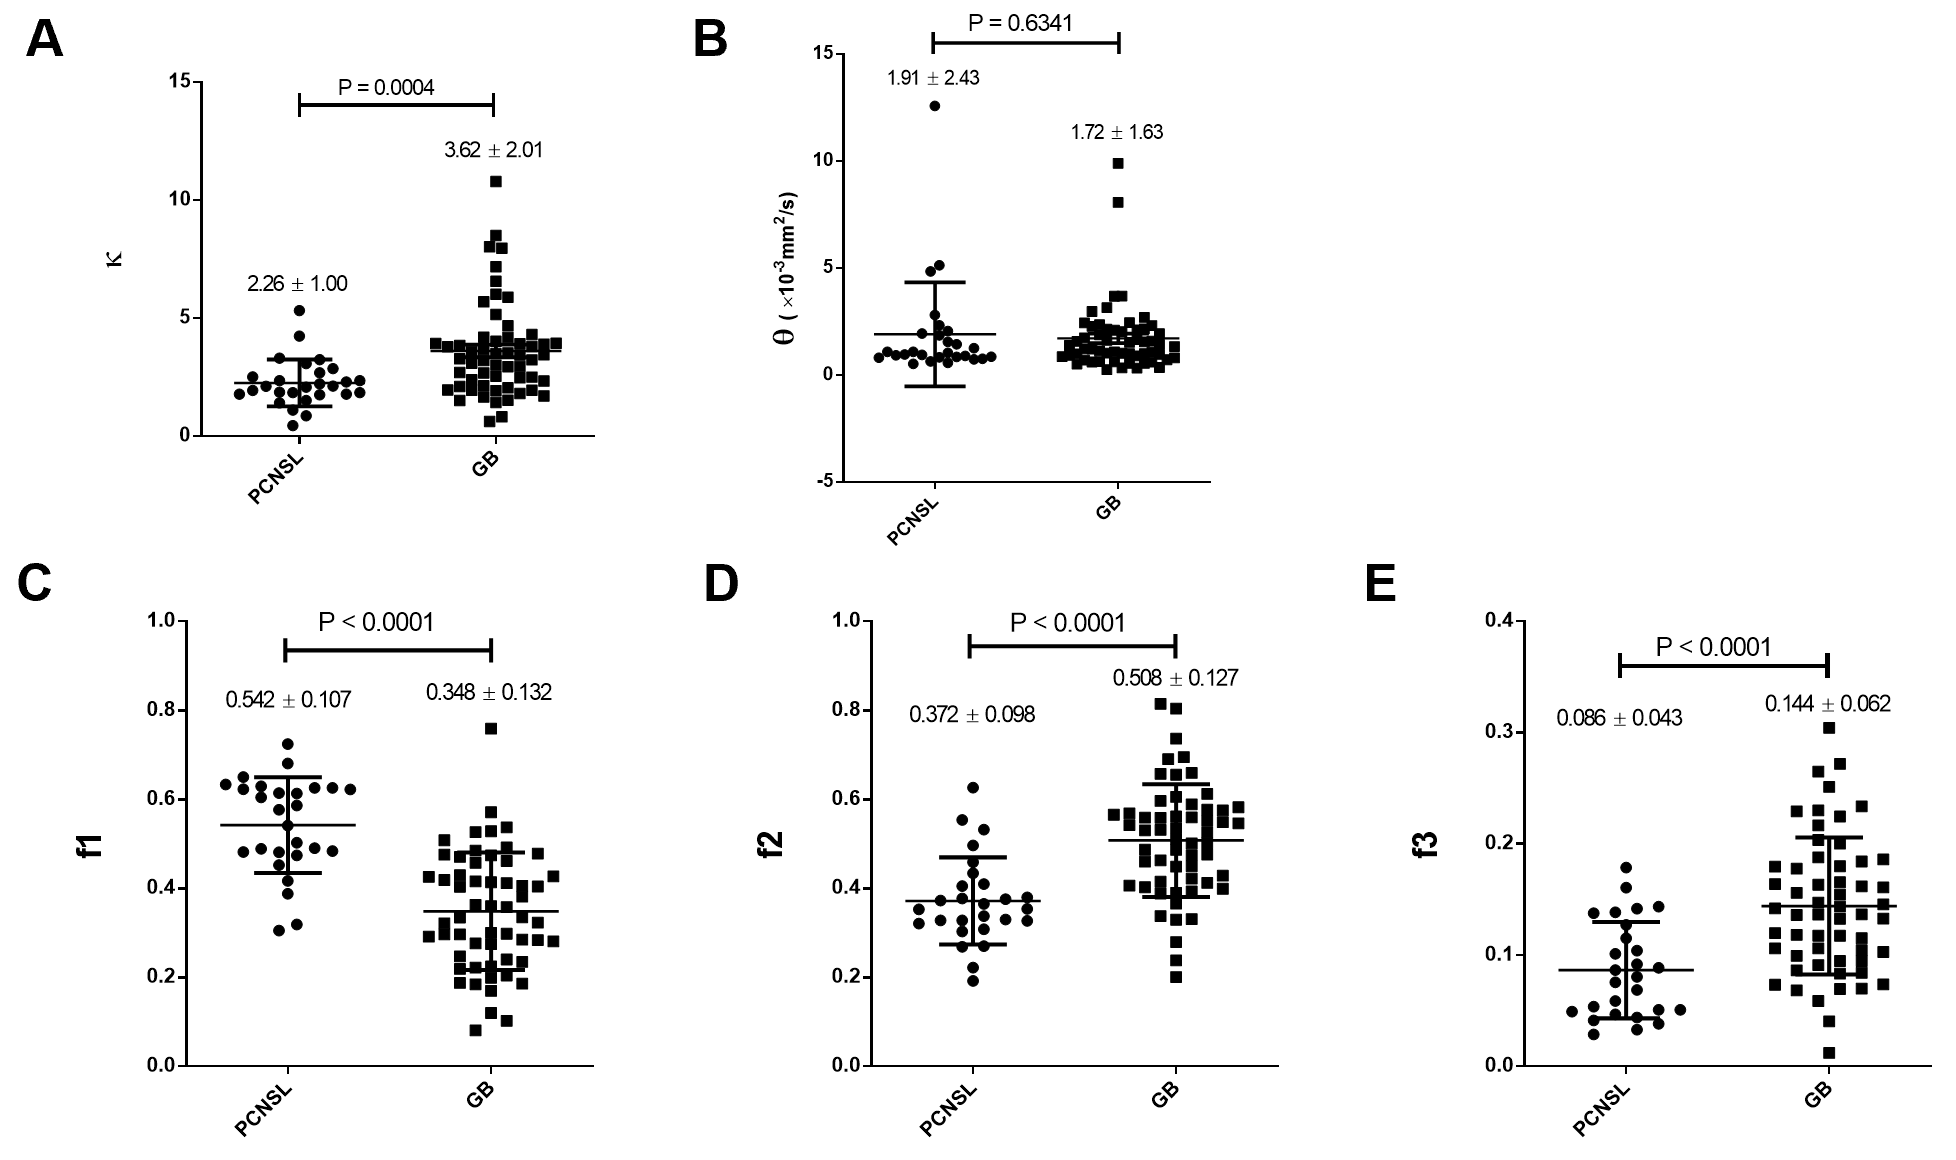
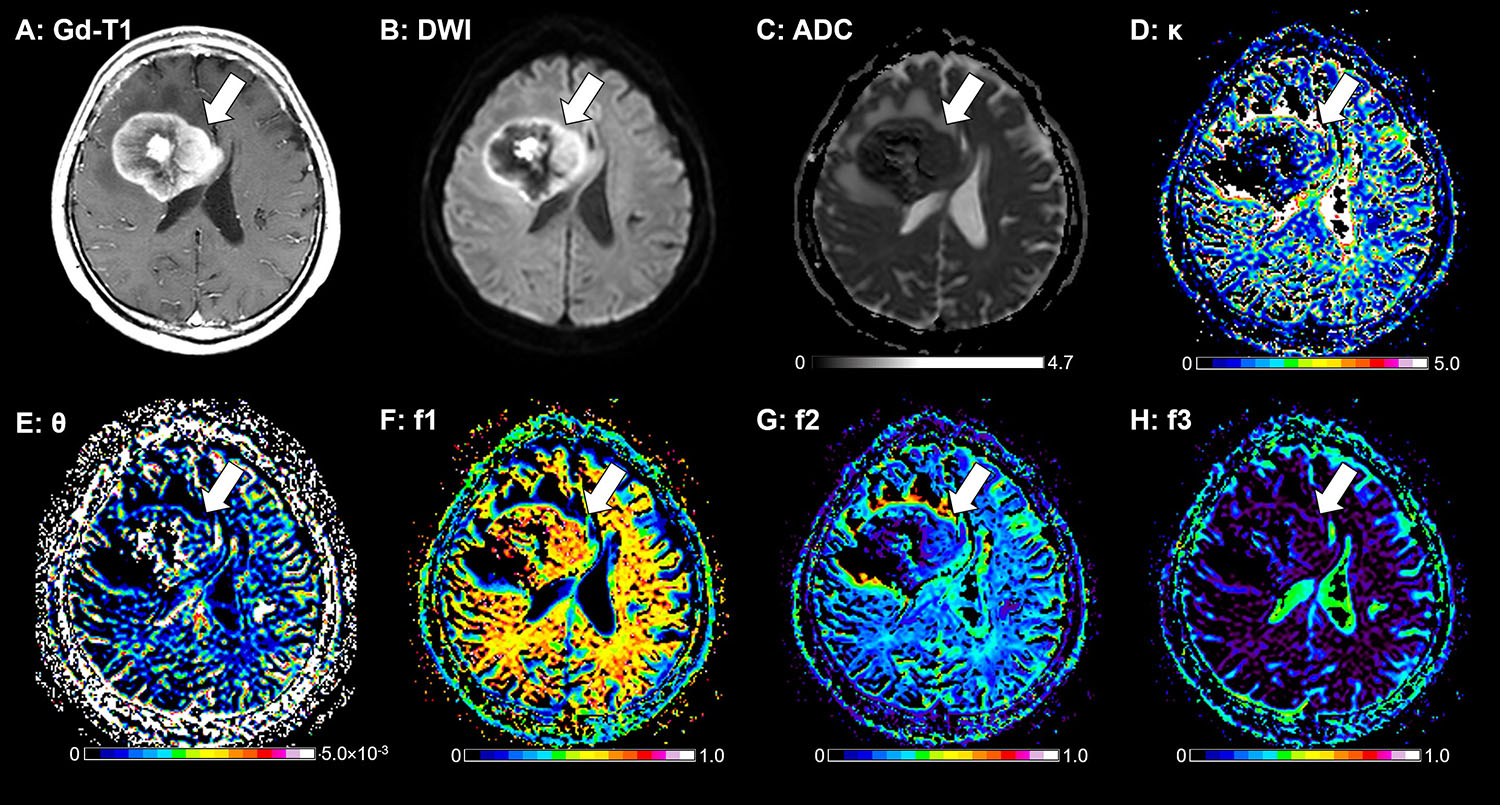
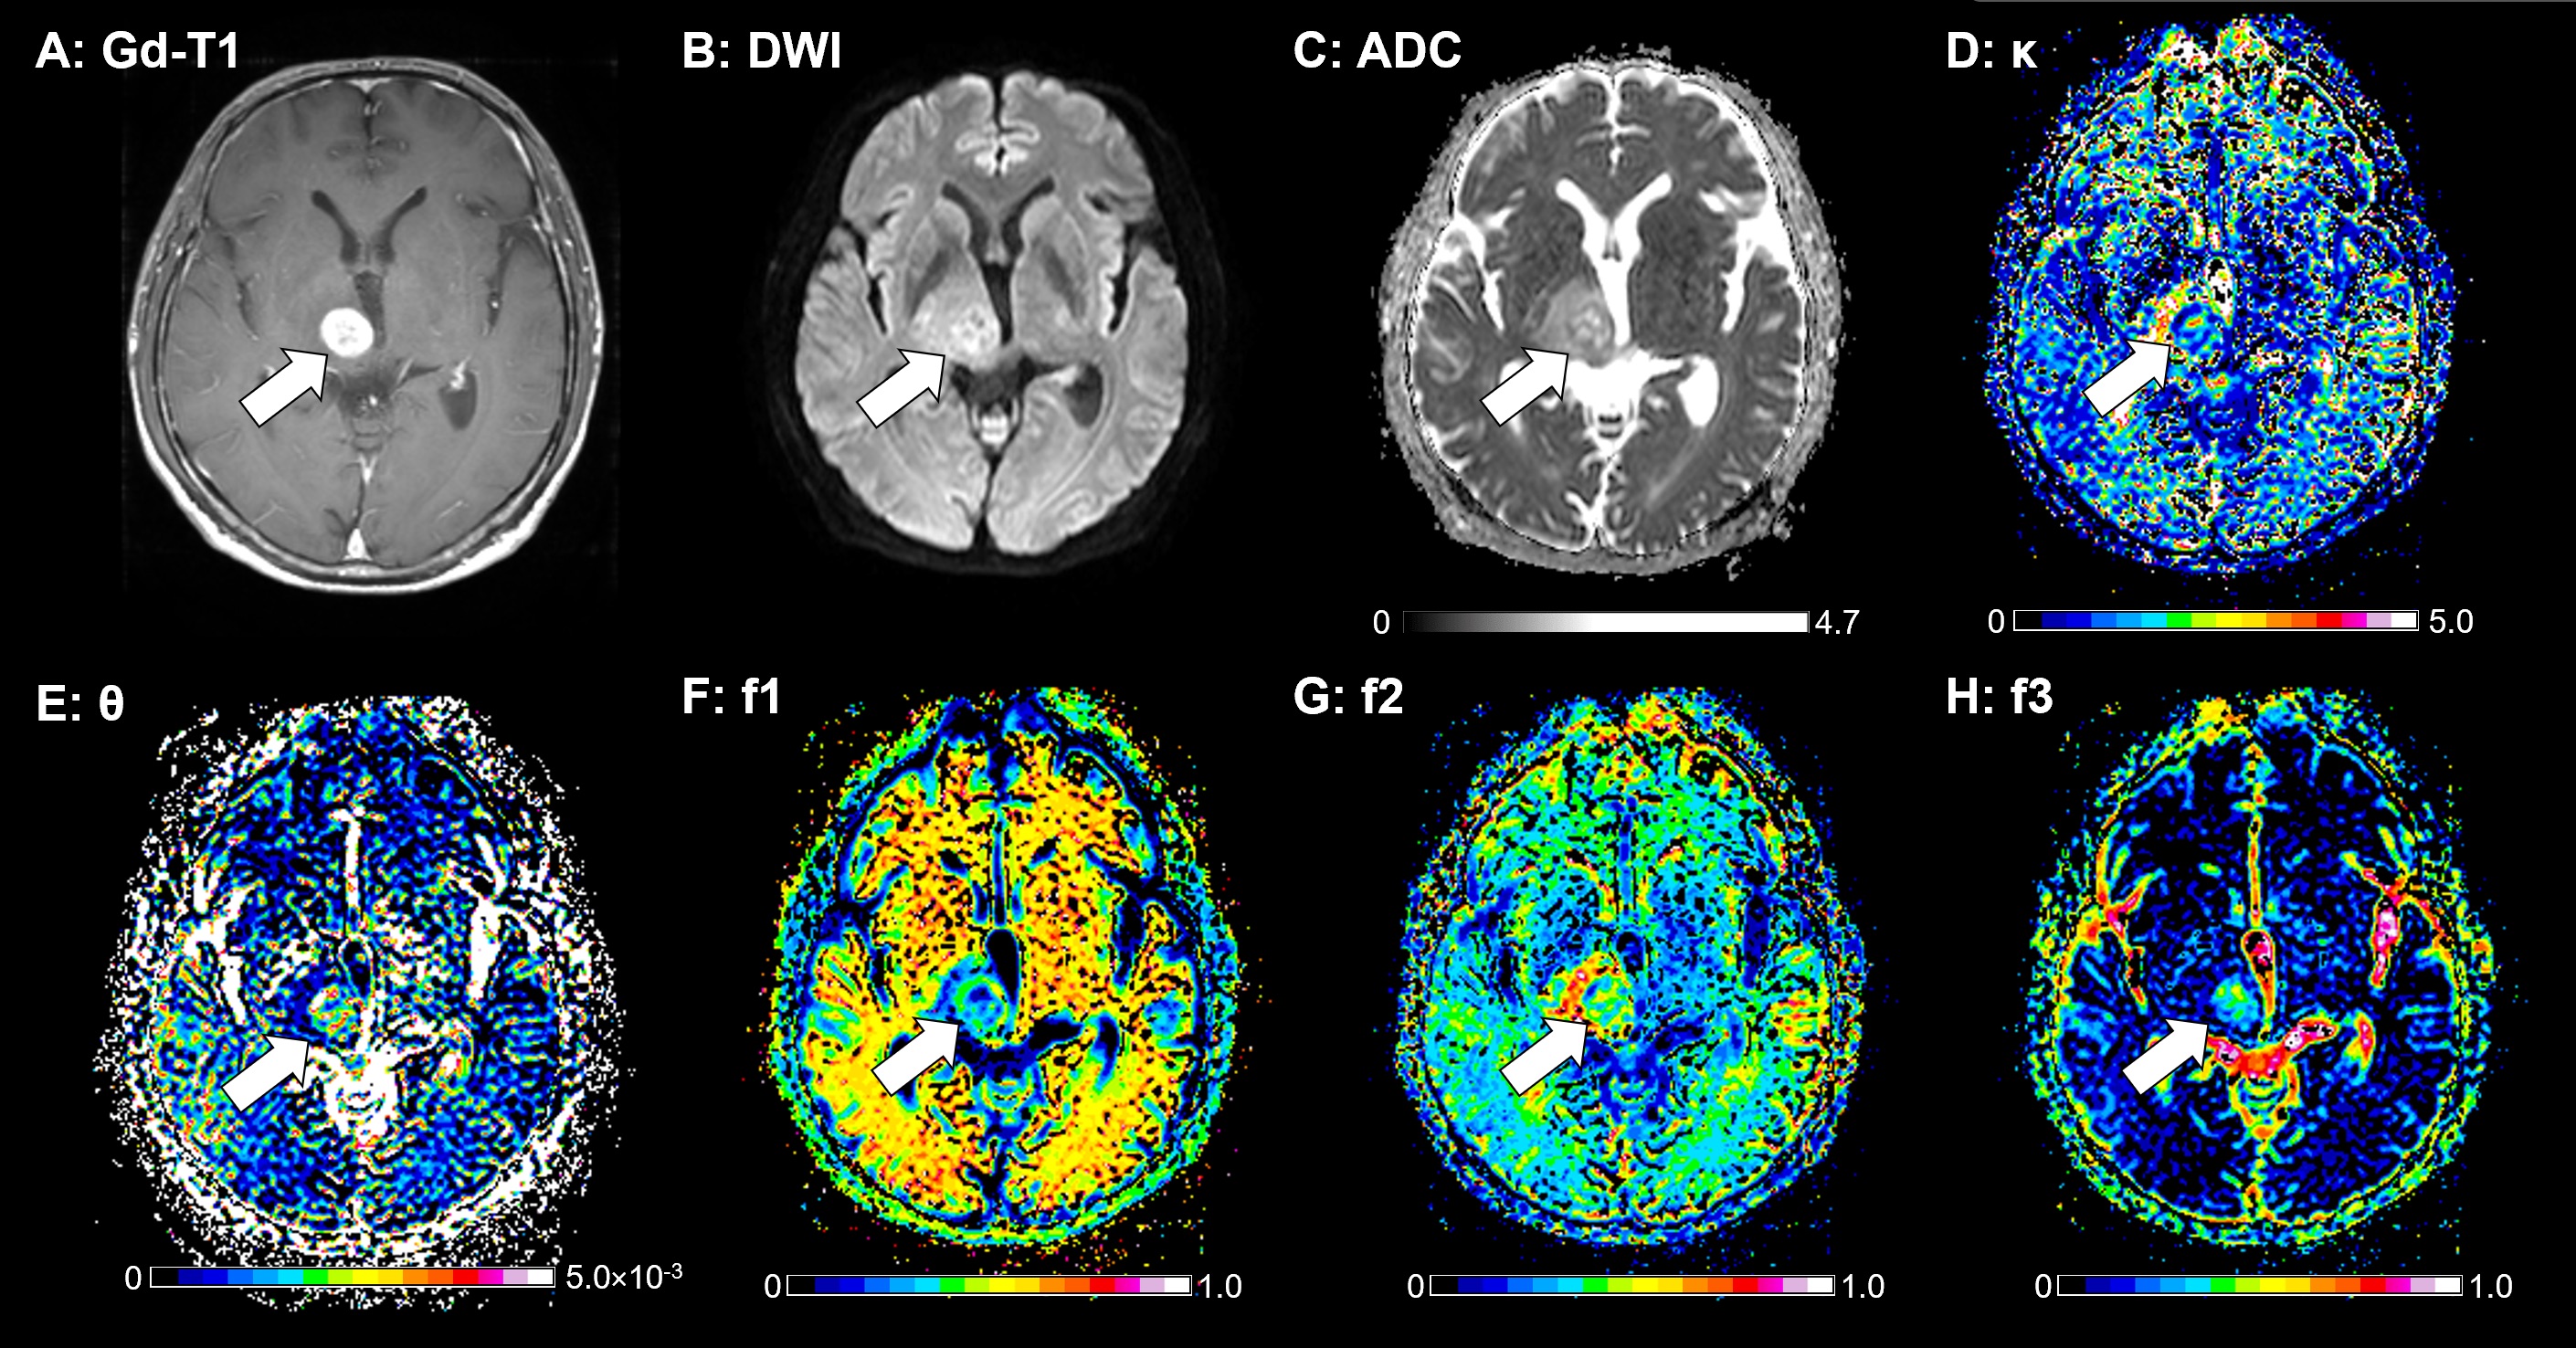
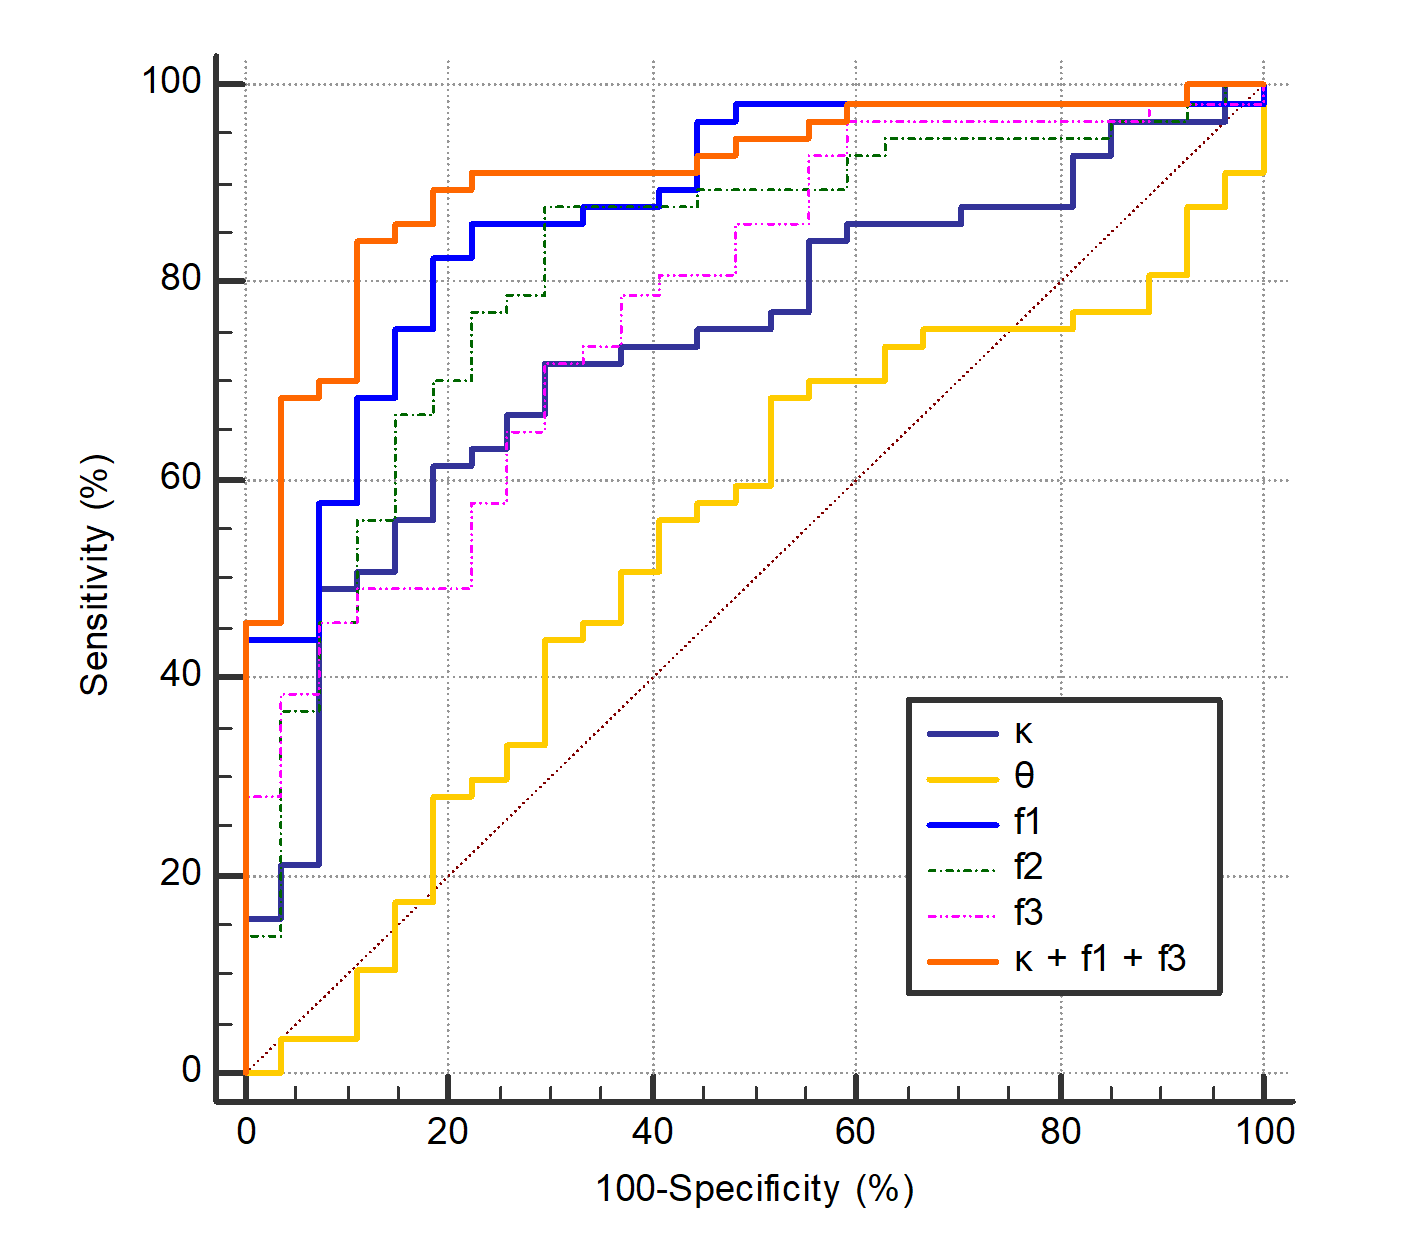
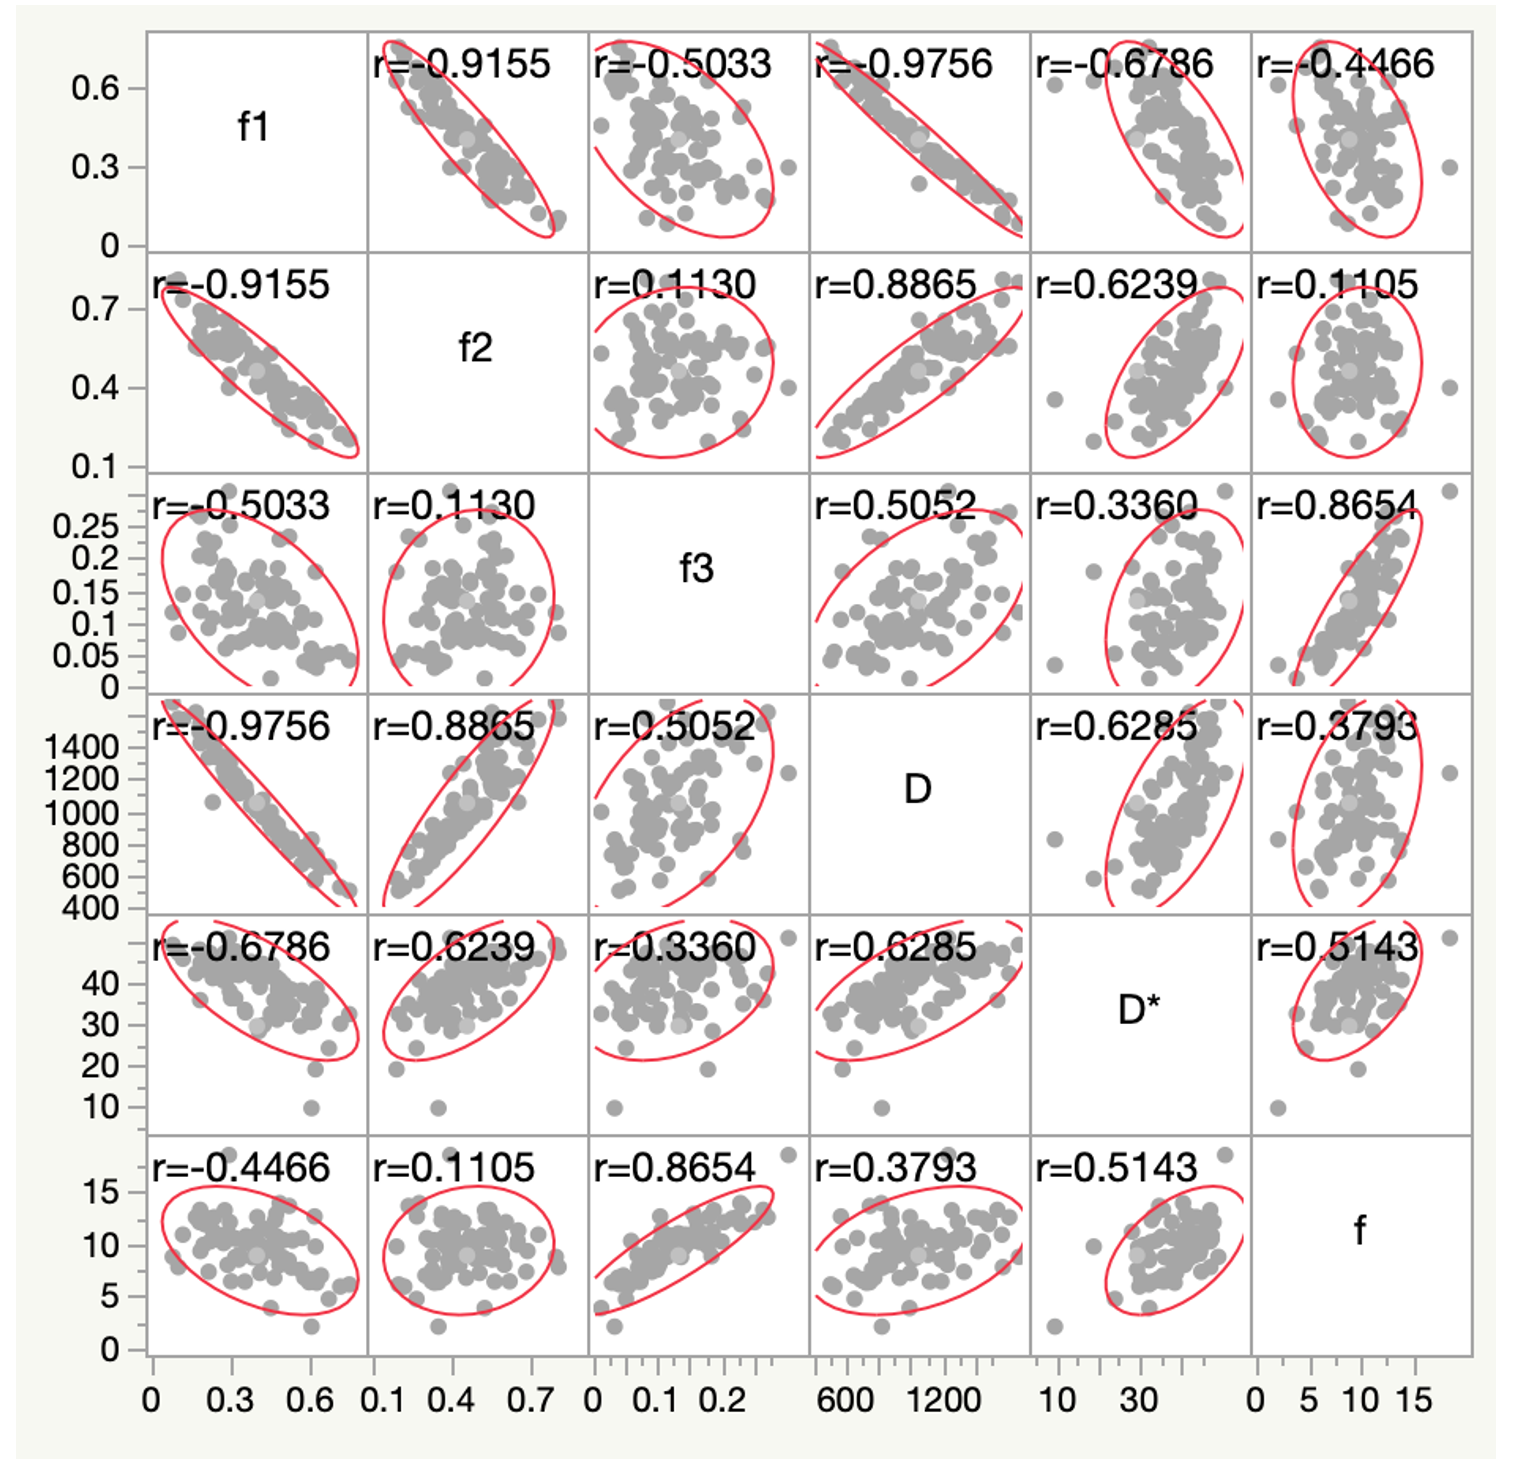
Figure 1 illustrates the results of our comparisons of the GD model-derived parameters between the PCNSLs and GBs. The PCNSL group's κ (2.26 ± 1.00) was significantly smaller than the GB group's (3.62 ± 2.01, p=0.0004). The PCNSL group's f1 (0.542 ± 0.107) was significantly larger than the GB group's (0.348 ± 0.132, p<0.0001). The PCNSL group's f2 (0.372 ± 0.098) was significantly smaller than the GB group's (0.508 ± 0.127, p<0.0001). The PCNSL group's f3 (0.086 ± 0.043) was significantly smaller than the GB group's (0.144 ± 0.062, p<0.0001). Figure 2 provides a PCNSL case that showed a ring-like enhancing mass lesion mimicking a GB. This lesion showed a low κ, a high f1, a low f2, and a low f3, suggesting PCNSL. Figure 3 demonstrates a GB case that showed a solid enhancing mass lesion. This lesion showed a high κ, a low f1, and high f2 and f3, which are consistent with GB. The ROC graphs are shown in Figure 4. The ADC, f1, D, and f2 all showed good performances. The ADC showed the highest AUC value at 0.879, and the f1 and D values showed comparable AUCs (f1, 0.877; D, 0.875). The combination of κ, f1, and f3 showed excellent diagnostic performance (area under the curve, 0.909). Figure 5 shows the correlations among the GD model-derived and IVIM model-derived parameters in all tumors. The f1 had an almost perfect inverse correlation with D (r = −0.976, p<0.0001). The f2 had a very strong positive correlation with D (r=0.8865, p<0.0001). The f3 had a very strong positive correlation with the f (r=0.8654, p<0.0001).DISCUSSION
The low κ values observed in the PCNSLs indicated that the PDF curve had a right-skewed distribution, which meant that the PDF has its peak in the lower D area. Since the θ values were not significantly different between the PCNSL and GB groups, it was likely that the lower κ values might result in the lower ADC and D values and the higher f1 values observed in the PCNSLs compared to the GBs. These findings are in accordance with studies that examined the mono-exponential model, in which PCNSLs showed lower ADC values relative to GBs6-8. It seems that the higher f1 and lower f2 in the PCNSLs and the lower f1 and higher f2 in the GBs well reflected the histological features of the respective tumors. Histologically, PCNSLs are characterized by high cell density. In GBs, the overall cell density can be lowered depending on the fraction of microscopic necrosis.CONCLUSION
The GD model well described the histological features of PCNSLs and GBs, and its use enabled the significant differentiation of these tumors.Acknowledgements
No acknowledgement found.References
1. Oshio K, Shinmoto H, Mulkern RV (2014) Interpretation of diffusion MR imaging data using a gamma distribution model. Magn Reson Med Sci 13:191-195.
2. Shinmoto H, Oshio K, Tamura C et al. (2015) Diffusion-weighted imaging of prostate cancer using a statistical model based on the gamma distribution. J Magn Reson Imaging 42:56-62
3. Tomita H, Soga S, Suyama Y, Ito K, Asano T, Shinmoto H (2019) Analysis of diffusion-weighted MR images based on a gamma distribution model to differentiate prostate cancers with different Gleason score. Magn Reson Med Sci. doi: 10.2463/mrms.mp.2018-0124
4. Borlinhas F, Loucao R, R CC, Ferreira HA (2019) Gamma distribution model in the evaluation of breast cancer through diffusion-weighted MRI: A preliminary study. J Magn Reson Imaging 50:230-238
5. Yamada K, Shinmoto H, Oshio K, Ito S, Kumagai H, Kaji T (2016) Diffusion-weighted MR imaging for the assessment of renal function: Analysis using statistical models based on truncated Gaussian and gamma distributions. Magn Reson Med Sci 15:237-245
6. Guo AC, Cummings TJ, Dash RC, Provenzale JM (2002) Lymphomas and high-grade astrocytomas: Comparison of water diffusibility and histologic characteristics. Radiology 224:177-183
7. Doskaliyev A, Yamasaki F, Ohtaki M et al. (2012) Lymphomas and glioblastomas: Differences in the apparent diffusion coefficient evaluated with high b-value diffusion-weighted magnetic resonance imaging at 3T. Eur J Radiol 81:339-344
8. Lu X, Xu W, Wei Y et al. (2019) Diagnostic performance of DWI for differentiating primary central nervous system lymphoma from glioblastoma: A systematic review and meta-analysis. Neurol Sci 40:947-956
Figures