3675
Beyond cellularity: Which microstructural features determine the mesoscopic mean diffusivity in meningiomas?1Medical Radiation Physics, Lund University, Lund, Sweden, 2Diagnostic Radiology, Lund University, Lund, Sweden, 3Institute of Histology and Embryology, First Faculty of Medicine, Charles University, Prague, Czech Republic, 4Division of Oncology and Pathology, Department of Clinical Sciences, Lund University, Lund, Sweden, 5Division of Neurosurgery, Department of Clinical Sciences, Lund University, Lund, Sweden, 6Russell H. Morgan Department of Radiology and Radiological Science, Johns Hopkins University School of Medicine, Baltimore, MD, United States, 7Harvard Medical School, Boston, MA, United States, 8Radiology, Brigham and Women’s Hospital, Boston, MA, United States, 9Lund University Bioimaging Center, Lund University, Lund, Sweden
Synopsis
Mean diffusivity (MD) in tumors is often too readily interpreted as cellularity. Here, we investigated which microstructural features explain the MD in meningioma tumors. We performed high-resolution MRI and histological imaging on excised mengioma tumor samples and coregistered MD to histology. We found that cellularity alone was a poor predictor of MD, and that the prediction improved markedly by considering also the microcyst density. A qualitative analysis also indicated that collagen fibers, stroma and psammoma bodies affect the MD.
Introduction
Diffusion MRI maps the apparent diffusivity, which is affected by tissue cell density. A negative correlation between the mean diffusivity (MD) and the cellularity has been found when considering values averaged across whole tumors1 as well as on a voxel-to-voxel basis2, although, in some cases, they do not correlate3. The problem is that this relation is often in practice taken for granted but the research is incomplete and prevents accurate interpretation. Here, we aim to establish which are the microstructural features that will best predict MD on a mesoscopic (200 µm) scale and compare that to cellularity.Methods
In total, 16 tumors were obtained after neurosurgical excision. Here, we selected three for detailed investigation. The tissue was embedded in paraffin and sliced into blocks of approximately 35x20x2 mm3 to fit a 3D printed mold and scanned at a Bruker 9.4 T BioSpec Avance III scanner. Diffusion tensor imaging (DTI)4 was performed with TR=2.5 s, TE=30 ms, slices=41, averages=10, resolution=200×200×200 μm3, and with b-values 100, 1000 and 3000 s/mm2 in each 6 directions. DTI analysis was performed with linear least squares fitting, as implemented in the multidimensional dMRI toolbox5. After scanning, the specimen were sliced into 4–5 µm thick slices, stained with a Hematoxylin & Eosin (H&E) and scanned with a light microscope at resolution 0.5 μm.Cell nuclei were segmented from H&E images by QuPath6. An in-house algorithm was used to segment microcysts from H&E images. These maps were downsampled to MRI resolution to obtain cellularity (cell nuclei count density) and microcyst density maps. They were smoothed using a Gaussian kernel with a width of 1 mm to reduce the impact of coregistration errors. A prediction of MD based on cellularity was achieved by a second-degree polynomial in the microcystic/angiomatous type and by first-degree function in the fibroblastic types. Measured and predicted MD maps were compared. Regions where cellularity alone could not explain the MD were submitted to closer investigation. Explained variance (R2) was computed for the cell-density only model as well as when also including microcyst density as an extra linear term to the second-degree polynomial.
Results
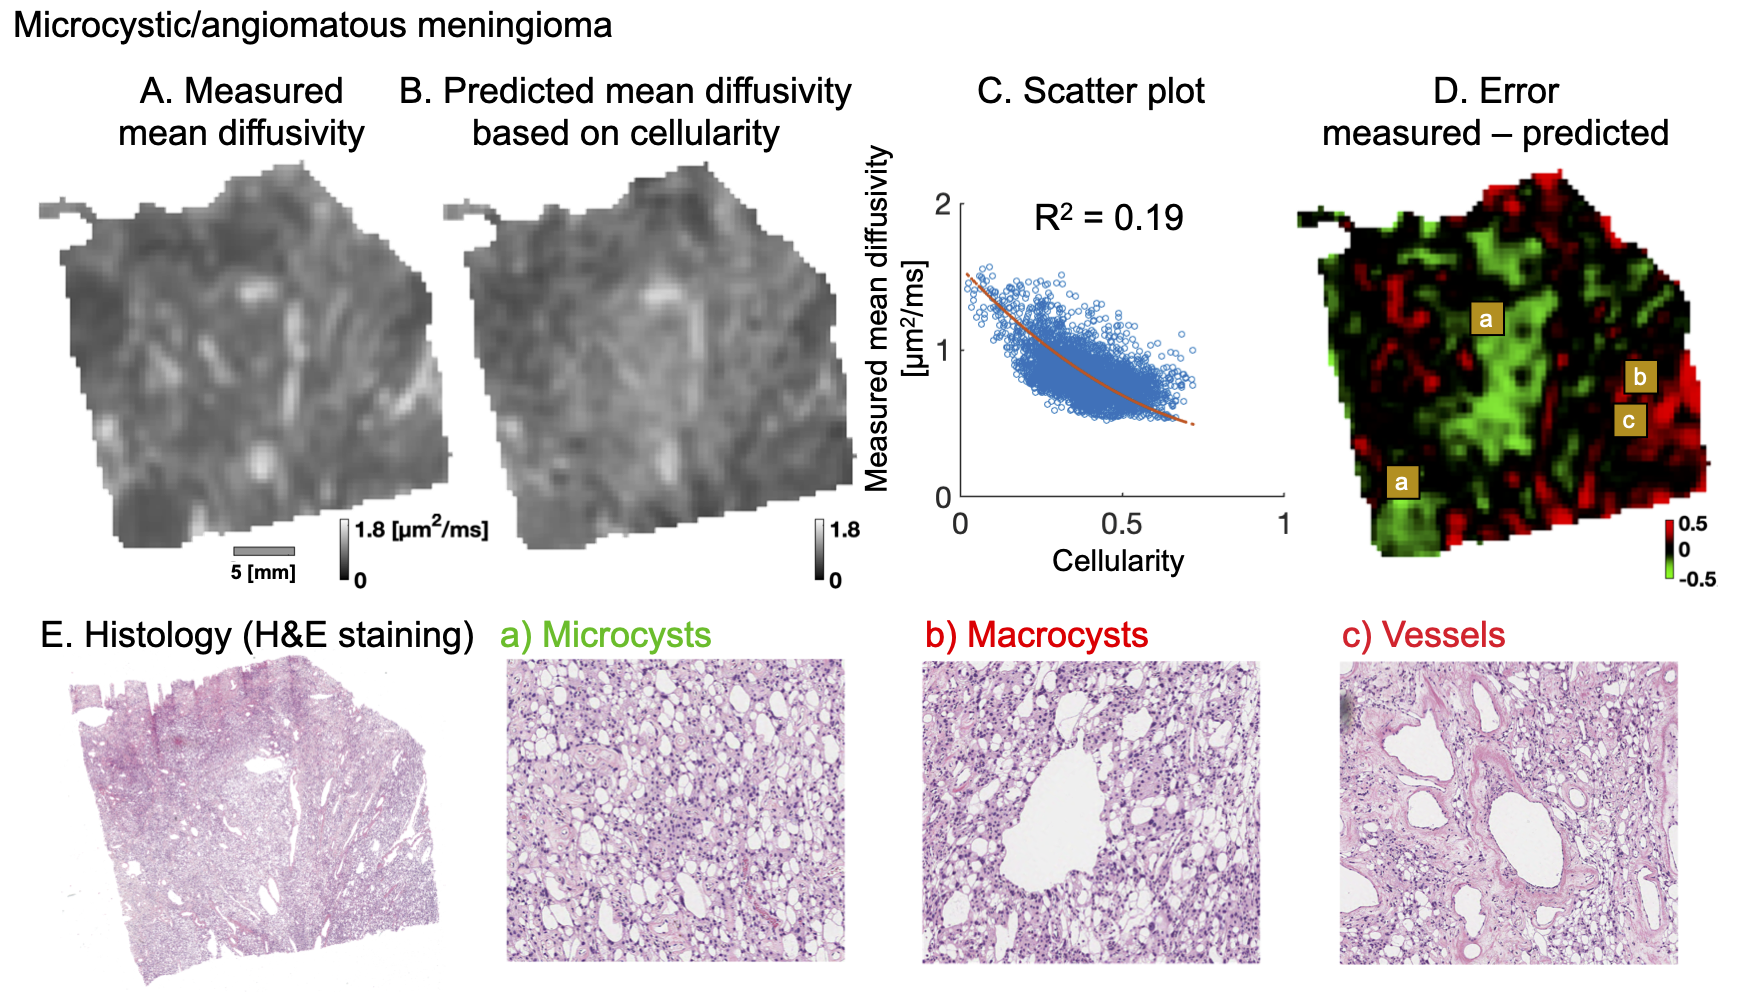
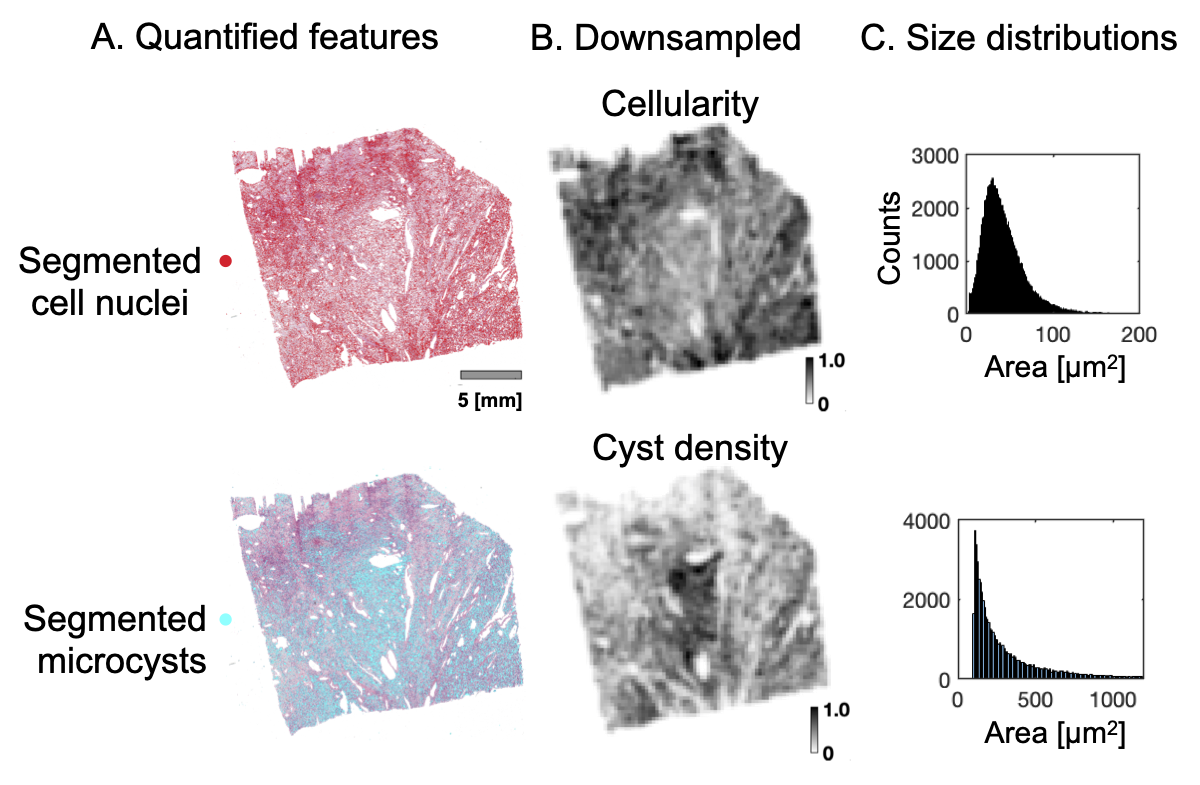
Figure 1 shows results from a microcystic/angiomatous meningioma. The upper row shows measured (A), predicted (B) MD and a correlation of MD with cellularity (C), but with poor capacity to explain the MD variations (R2 of 0.19). Furthermore, error map (D) shows nearly half (46 %) the tumor sample area showed error excess above 10 % (± 0.15 μm2/ms) where negative errors (green areas) require restrictive and positive (red) free water compartments to improve the MD prediction.Figure 2 shows how MD was predicted. Cell nuclei and microcysts were segmented from histology image (A) and then cellularity and cyst density map obtained by down-sampling them to MR resolution (B). They are differently distributed because high cyst density is seen from the left bottom to the right upper part whereas cellularity is high on the lower and upper corresponding diagonals. Their mean cell nuclei area was 40 μm2 while the mean cyst area was 480 μm2 (C).
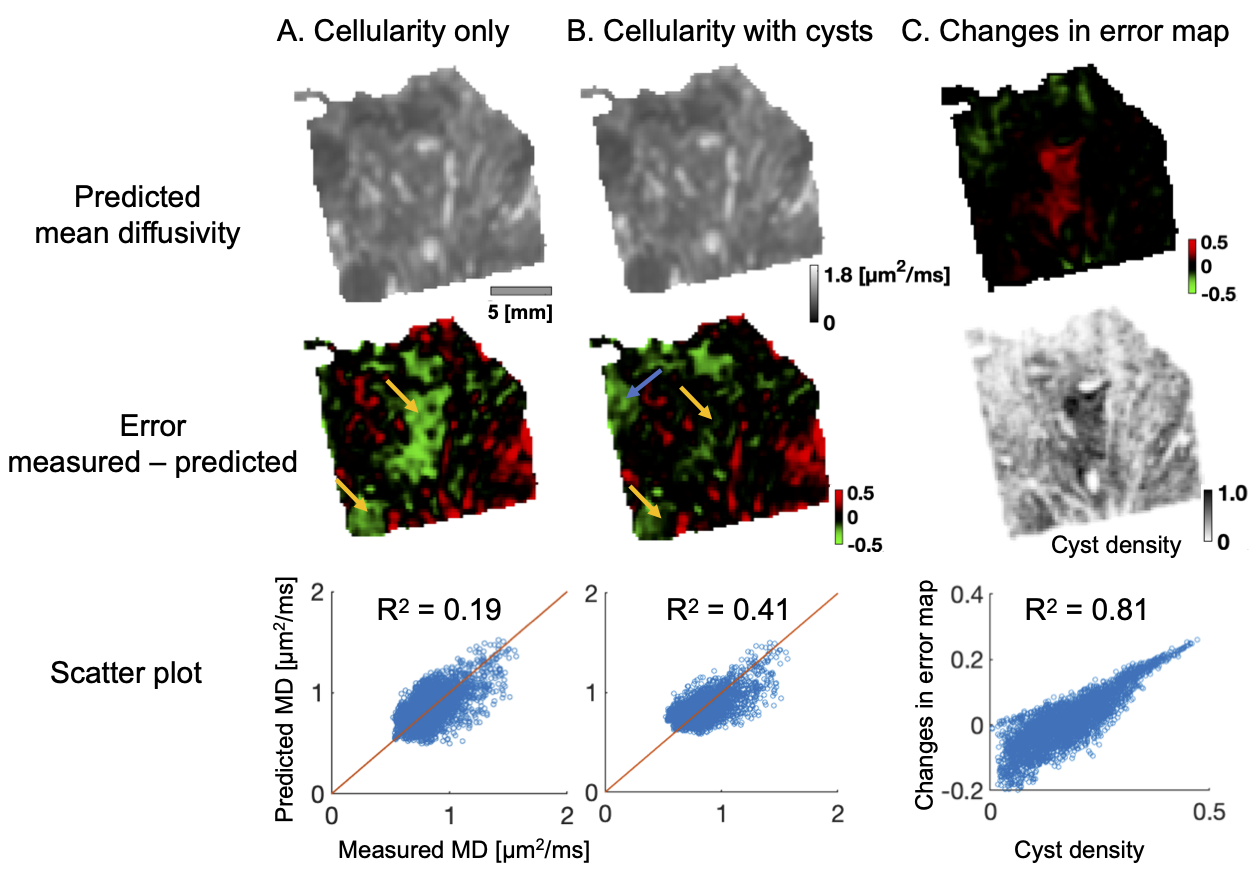
Figure 3 shows the differences when microcysts were omitted (A) and included (B) in the prediction of mean diffusivity. The error map corresponding to MD prediction based on cellularity shows a large negative error (green area) on the principal diagonal (yellow arrows). This error disappears when microcyst density is included in the prediction. Moreover, R2 increases from 0.19 to 0.41 and error excess above 10 % decreases from one half to one quarter (46 % to 26 %).
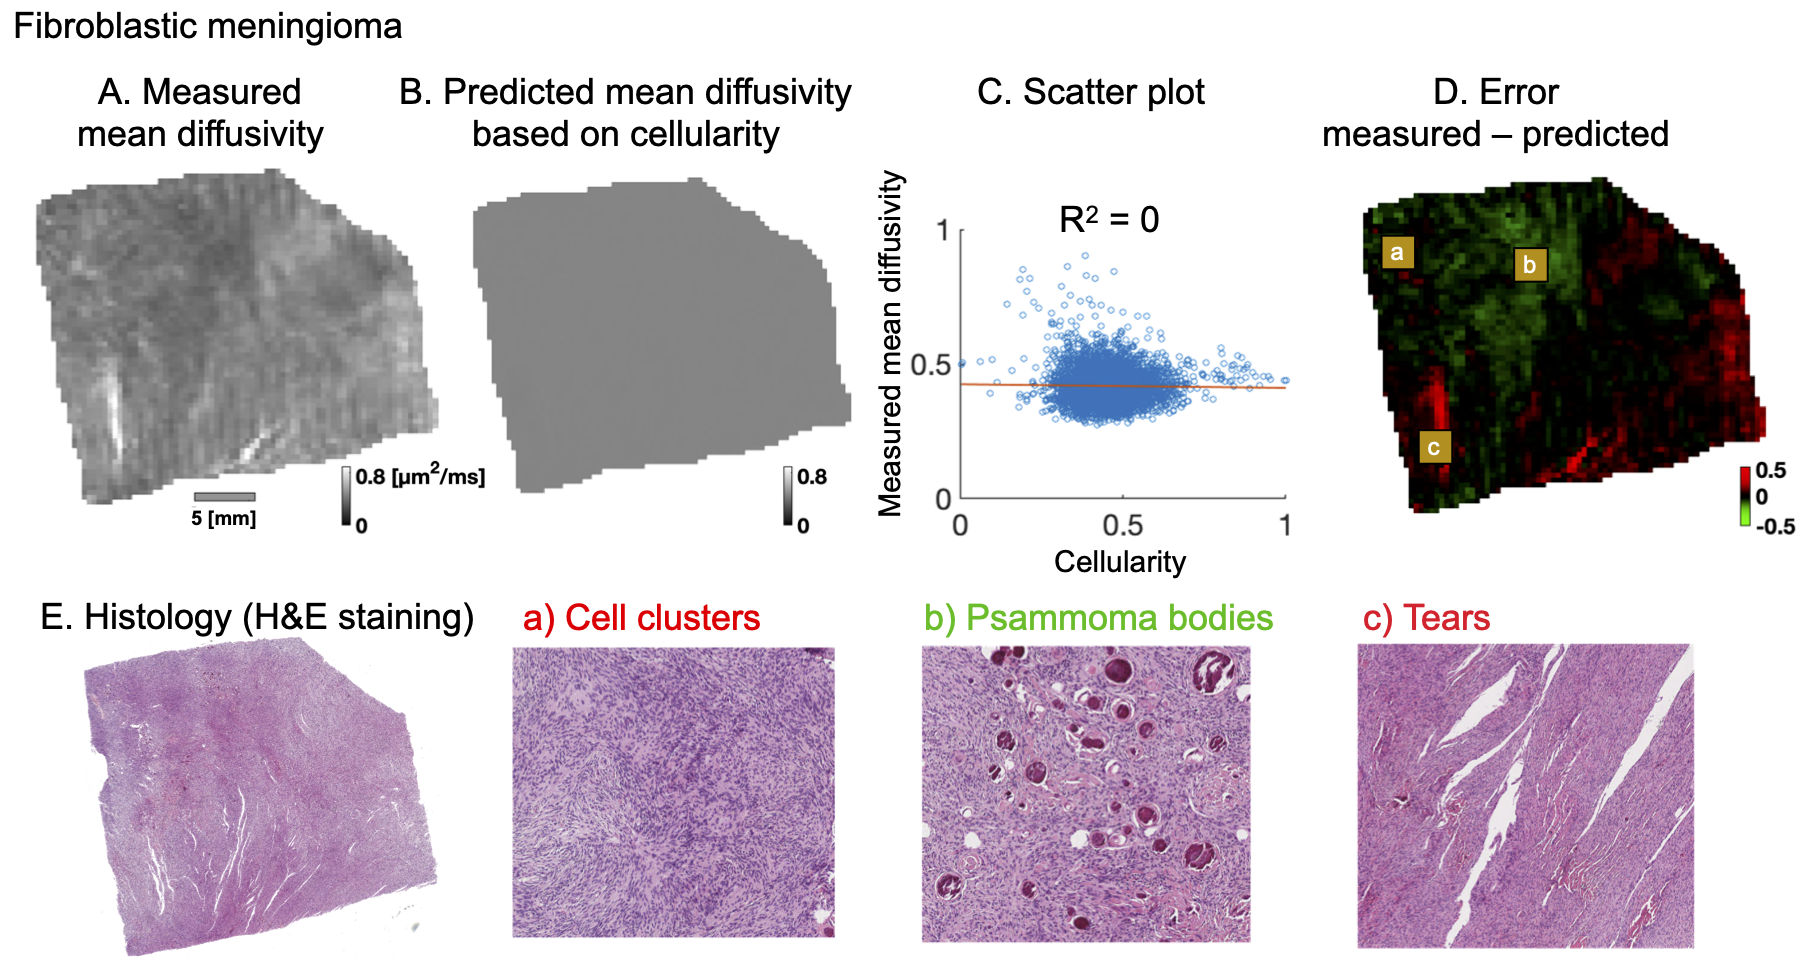
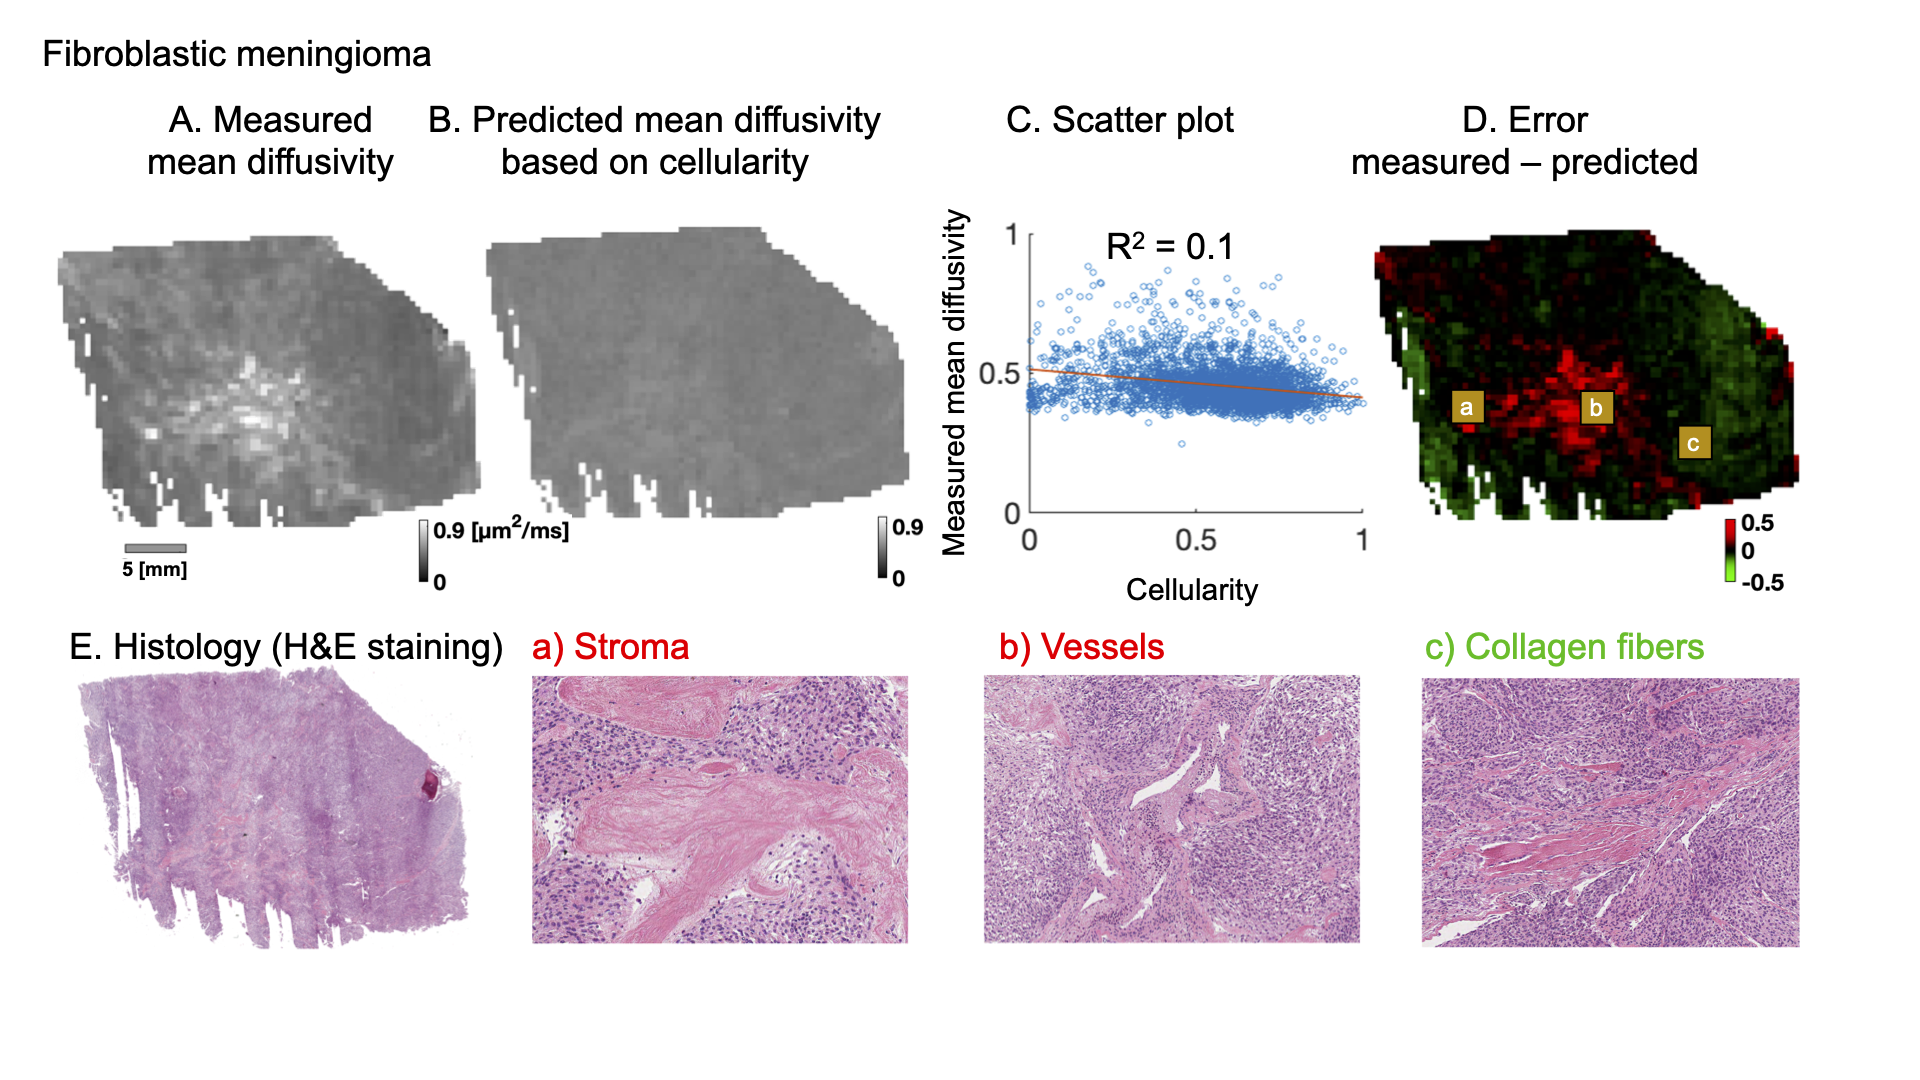
Figure 4 and 5 shows analysis of two different fibroblastic meningiomas types in a similar manner. A qualitative analysis shows that the negative error (green area) is associated with psammoma bodies and collagen fibers while positive error (red area) is associated with stroma, vessels or psammoma bodies.
Discussion
We have found evidence that microcysts play a significant role in determining mean diffusivity in a microcysts/angiomatous meningioma (Figure 3). In fibroblastic types, we found similar associations to collagen fibers, stroma or psammoma bodies (Figure 4 and 5). Importantly, cellularity contributed poorly to the explanation of mean diffusivity variability at mesoscopic scale (Figure 3, 4 and 5).The findings in the microcystic/angiomatous types are relevant because they are considered benign but they resemble aggressive tumors on routine MRI and thus pose a diagnostic challenge7. Time-dependent diffusion could be used to distinguish this type. That is because microcysts, i.e. small round/oval cystic spaces that are circumscribed by endothelial layer, have size distribution different from cell nuclei (Figure 2C).
A limitation of the present work is that MD prediction errors may depend on the supposed incompleteness of cellularity as a predictor as well as inaccurate MRI-to-histology coregistration. Furthermore, the current analysis was limited to a small set of tumors, that may not generalize to a larger population. Future work will focus on the quantification of other microstructural features apart from microcysts to show their quantitative value.
Conclusion
Microcysts contributed to the prediction of intra-tumor mean diffusivity on mesoscopic scale in meningioma tumors but, on the contrary, cellularity only poorly. In addition, psammoma bodies, collagen fibers or stroma can also contributed to the explanation of mean diffusivity variability.Acknowledgements
Michael Gottschalk, René In 'T Zandt and Lund University Bioimaging Center (LBIC), Lund University are gratefully acknowledged for providing experimental resources.References
1. Chen, L., et al., The correlation between apparent diffusion coefficient and tumor cellularity in patients: a meta-analysis. PloS one, 2013. 8(11): p. e79008.
2. LaViolette, P.S., et al., Precise ex vivo histological validation of heightened cellularity and diffusion-restricted necrosis in regions of dark apparent diffusion coefficient in 7 cases of high-grade glioma. Neuro-oncology, 2014. 16(12): p. 1599-1606.
3. Yoshikawa, M.I., et al., Relation between cancer cellularity and apparent diffusion coefficient values using diffusion-weighted magnetic resonance imaging in breast cancer. Radiation medicine, 2008. 26(4): p. 222-226.
4. Basser, P.J., J. Mattiello, and D. LeBihan, MR diffusion tensor spectroscopy and imaging. Biophysical journal, 1994. 66(1): p. 259-267.
5. Nilsson, M., et al. An open-source framework for analysis of multidimensional diffusion MRI data implemented in MATLAB. in Proc Intl Soc Mag Reson Med. 2018.
6. Bankhead, P., et al., QuPath: Open source software for digital pathology image analysis. Scientific reports, 2017. 7(1): p. 1-7.
7. Hasselblatt, M., K.W. Nolte, and W. Paulus, Angiomatous meningioma: a clinicopathologic study of 38 cases. The American journal of surgical pathology, 2004. 28(3): p. 390-393.
Figures