3672
Grading of glioma with histogram analysis of multiparameter using advanced diffusion models
Gao Eryuan1, Gao Ankang1, Zhang Huiting2, Wang Shaoyu2, Yan Xu2, Bai Jie1, and Cheng Jingliang1
1Dept. of MRI, The First Affiliated Hospital of Zhengzhou University, Zhengzhou, China, Zhengzhou, China, 2MR Scientific Marketing, Siemens Healthcare, Shanghai, China, Shanghai, China
1Dept. of MRI, The First Affiliated Hospital of Zhengzhou University, Zhengzhou, China, Zhengzhou, China, 2MR Scientific Marketing, Siemens Healthcare, Shanghai, China, Shanghai, China
Synopsis
This study aimed to investigate the efficiency of four advanced diffusion models, including diffusion tensor imaging (DTI), diffusion kurtosis imaging (DKI), neurite orientation dispersion and density imaging (NODDI) and mean apparent propagator (MAP) in grading of glioma. Through histogram analysis of parameters, we found that axial diffusivity (AD)maximum, mean diffusivity (MD)maximum and radial diffusivity (RD)maximum from DTI, and Q-space inverse variance (QIV)maximum and QIVrange from MAP had significant differences and good diagnostic efficiency in all comparisons among different grading of glioma.
Background and Purpose
Gliomas account for about 80% of primary malignant intra-axial tumors, and they are divided into four grades according to the World Health Organization (WHO). The treatment strategies and outcomes vary according to the grades, which determines the importance of preoperative glioma grading. Diffusion MR imaging (DWI) has been applied for brain tumor characterization for decades, especially for diffusion tensor imaging (DTI) and diffusion kurtosis imaging (DKI) [1,2]. Recently, the new methods, including neurite orientation dispersion and density imaging (NODDI) and mean apparent propagator (MAP), have been mainly used in microstructural changes of brain tissues [3,4], but they were rarely used in grading of glioma [5], especially for MAP method. This study aimed to investigate the efficiency of these four diffusion models combining with histogram analysis and to find the best parameter in grading of glioma.Materials & Methods
This prospective study was approved by the institutional review board, and informed consent was obtained from all patients. 98 patients were recruited, including 44 low-grade glioma (WHO Ⅱ, Ⅲ) and 54 high-grade glioma (WHO Ⅳ). All patients were scanned on a 3T MR scanner (MAGNETOM Prisma; Siemens Healthcare, Erlangen, Germany) with a 64 channel of head-neck coil. DWI was performed using a spin-echo echo-planar imaging sequence and the parameters were: FOV = 220 × 220 mm2, slice thickness = 2.0 mm, slices = 66, TR/TE = 3700/72 ms, in-plane acceleration factor = 2, slice acceleration factor = 2, diffusion time δ/Δ = 15.9/35.0 ms, two b=0 data and 98 diffusion images using q-space Cartesian grid sampling with radius size of 3, bmax= 3000 s/mm2. The DTI, DKI, MAP, and NODDI parameters were calculated using an in-house developed post-processing software called NeuDiLab, which is based on an open-resource tool DIPY (Diffusion Imaging In Python) and AMICO (https://github.com/daducci/AMICO). The derived parametric maps including fractional anisotropy (FA), mean diffusivity (MD), axial diffusivity (AD) and radial diffusivity (RD) from DTI and DKI; mean kurtosis (MK), axial kurtosis (AK) and radial kurtosis (RK) from DKI; intracellular volume fraction (ICVF); orientation dispersion index (ODI) and isotropic volume fraction (ISOVF) from NODDI; mean squared displacement (MSD), Q-space Inverse Variance (QIV), return to the origin probability (RTOP), return to-the plane probability (RTPP), return to the axis probability (RTAP), non-Gaussianity (NG), parallel non-Gaussianity (NG//) and perpendicular non-Gaussianity (NG⊥), from MAP-MRI. The region of interest (ROI) was manually drawn around the maximum abnormal signal area on all sections of the axis dark-fluid images. Then the ROIs were registered to all the diffusion parametric maps above. Next, the histogram features of all parameters were automatically extracted from their corresponding ROIs. Statistical analysis was performed using SPSS (SPSS 21.0 Chicago). All histogram features were applied for 3 comparisons (grade Ⅱ vs grade Ⅲ , grade Ⅱ vs grade Ⅳ , grade Ⅲ vs grade Ⅳ) using Mann-Whitney test, and a P < 0.05 was considered statistically significant. A receiver operating characteristic curve (ROC) analysis was also performed for all comparisons. The accuracy, sensitivity and specificity were also calculated at a cutoff value equivalent to the maximum value of the Youden index.Results
As shown in Figure 1, five of all histogram features were significantly different in all 3 comparisons, including ADmaximum, MDmaximum and RDmaximum from DTI, and QIVmaximum and QIVrange from MAP. The corresponding ROC analysis of these parameters are shown in Figure 2. For all the comparisons, the ADmaximum had the largest AUC (0.796, 0.645, and 0.717 for Grade II vs III, II vs IV, and III vs IV, respectively). Figure 3 are the representative images of patients with different glioma grades.Discussion
As reported in previous studies [1,2,5], DTI, DKI and NODDI were useful in glioma grading. In this study, four models characterize the microstructure in multiple perspective, the histogram features of these models could offer plenty of information for glioma grading. Our results found that some parameters of DTI and MAP can differentiate all the three different grade gliomas, especially for the DTI method, which is consistence with the results in Matteo Figini’s research [6]. In addition, the results showed that the maximum value of these parameters outperformed other parameters through histogram analysis. The reason maybe that the maximum value can better reflect the microstructure changes of tumors tissue themselves, and it excluded the information of tumor necrosis component. In this study, the parameter values of grade Ⅲ glioma were greater than those of grade Ⅱand grade Ⅳ, which was different from the results of previous studies. Maybe it caused by the drawing strategy of the ROIs that included the whole tumor and the peritumoral edema. In my subsequent studies, I will delineate and quantify the parameter values of the two components separately, and evaluate the best parameters and drawing ROI method in grading glioma.Conclusion
Histogram Analysis based on multiple diffusion models was helpful in glioma grading, especially for the maximum values of DTI and MAP methods.Acknowledgements
No acknowledgement found.References
[1] Caulo Massimo,Panara Valentina,Tortora Domenico et al. Data-driven grading of brain gliomas: a multiparametric MR imaging study.[J] .Radiology, 2014, 272: 494-503. [2] Van Cauter Sofie,Veraart Jelle,Sijbers Jan et al. Gliomas: diffusion kurtosis MR imaging in grading.[J] .Radiology, 2012, 263: 492-501. [3] Keran Ma, Xiaonan Zhang, Huiting Zhang, et al. Mean apparent propagator-MRI: A new diffusion model which improves temporal lobe epilepsy lateralization[J]. European J Radiology, 2020, 126, 108914. [4] Xiuwei Fu, Susan Shrestha, Man Sun, et al. Microstructural White Matter Alterations in Mild Cognitive Impairment and Alzheimer’s Disease, 2020, Clin Neuroradiol, 30, 569–579. [5] Zhao Jing,Li Ji-Bin,Wang Jing-Yan et al. IDH-1 Quantitative analysis of neurite orientation dispersion and density imaging in grading gliomas and detecting gene mutation status.[J] .Neuroimage Clin, 2018, 19: 174-181. [6] Matteo Figini, Marco Riva, Mark Grabam, et al. Prediction of Isocitrate Dehydrogenase Genotype in Brain Gliomas with MRI: Single-Shell versus Multishell Diffusion Models. Radiology 2018, 289: 788-796.Figures
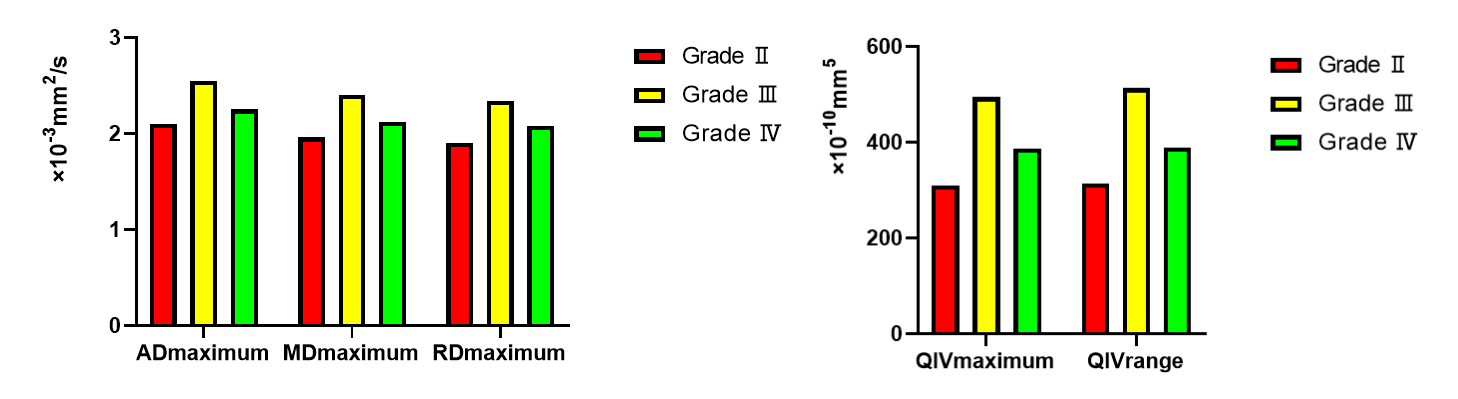
Fig.
1. Bar
graphs of ADmaximum, MDmaximum, RDmaximum, QIVmaximum
and QIVrange values averaged across grade Ⅱ (n=33), grade Ⅲ (n=11) and grade Ⅳ (n=54) gliomas. All parameters are significant with P<0.05.
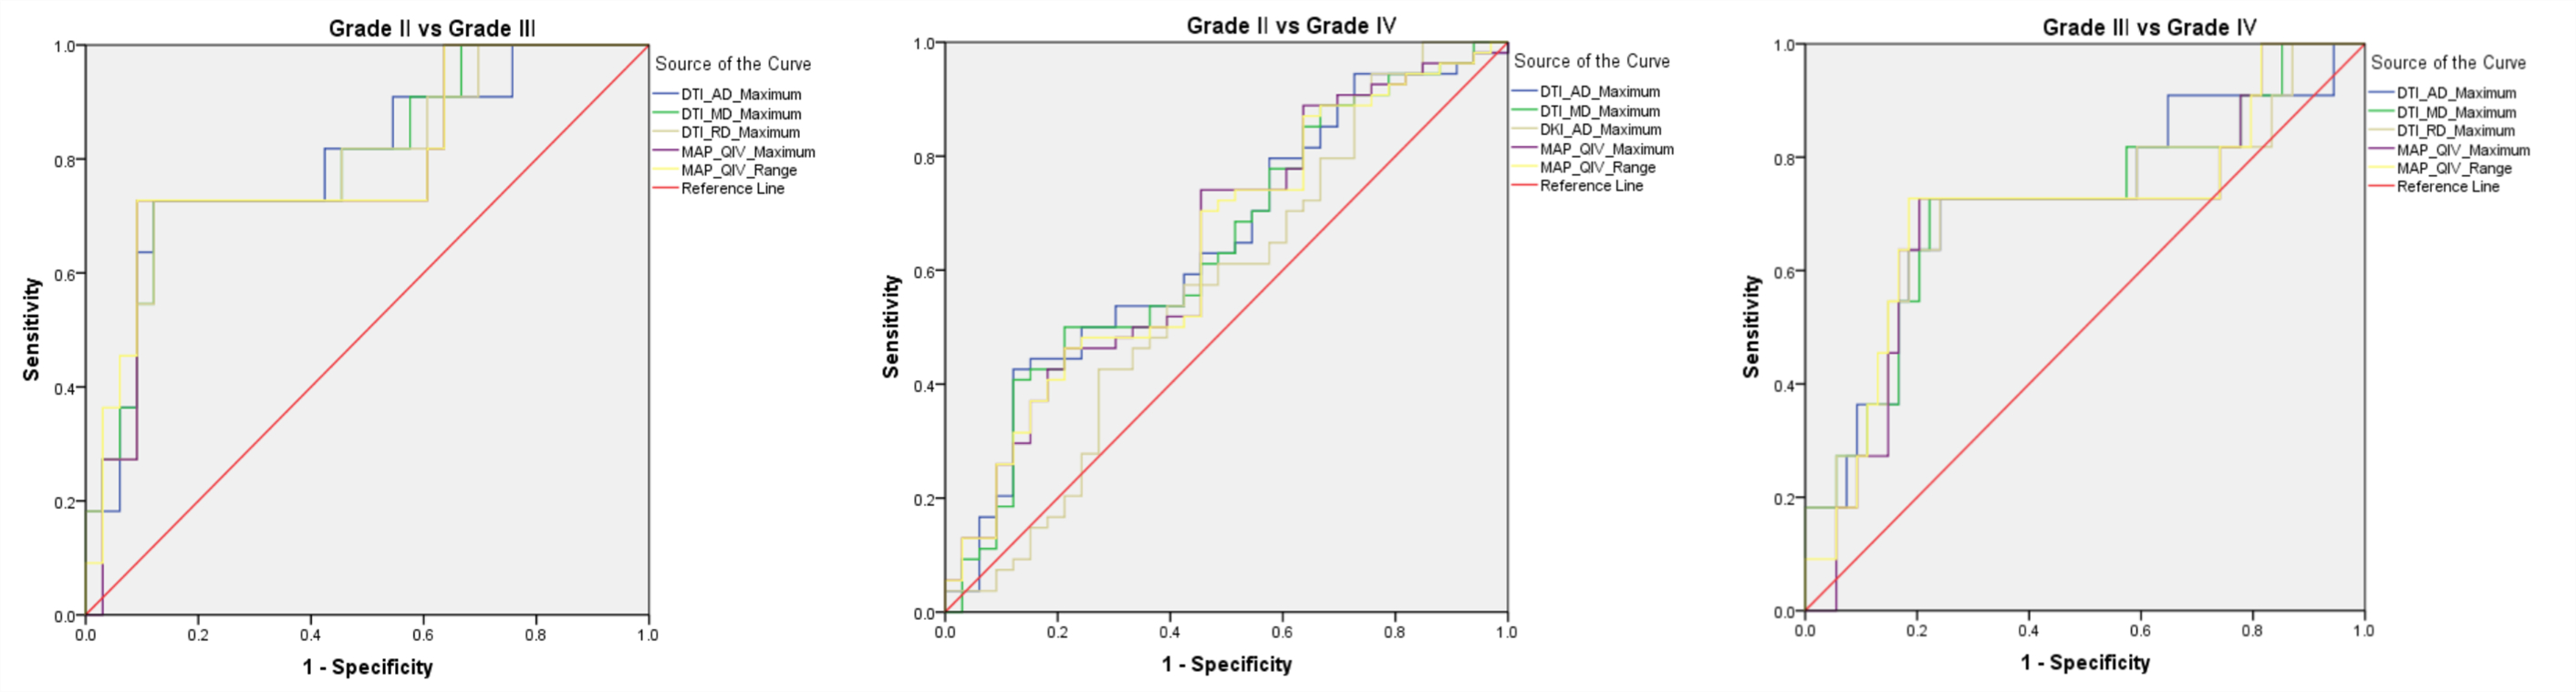
Fig.
2. ROC analysis for ADmaximum, MDmaximum,
RDmaximum, QIVmaximum and QIVrange in three
comparisons (GradeⅡ VS GradeⅢ, GradeⅡVS Grade Ⅳ and GradeⅢ VS Grade Ⅳ)
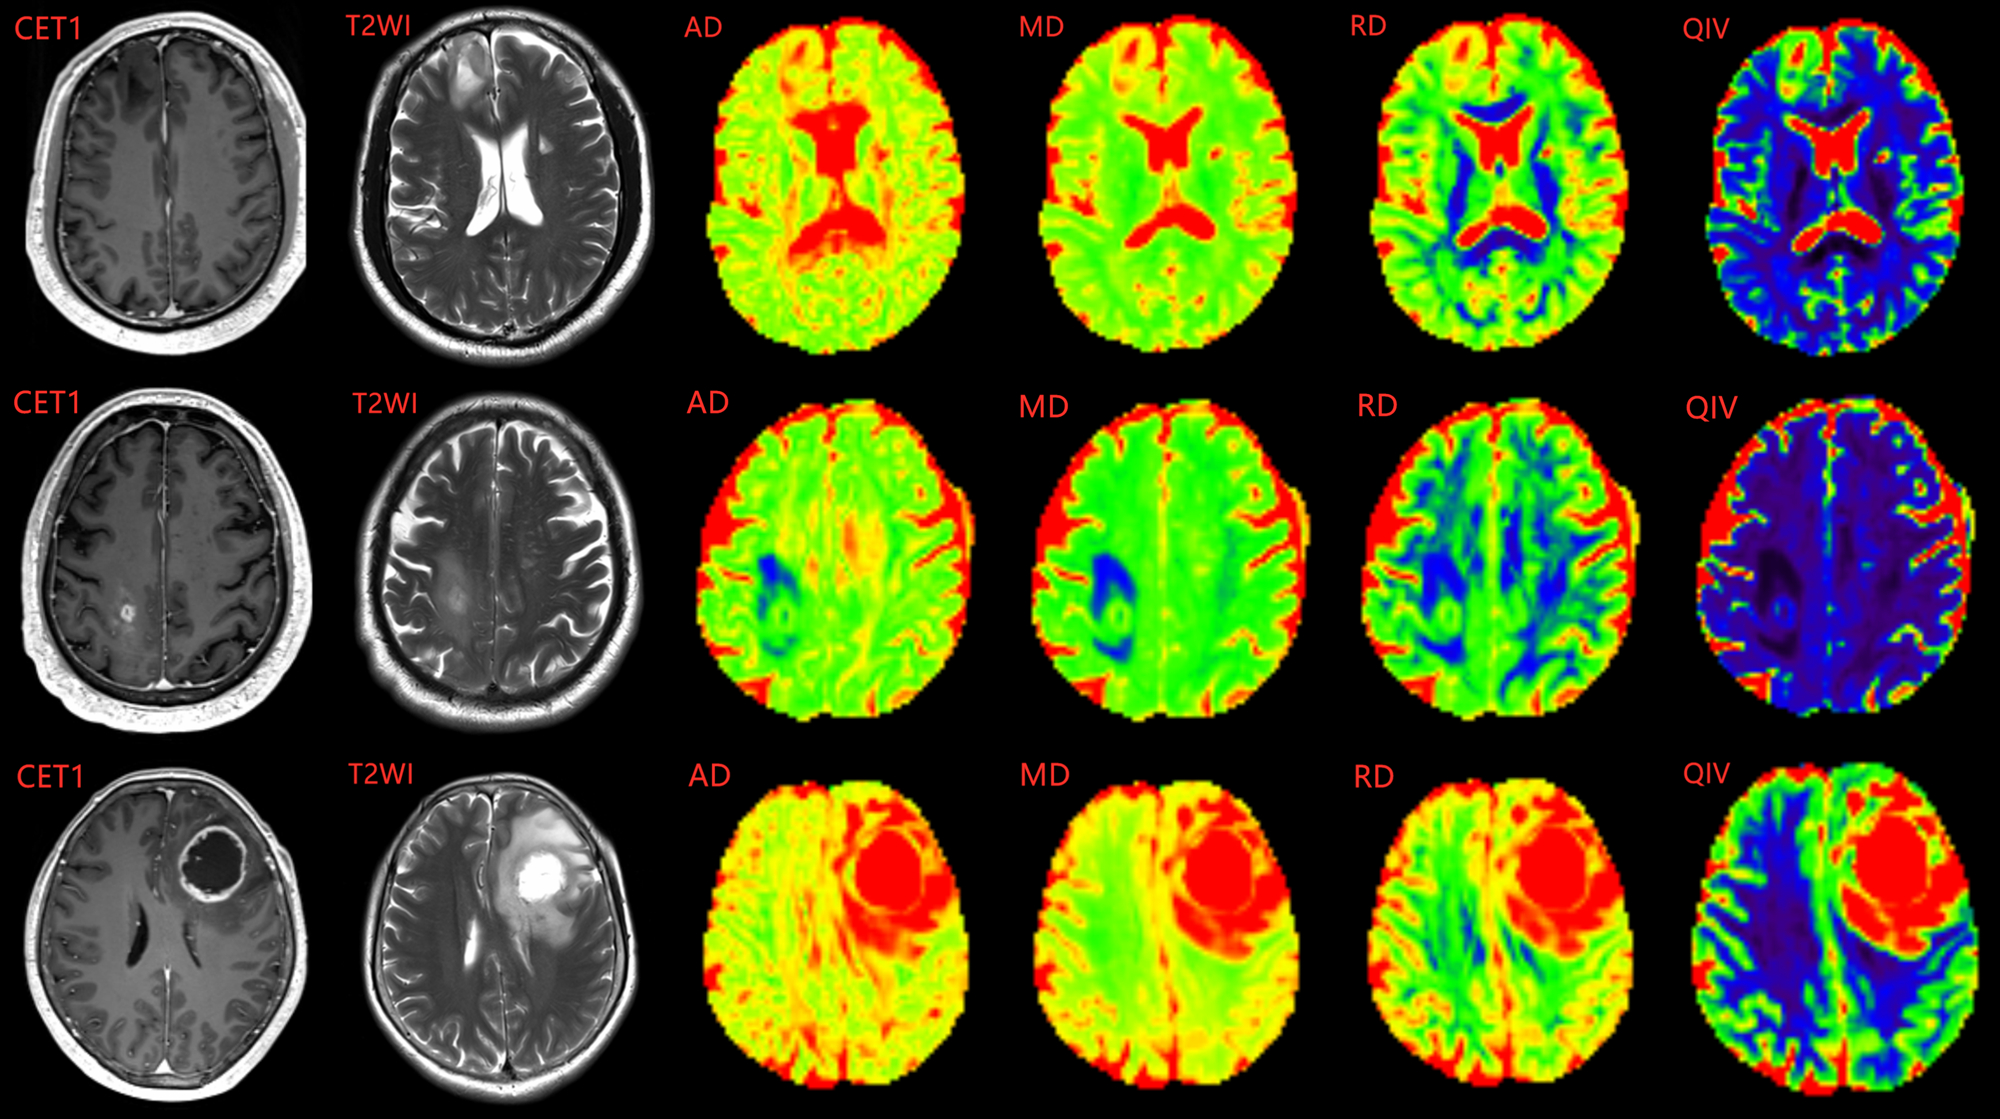
Fig.
3. Upper
images showed a 45-year-old male with WHO grade Ⅱ diffuse astrocytoma. Middle
images showed a 47-year-old male with WHO grade Ⅲ anaplastic
astrocytoma. Lower images showed a
58-year-old female with WHO grade Ⅳ glioblastoma.