3670
Diffusion-time-dependent diffusion MRI based microstructural mapping for grading and categorizing in pediatric brain tumor1Key Laboratory for Biomedical Engineering of Ministry of Education, Department of Biomedical Engineering, College of Biomedical Engineering & Instrument Science, Zhejiang University, Hang zhou, Zhejiang, China, 2Children's Hospital, Zhejiang University School of Medicne,Department of Radiology, Hang zhou, Zhejiang, China, 3Children's Hospital, Zhejiang University School of Medicne, Department of Pathology, Hangzhou, Zhejiang, China
Synopsis
Diffusion-time dependent diffusion MRI (dMRI) has been proposed to characterize tumor microstructure. This study aimed to evaluate diagnostic value of time-dependent dMRI based microstructural mapping to grade and categorize pediatric brain tumor at 3T. Oscillating and pulsed gradient dMRI was performed in 35 pediatric patients. Cell diameter (d), intracellular fraction (fin) and extracellular diffusivity (Dex) were fitted based on the IMPULSED model. Higher cellularity (fin/d) and fin and lower Dex were found in high-grade glioma than low-grade ones. The cellularity further increased in medulobastoma compared with glioma. Cellularity achieved the highest area-under-the-curve than the other dMRI metrics in grading glioma.
Introduction
Recent simulation and preclinical studies of diffusion-time (td) dependent diffusion MRI (dMRI)[1,2] has demonstrated unique advantages of this technique in probing tumor microstructure.[3-6] Despite the technical challenges of achieving short td on clinical scanners due to the limited gradient strength, clinical feasibility of td-dependent dMRI in tumor applications has also been attempted.[7-11] However, previous studies were mostly feasibility studies that showed the changes of td-dependency in tumorous tissues. This study estimated the tumor microstructural properties based on the IMPULSED model [3] and evaluated diagnostic values of the microstructural information in grading brain glioma and classifying medulloblastoma in pediatric patients.Methods
35 pediatric patients (age ranged from 4 months to 13 years old; 28 males and 7 females) with brain tumor were enrolled in the study under the IRB approval and parental consent. According to the pathological biopsy, the tumors were divided into low-grade glioma (WHO I and II, N = 12), high-grade glioma (WHO IV, N = 11) and medulloblastoma (WHO IV, N = 12).The dMRI data were acquired on a 3T Phillips Achieva scanner (maximum gradient = 80 mT/m) using oscillating and pulsed gradient spin-echo (OGSE and PGSE) sequences with the following parameters: diffusion directions = 4, TE/TR = 168/3000 ms, FOV = 180×180 mm2, in-plane resolution = 1.4×1.4 mm2, slice thickness = 8 mm, slice number = 3. OGSE data were obtained at oscillating frequencies of 17Hz (effective td = 15 ms, b = 0.5/1/2 ms/µm2), 33Hz (effective td = 7.5 ms, b = 0.5 ms/µm2), and 50Hz (effective td = 5 ms, b = 0.35 ms/µm2), and PGSE was acquired at σ/Δ of 60/82.8 ms (b=0.5/1/2 ms/µm2). The total acquisition time was 5 mins. Routine T1-weighted images before and after Gd-enhancement, T2-weighted and FLAIR images also were acquired.
Regions of interest (ROIs) were manually desalinated in solid regions of the tumor on b0 images for each patient. The OGSE and PGSE data were fitted with the IMPULSED model [3] to obtain the tumor microstructural properties, including cell diameter (d), intracellular fraction (fin) and extracellular diffusivity (Dex) using nonlinear least square curve fitting in MATLAB. The intracellular diffusivity (Din) was fixed at 1 µm2/ms and β was set to 0 to enhance fitting stability [3]. The cellularity was calculated as fin/d. The apparent diffusivity coefficient (ADC) values were calculated at each td.
The IMPULSED parameters and ADC values were compared between low-grade glioma, high-grade glioma, and medulloblastoma using one-way ANOVA followed post-hoc two-sample t-tests. We used ADC values from the lowest 10% voxels, intracelluar fraction and diameter values from the highest 60% voxels, and cellularity from the highest 10% voxels in analysis. The diagnostic performance to differeciate low-grade versus high-grade glioma, and to classify high-grade glioma from medulloblastoma were assessed by receiver-operating curve (ROC) analysis.
Results
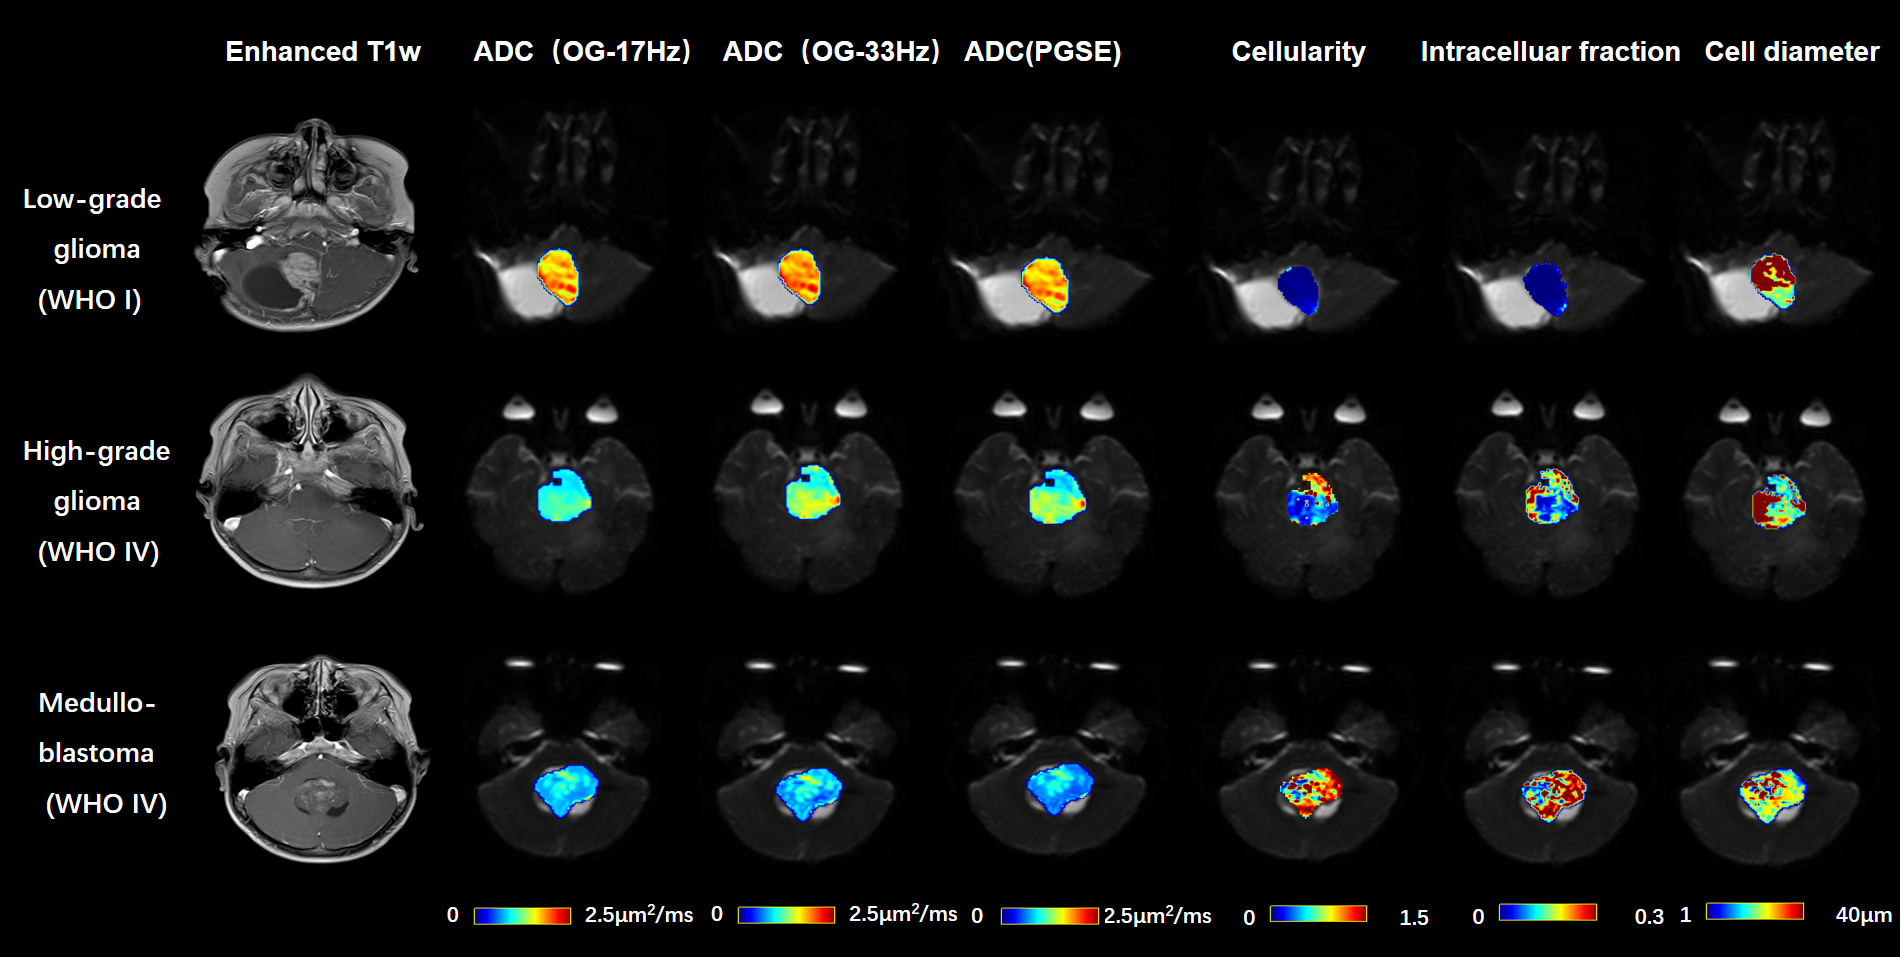
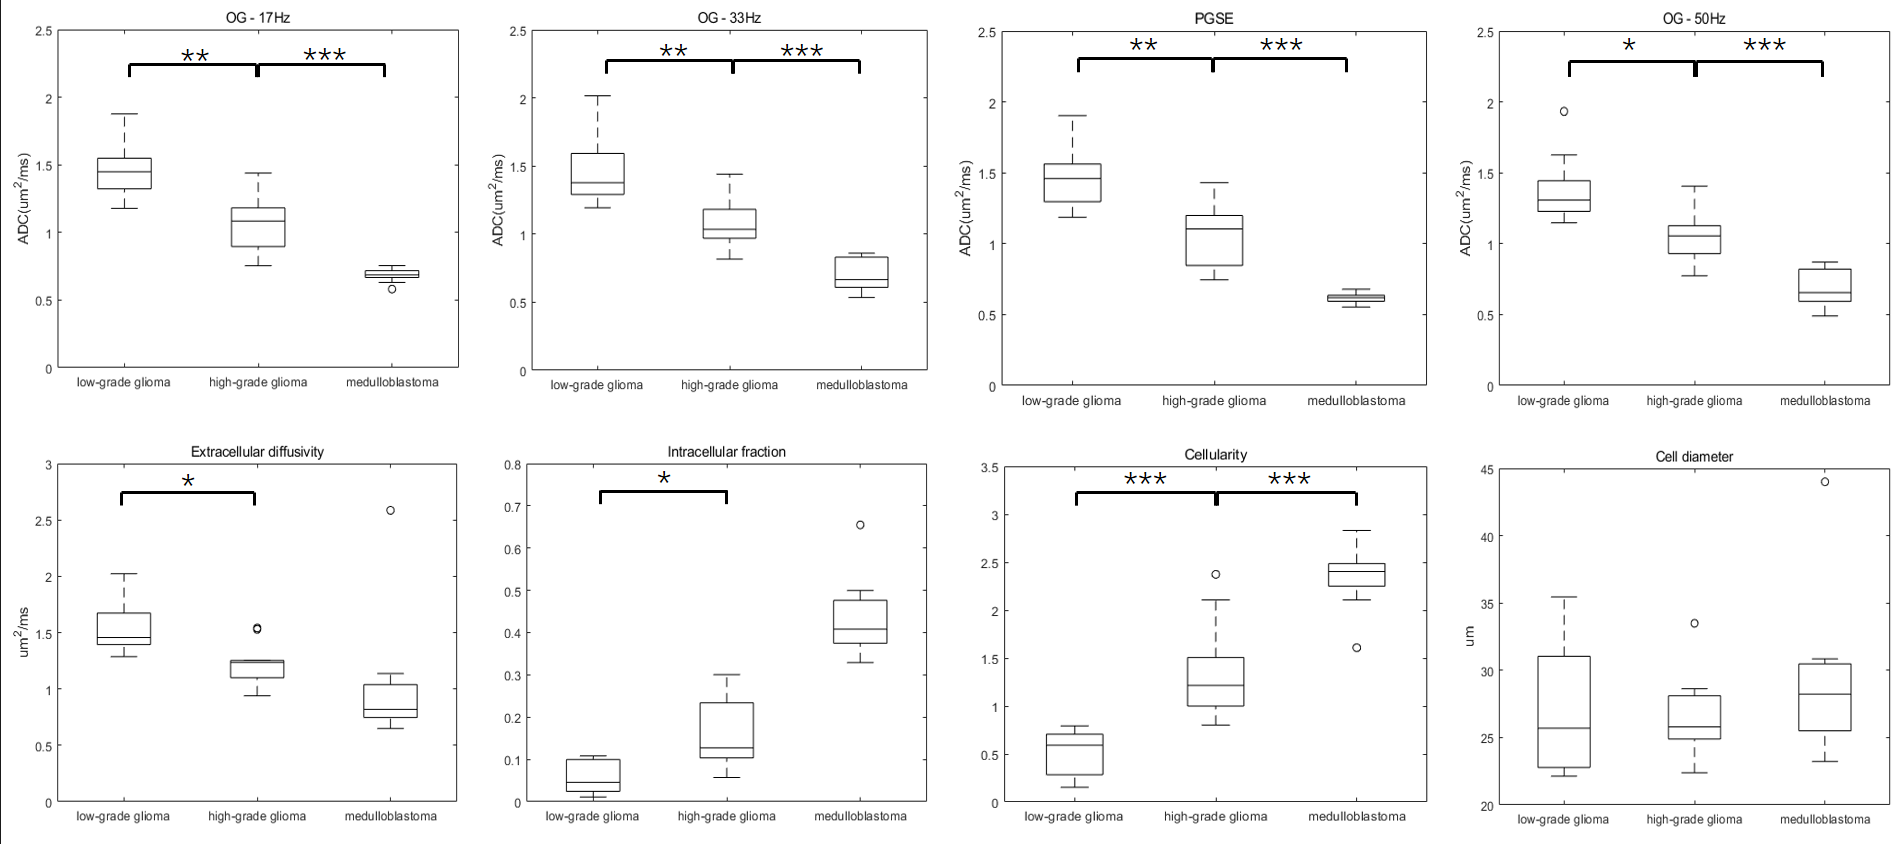
The tumor microstructural maps fitted from IMPULSED model were shown for representative cases of low-grade glioma, high-grade glioma, and medulloblastoma, along with the ADC maps and Gd-enhanced T1-weighted images in Figure 1. We visually observed the fin and cellularity values were higher in high-grade gliomas than the low-grade glioma, which further increased in medulloblastoma, whereas the ADC showed an inversely.Group comparison in Figure 2 showed ADC/Dex were significantly lower and fin /cellularity were significantly higher in high-grade gliomas compared to the low-grade ones. ADC was higher and cellularity was lower in glioma than medulloblastoma. Cell diameter did not show a significant difference between groups.
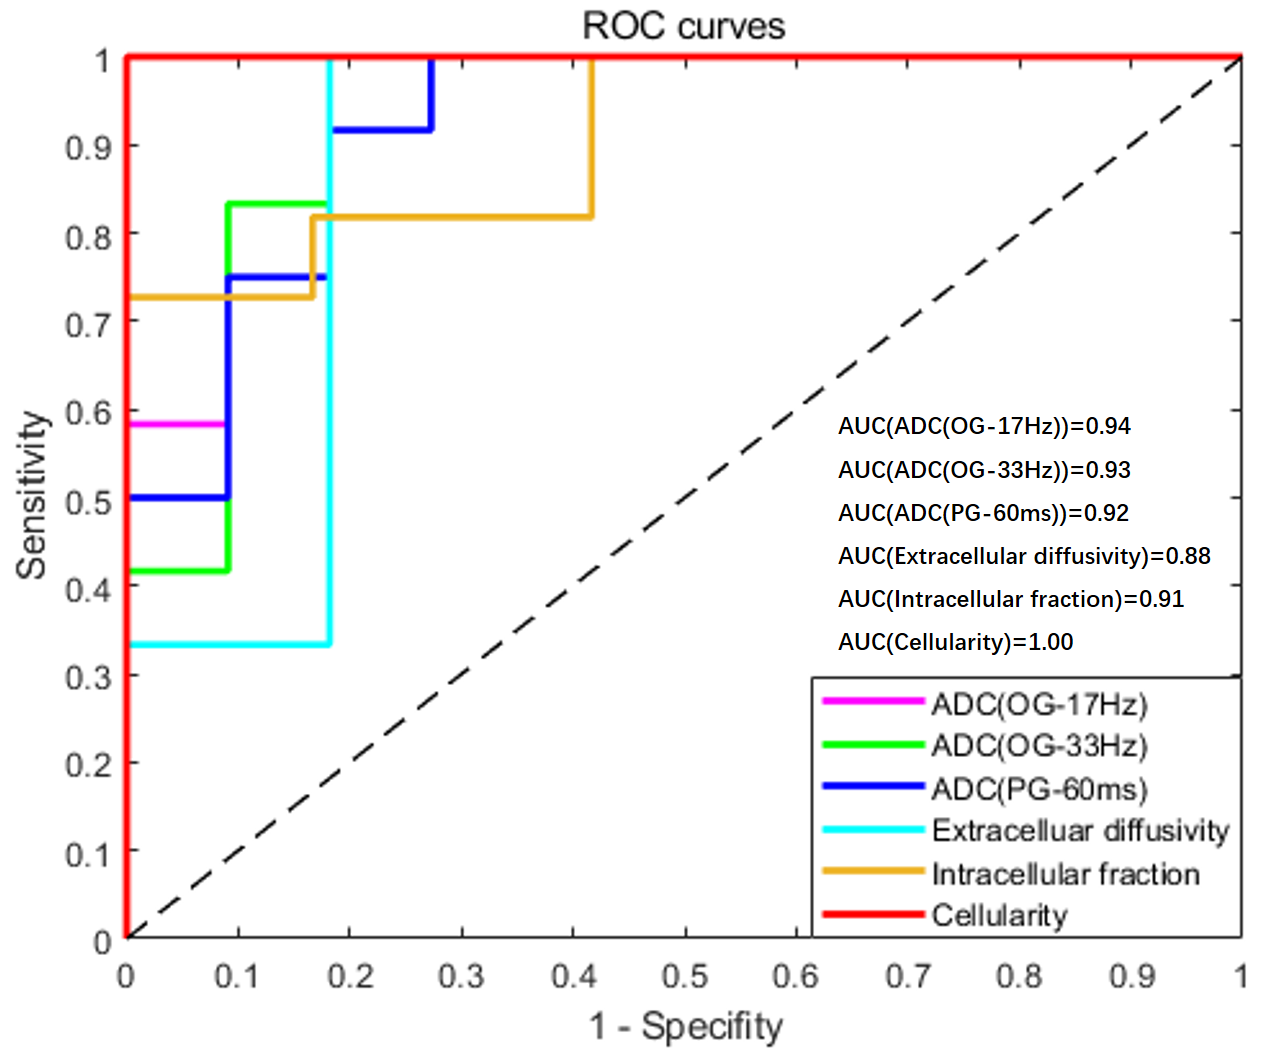
ROC analysis revealed that cellularity achieved the highest area-under-the-curve (AUC) of 1 in differentiating low-grade and high-grade glioma, followed by ADC measurements (AUC = 0.92/0.94/0.93 for PGSE, OGSE-17Hz, and OGSE-33Hz, respectively) (Figure 3). Cellularity and ADC measurements could separate high-grade glioma from medulloblastoma with AUC of 0.98 and 1.
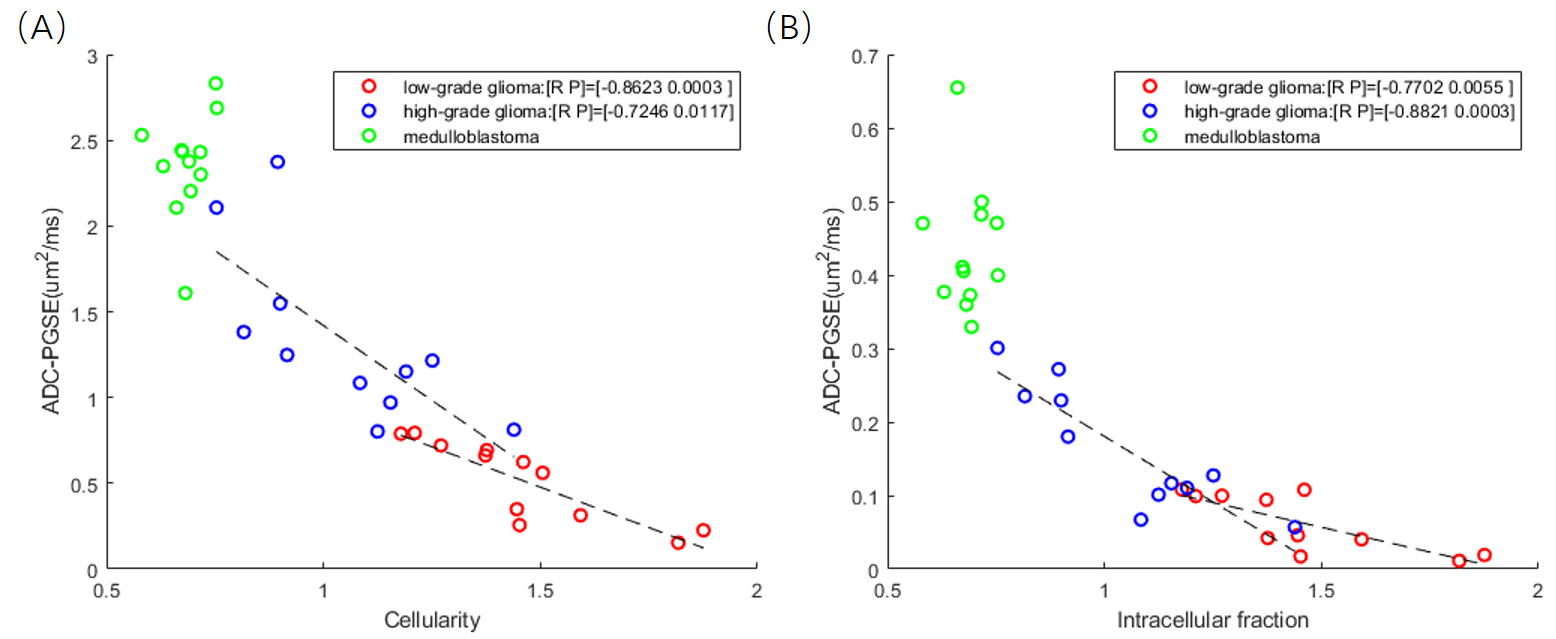
We examined the correlations between the microstructural properties with PGSE-ADC, and found a significantly negative relationship between ADC and fin,and between ADC and cellularity. Regression analysis within each group between ADC and fin revealed highest correlation for high-grade glioma (r = -0.8821, p = 0.0003), followed by low-grade glioma (r = -0.7702, p = 0.0055); whereas not significant correlation were found for medulloblastoma (p=0.8574). Regression analysis between ADC and cellularity revealed highest correlation for low-grade glioma (r = -0.8623, p = 0.0003), followed by high-grade glioma (r = -0.7246, p = 0.0117); whereas no significant correlation for medulloblastoma (p=0.4095).
Discussion and Conclusion
This study used td-dependent dMRI to map the tumor microstructural properties and tested its diagnostic performance in grading glioma and categorizing different types of pediatric brain tumor. Results indicated the cellularity index showed the highest AUC of 1 in classifying high-grade and low-grade glioma. Medulloblastoma can be easily separated using both cellularity and ADC measurements. The current td-dependent dMRI protocol (5 mins) can be readily translated to clinical routines.This study has some limitations. For example, the IMPULSED model takes the cells as packed spheres, and ignores the nucleuses which occupy a significant portion of the tumor cells; the exchange of water molecules inside and outside the cell is not taken into account in this model. Larger sample size is needed to verify the clinical significant of this method, and pathological examinations are needed to validate the microstructure fitting accuracy.
Acknowledgements
This work is supported by the Ministry of Science and Technology of the People’s Republic of China (2018YFE0114600), National Natural Science Foundation of China (61801424 and 81971606).References
1. Stepisnik J. Time-Dependent Self-Diffusion by Nmr Spin-Echo. Physica B 1993;183(4):343-350.
2. Gore JC, Xu JZ, Colvin DC, Yankeelov TE, Parsons EC, Does MD. Characterization of tissue structure at varying length scales using temporal diffusion spectroscopy. NMR in biomedicine 2010;23(7):745-756.
3. Jiang XY, Li H, Xie JP, Zhao P, Gore JC, Xu JZ. Quantification of cell size using temporal diffusion spectroscopy. Magn Reson Med 2016;75(3):1076-1085.
4. Reynaud O, Winters KV, Hoang DM, Wadghiri YZ, Novikov DS, Kim SG. Pulsed and oscillating gradient MRI for assessment of cell size and extracellular space (POMACE) in mouse gliomas. NMR in biomedicine 2016;29(10):1350-1363.
5. Panagiotaki E, Walker-Samuel S, Siow B, Johnson SP, Rajkumar V, Pedley RB, Lythgoe MF, Alexander DC. Noninvasive Quantification of Solid Tumor Microstructure Using VERDICT MRI. Cancer Res 2014;74(7):1902-1912.
6. Colvin DC, Yankeelov TE, Does MD, Yue Z, Quarles C, Gore JC. New insights into tumor microstructure using temporal diffusion spectroscopy. Cancer Res 2008;68(14):5941-5947.
7. Xu J, Jiang X, Li H, Arlinghaus LR, McKinley ET, Devan SP, Hardy BM, Xie J, Kang H, Chakravarthy AB, Gore JC. Magnetic resonance imaging of mean cell size in human breast tumors. arXiv 2019;arXiv:1905.07818.
8. Lemberskiy G, Rosenkrantz AB, Veraart J, Taneja SS, Novikov DS, Fieremans E. Time-Dependent Diffusion in Prostate Cancer. Invest Radiol 2017;52(7):405-411.
9. Lima M, Kataoka M, Honda M, Ohno AK, Ota R, Ohashi A, Urushibata Y, Feiweier T, Toi M, Togashi K. Time-Varying Diffusion Patterns in Breast Cancer Linked to Prognostic Factors. 2019; Montreal, QC, Canada.
10. Lemberskiy G, Baete S, Novikov D, Fieremans E, Zan E, Hu K, Kim S. Diffusion time-dependence of diffusivity and kurtosis in locally advanced head and neck squamous cell carcinoma before and after chemo-radiation therapy. 27th Annual Meeting of International Society of Magnetic Resonance in Medicine2019; Montreal, QC, Canada.
11. Reynaud O. Time-Dependent Diffusion MRI in Cancer: Tissue Modeling and Applications. Front Phys 2017;5.
Figures