3669
The utility of IVIM maps in the assessment of microvascular perfusion of brain glioma1LIM44, Instituto e Departamento de Radiologia, Faculdade de Medicina, Universidade de Sao Paulo, Sao Paulo, Brazil, 2InBrain Lab, University of Sao Paulo, Ribeirao Preto, Brazil, 3Instituto do Cancer do Estado de Sao Paulo, Sao Paulo, Brazil, 4Memorial Sloan-Kettering Cancer Center, New York, NY, United States, 5Departamento de Clinica Medica, Faculdade de Medicina de Ribeirao Preto, Universidade de Sao Paulo, Ribeirao Preto, Brazil, 6InBrain Lab - University of Sao Paulo, Ribeirao Preto, Brazil
Synopsis
The assessment perfusion in glioma is an important information in the tumor characterization. Traditional MRI methods employed to analyze glioma are based on the application of contrast agents to enhance the T1 signal and/or to measure perfusion within the tumor cells. The analysis of tumor microvasculature however is hampered by the size of contrast agent molecules. In that sense, SWI can be employed, although it does not provide quantitative information. IVIM maps showed to be an interesting alternative for such assessment, even showing potential of an early biomarker to assess early changes in perfusion, specially in low grade gliomas.
Introduction
Glioma is an important and heterogeneous class of primary brain tumors originated from glial cells that surround neurons in the brain tissue, representing about 50 % of all cerebral neoplasm (1). The WHO classification system subdivides gliomas by histopathological grade and molecular profile. It is well known that grade IV and IDH wildtype tumors are more aggressive and have worse prognosis. Among low grade gliomas (II and III), such classification encompasses a more varied group of tumors with different clinical impact. A lot of research has been done trying to subdivide them into more homogeneous subgroups.Emerging noninvasive imaging techniques have been increasingly used for better characterization of brain tumors, in order to predict grade and biological behaviour. Perfusion imaging, for example, has been added to contrast enhanced sequences for better characterization of tumor cells’ hemodynamic, which directly reflects tumor's aggressiveness. Also, it better evaluates tumors microvasculature, as contrast agents are composed of relatively big molecules and may not arrive at the distal thin vessels, unless the blood-brain barrier (BBB) is disrupted. Also, another sequence recently used to analyze gliomas microvasculature is susceptibility weighted images (SWI).
Intravoxel incoherent motion (IVIM) is a new MRI method which explore an scaling in diffusion weighting to infer diffusion and perfusion information simultaneously (2). As it explores the diffusion movement of water molecules, it is possible to assess both the macro- and microvascular perfusion within the tumor. Therefore, the aim of this study was to evaluate how the IVIM perfusion outputs correlates with the classical measurements of dynamic susceptibility contrast (DSC) and the microvascular signal of SWI and how it can be complementary to both. Furthermore, we also assessed how the microvasculature of tumors differ in correlation with tumor grade.
Methods
Four patients with diffuse glioma (two low grade and two high grade) were scanned in a 3T Philips system and a 32-channel head coil. IVIM images were acquired using 15 different b-values and a SE-EPI sequence (TR/TE = 1500/106 ms, FOV = 240 x 240 mm2, matrix = 288 x 288). DSC was acquired using a GRE-EPI sequence, TR/TE = 1700/25 ms, FOV = 240 x 240 mm2, matrix 160 x 160, 80 temporal acquisition. SWI was acquired using a GRE sequence, TR/TE = 1400/20 ms, FOV = 240 x 240 mm2, matrix 512 x 512.IVIM data processing was performed in MATLAB using the NNLS fitting model (3). DSC maps and SW images were corregistered to the IVIM space using the ANTs toolbox (4). Statistical analysis was performed in MATLAB.
Results
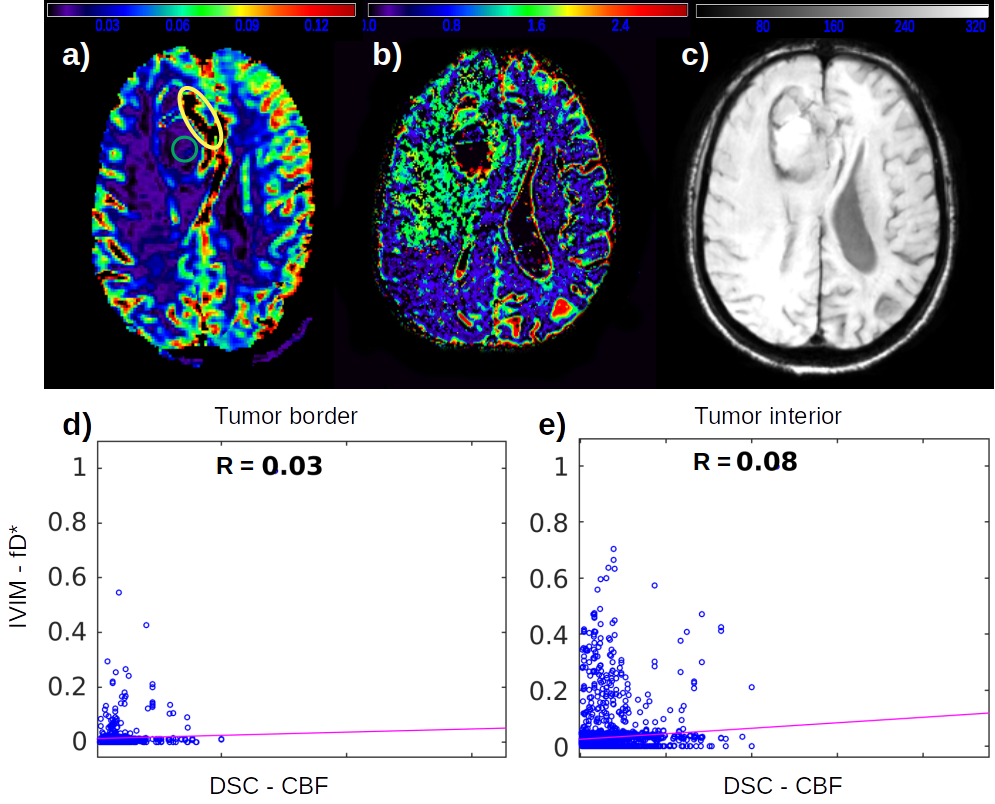
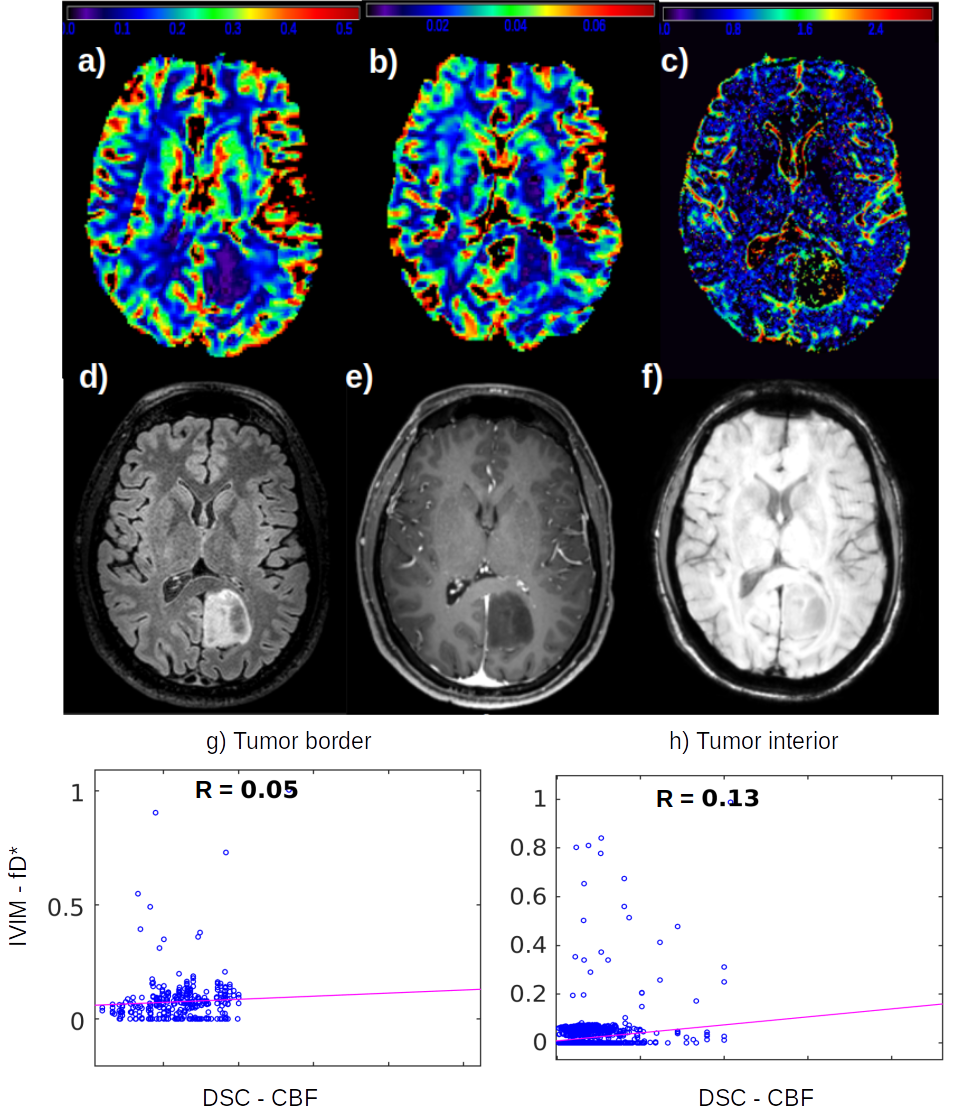
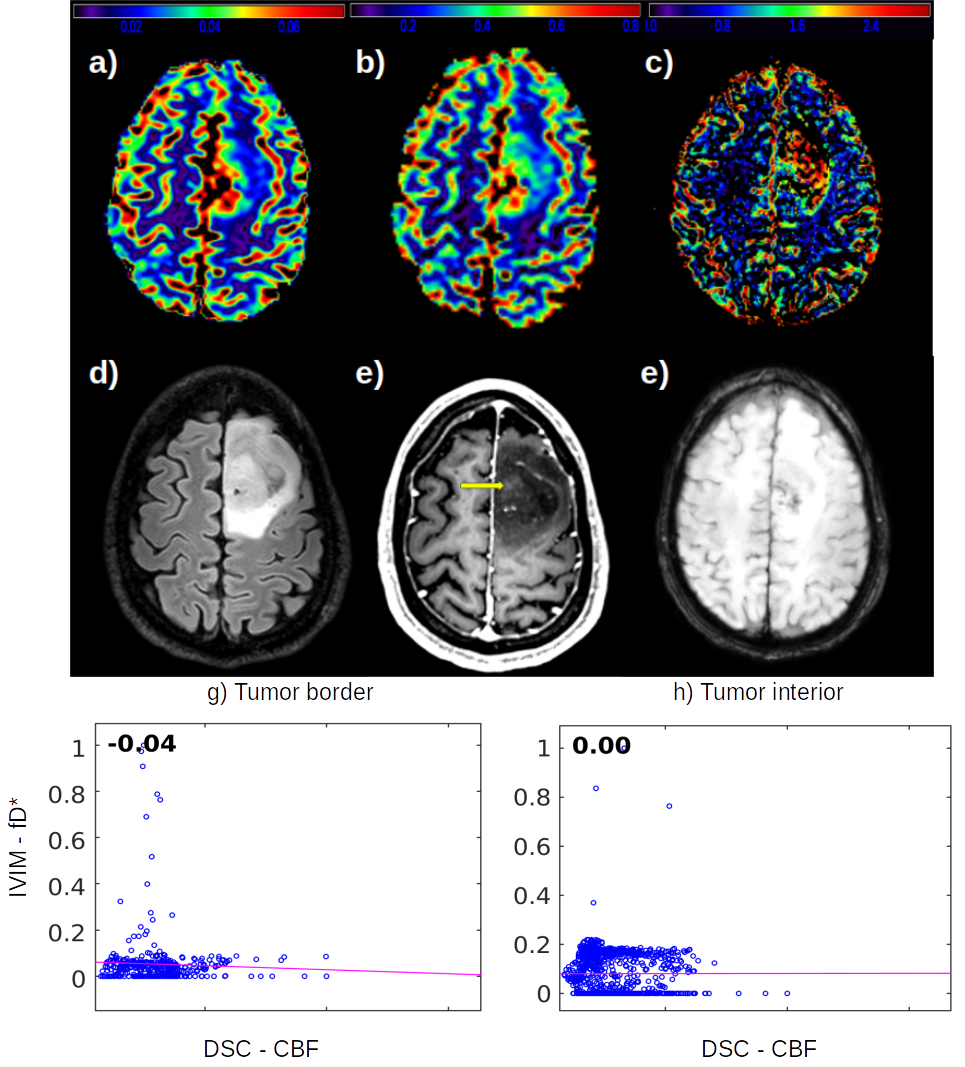
From the high grade gliomas (HGG) example shown in figure 1 it is possible to observe a complementary pattern among the DSC CBF, CBV (FIg. 1a, 1b) and the IVIM fD* (Fig. 1c) maps, which is also well correlated to the microvascular signal in SWI. The low correlation coefficient between CBF and fD* highlight this pattern.We also identified different IVIM maps and values among low grade gliomas (LGG) examples (Figures 2 and 3), reflecting the heterogeneity of biological behaviour in this subgroup. The LGG tumor with a more benign molecular profile in figure 2 (astrocytoma grade II IDH-mutated), that didn’t show any aggressive imaging feature, also presented less foci of high IVIM. In contrast, the tumor which presented heterogeneous T2 and FLAIR signal, foci of dark SWI and contrast enhancement and an area of high rCBV, presented high IVM values within the area of high FLAIR signal (Figure 3).
Discussion
The HGG has a higher cellularity level, which increases the demand for blood flow and perfusion. This behavior can be captured by traditional contrast enhanced perfusion images, in which the tumor periphery has a high rCBV and CBF. The perfusion signal in the tumor's interior, on the other hand, does not follow such a high perfusion pattern, since the contrast agent cannot reach the microvasculature (Fig. 1a), unless the BBB is disrupted. However, by employing the IVIM method it was possible to detect the microvascular perfusion in the interior of the tumor, in agreement to a visual inspection of SWI maps.In LGG, however, it is not expected to find disruption in BBB, which hampers the measurement of perfusion using contrast enhanced methods. In the LGG case shown in figure 3, the foci of dark SWI suggests that the glioma’s aggressiveness is increasing, which was also captured by fD* IVIM maps, reporting an increase of microvascular perfusion. The null correlation between fD* and DSC perfusion in the tumor’s interior (Fig. 3h) enhance the better usage of IVIM in this case.
More interestingly, however, is the analysis of the LGG shown in figure 2. In this case of a less aggressive tumor, neither the DSC maps nor the SWI were able to capture changes in the microvascular perfusion. The fD* map had the sensitivity to detect small focus of increased perfusion within the areas of high FLAIR signal.
Conclusion
The present results for HGG suggested the IVIM maps as a complementary imaging modality to analyse the tumor’s hemodynamic. More interesting, however, was the IVIM application in LGG as a possible early biomarker for microvascular perfusion in less aggressive tumors.Acknowledgements
CNPq - process number 151245/2019-3. FAPESP - process number 2019/06148-6.References
1. Goodenberger ML, Jenkins RB. Genetics of adult glioma. Cancer Genet [Internet]. 2012;205(12):613–21. Available from: http://www.ncbi.nlm.nih.gov/pubmed/23238284
2. Paschoal AM, Leoni RF, dos Santos AC, Paiva FF. Intravoxel incoherent motion MRI in neurological and cerebrovascular diseases. NeuroImage Clin. 2018;20.
3. Keil VC, Madler B, Gielen GH, Pintea B, Hiththetiya K, Gaspranova AR, et al. Intravoxel incoherent motion MRI in the brain: Impact of the fitting model on perfusion fraction and lesion differentiability. J Magn Reson Imaging [Internet]. 2017;46(4):1187–99. Available from: http://www.ncbi.nlm.nih.gov/pubmed/28152250
4. Avants BB, Tustison NJ, Song G, Cook PA, Klein A, Gee JC. A reproducible evaluation of ANTs similarity metric performance in brain image registration. Neuroimage [Internet]. 2011;54(3):2033–44. Available from: http://dx.doi.org/10.1016/j.neuroimage.2010.09.025
Figures