3668
Diffusion and perfusion MRI predicts response preceding and shortly after stereotactic radiosurgery to brain metastases1Medical Physics, Memorial Sloan Kettering Cancer Center, New York, NY, United States, 2Radiology, Memorial Sloan Kettering Cancer Center, New York, NY, United States, 3Radiation Oncology, Memorial Sloan Kettering Cancer Center, New York, NY, United States
Synopsis
In the clinical settings it is essential to accurately assess, whether or not a brain metastases has been successfully treated or whether it requires additional treatment, especially in high dose radiation therapy, such as stereotactic radiosurgery (SRS). The present prospective study aims to determine the ability of Diffusion Weighted (DW)- and Dynamic Contrast Enhanced (DCE)-MRI to predict the long-term response of brain metastases within 72 hours of SRS. The preliminary results are promising as it will inform the treating physicians at an early time point about which patients will benefit from SRS (or not).
Introduction:
Intravoxel incoherent motion (IVIM) DW-MRI has demonstrated promise in simultaneously characterizing the properties of tumor diffusion and perfusion in cancer patients1, 2. Dynamic contrast enhanced (DCE)-MRI provides information of tumor vascularity and permeability3, 4. There is growing evidence that perfusion MRI can improve the diagnosis and prognosis of patients with brain tumors over conventional imaging alone5, 6.Method:
There were 25 total brain metastases (BM) included from 16 patients that consented and enrolled in the study. All pre-SRS and within 72 hours post-SRS MRI examinations were performed on a 3 T MRI scanner (Philips Ingenia; Philips Healthcare, Netherlands) using an 8-channel head coil. The standard clinical MRI acquisition along with the DCE- and DWI-MRI acquisition were performed with the parameters reported in the literarture7-9. All the ROIs were delineated by a board-certified neuroradiologist. All DW- and DCE-MRI data postprocessing and map generation were performed using in-house–developed software entitled MRI Quantitative Analysis of Multi-Parametric Evaluation Routines (MRI-QAMPER)9, 10. For all patients, the clinical assessment was classified as progressive disease (PD), stable disease (SD), partial response (PR), or complete response (CR) based on the Response Assessment Neuro-Oncology Brain Metastases (RANO-BM) criteria11. Statistical Analysis: Univariate analysis was performed using the Wilcoxon Rank-Sum Test (WRST) to find the degree of differences between the grouped analysis (based on RANO criterion). Wilcoxon Signed Rank Test (WSRT) used to assess the potentially significant biomarker changes, pre- and post-SRS (within 72 hours) within the lesions regardless of the outcome. A p-value <0.05 was considered statistically significant. We used Storey’s method for multiple comparisons to control for false positive discoveries and have reported q-values.Result:
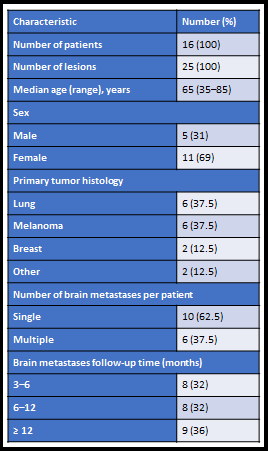
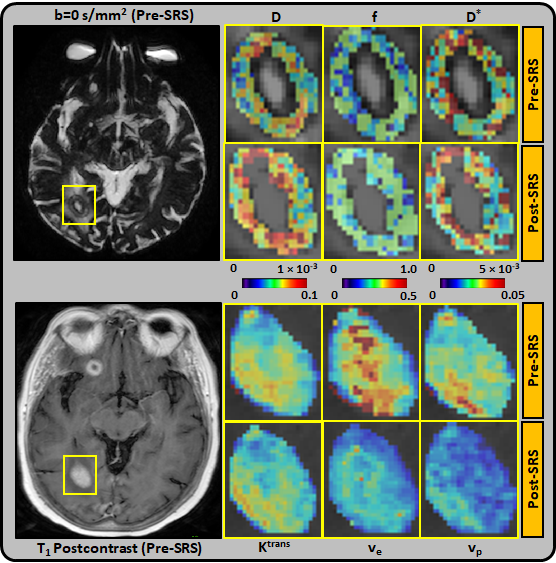
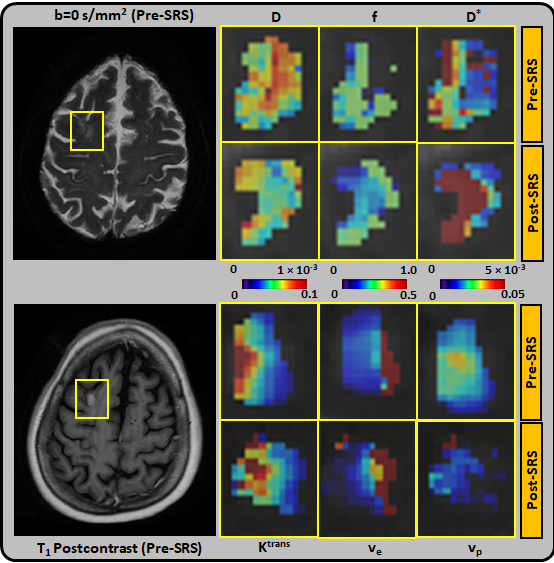
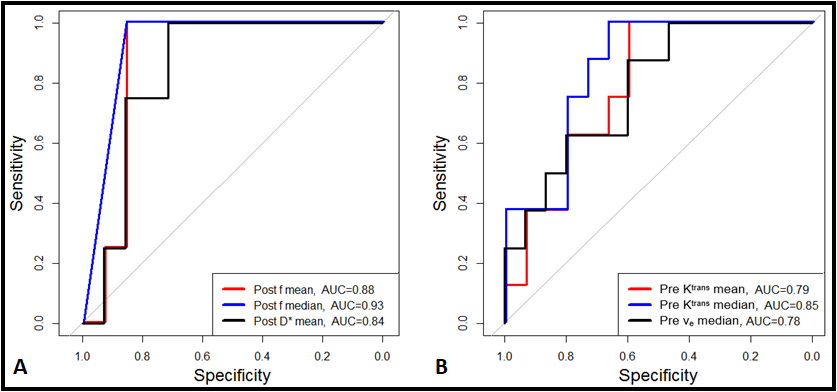
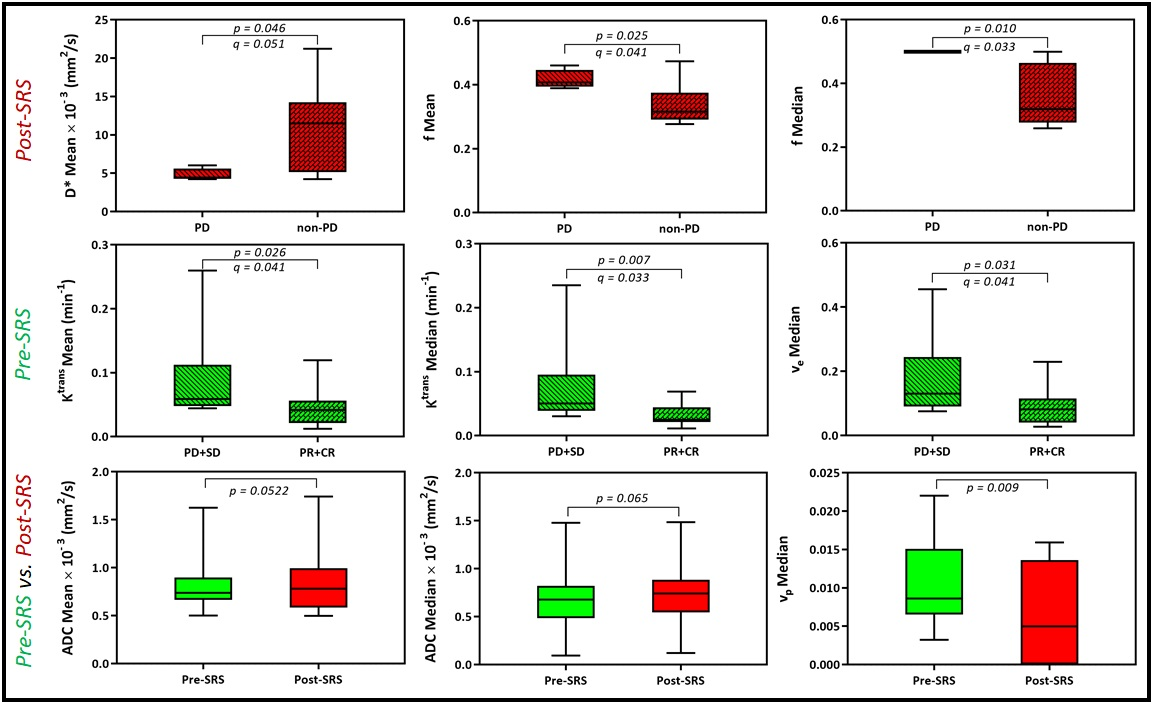
The majority (75%) of the BM were from melanoma and lung primary tumors (Table 1). Using RANO-BM criteria, 20/25 lesions demonstrated local control after SRS. Rates of CR, PR, SD, and PD were 12%, 52%, 16%, and 20%, respectively. Eighty percent (20/25) of the lesions met the RANO-BM criteria for measurable disease. Twenty percent (5/25) were smaller and were included for analysis according to our modified criteria but none measured less than 5 mm. Representative DWI and DCE-derived parametric maps overlaid on corresponding DWI and DCE-MRI images (pre- and post-SRS) for two patients are shown in Figures 1–2. For comparisons between outcome groups, univariate analysis using the WRST demonstrated a significant difference in both mean and median f acquired early post-SRS (q = 0.041 and 0.033 respectively). Lesions that demonstrated PD had a higher f mean (0.416 vs. 0.336) and f median (0.500 vs. 0.358) than lesions that did not demonstrate PD. Using the Youden index, we determined that a post-SRS f mean cutoff value of 0.383 and f median cutoff value of 0.494 yielded a sensitivity of 100% and specificity of 86% for predicting PD and non-PD, with a receiver operating characteristic area under the curve (AUC) of 0.88 and 0.93 respectively (Figure 3). Notably, post-SRS D* mean demonstrated statistical significance between the PD and non-PD groups (p = 0.046) but did not demonstrate q < 0.05 upon multiple comparison analysis (q = 0.051). When the lesions were separated as responders (CR and PR) and non-responders (PD and SD), there was a significant difference in ve median on pre-SRS DCE-MRI (q = 0.041). Lesions that responded to SRS had a lower ve median than those that did not (0.089 vs. 0.181). A pre-SRS ve median cutoff value of 0.086 was 88% sensitive and 60% specific, with an AUC of 0.78 (Figure 3). There was also a significant difference in pre-SRS Ktrans mean and median (q = 0.041 and 0.033 respectively). Lesions that responded to SRS had lower Ktrans mean and median than those that did not (0.044 vs. 0.093 and 0.032 vs. 0.080 respectively). A pre-SRS Ktrans mean cutoff value of 0.044 was 100% sensitive and 60% specific, with an AUC of 0.78. A pre-SRS Ktrans median cutoff value of 0.029 was 100% sensitive and 67% specific, with an AUC of 0.85 (Figure 3). These findings are summarized in Figure 4. We did not find any significant differences in metrics (Δ) between pre- and early post-SRS images when comparing BM with PD to those without progression (SD, PR, or CR), or when comparing BM that objectively responded (PR or CR) to those with PD or SD. When the differences in metrics (Δ) between pre- and early post-SRS scans for the entire cohort were compared regardless of outcome, WSRT showed statistically significant changes in vp mean (p = 0.009) as well as a trend toward significance in ADC mean and median (p = 0.052 and 0.065 respectively). These findings are summarized in Figure 4. Pre-SRS tumor volume was significant (p = 0.044) for predicting response (CR/PR) versus non-response (PD/SD). A cut off value 2725 mm3 was 82% sensitive and 74% specific with AUC = 0.76. Pre-SRS tumor volume was not significant when comparing PD versus non-PD. Only 2/5 lesions with PD demonstrated an increase in size on follow-up imaging within 3 months of SRS.Conclusion:
Our study demonstrates that multiparametric MRI can demonstrate early (within 72 hours) radiobiological changes within BM treated with SRS. Additionally, quantitative analysis of these biomarkers could predict long-term tumor response.Acknowledgements
No acknowledgement found.References
1. Lemke, A., et al., Differentiation of pancreas carcinoma from healthy pancreatic tissue using multiple b-values: comparison of apparent diffusion coefficient and intravoxel incoherent motion derived parameters. Invest Radiol, 2009. 44(12): p. 769-75.
2. Sigmund, E.E., et al., Intravoxel incoherent motion and diffusion-tensor imaging in renal tissue under hydration and furosemide flow challenges. Radiology, 2012. 263(3): p. 758-69.
3. Law, M., et al., Glioma grading: sensitivity, specificity, and predictive values of perfusion MR imaging and proton MR spectroscopic imaging compared with conventional MR imaging. AJNR Am J Neuroradiol, 2003. 24(10): p. 1989-98.
4. Law, M., et al., Histogram analysis versus region of interest analysis of dynamic susceptibility contrast perfusion MR imaging data in the grading of cerebral gliomas. AJNR Am J Neuroradiol, 2007. 28(4): p. 761-6.
5. Barajas, R.F., Jr., et al., Differentiation of recurrent glioblastoma multiforme from radiation necrosis after external beam radiation therapy with dynamic susceptibility-weighted contrast-enhanced perfusion MR imaging. Radiology, 2009. 253(2): p. 486-96.
6. Matsusue, E., et al., Distinction between glioma progression and post-radiation change by combined physiologic MR imaging. Neuroradiology, 2010. 52(4): p. 297-306.
7. Hatzoglou, Vaios, et al. "Dynamic contrast‐enhanced MRI perfusion for differentiating between melanoma and lung cancer brain metastases." Cancer medicine 6.4 (2017): 761-767.
8. Federau, Christian, et al. "Measuring brain perfusion with intravoxel incoherent motion (IVIM): initial clinical experience." Journal of Magnetic Resonance Imaging 39.3 (2014): 624-632.
9. Paudyal, Ramesh, et al. "Repeatability of quantitative diffusion-weighted imaging metrics in phantoms, head-and-neck and thyroid cancers: preliminary findings." Tomography 5.1 (2019): 15.
10. Paudyal, Ramesh, et al. "Dynamic contrast‐enhanced MRI model selection for predicting tumor aggressiveness in papillary thyroid cancers." NMR in Biomedicine 33.1 (2020): e4166.
11. Lin, Nancy U., et al. "Response assessment criteria for brain metastases: proposal from the RANO group." The lancet oncology 16.6 (2015): e270-e278.
Figures