3665
Qualitative and quantitative comparison between IVIM-DKI and PET/CT imaging in lymphoma1Centre for Biomedical Engineering, Indian Institute of Technology Delhi, New Delhi, India, 2Department of Radiodiagnosis, All India Institute of Medical Sciences Delhi, New Delhi, India, 3Department of Physics, Indian Institute of Technology Delhi, New Delhi, India, 4Department of Medical Oncology, Dr. B.R. Ambedkar Institute-Rotary Cancer Hospital (IRCH), All India Institute of Medical Sciences Delhi, New Delhi, India, 5Department of Nuclear Medicine, All India Institute of Medical Sciences Delhi, New Delhi, India, 6Department of Biomedical Engineering, All India Institute of Medical Sciences Delhi, New Delhi, India
Synopsis
PET/CT plays an important role in diagnosis and assessment of treatment response in lymphoma. The goal of this study was to evaluate the role of IVIM-DKI parameters in comparison to PET parameters in lymphoma. PET images were registered onto IVIM-DKI at b=0s/mm2 images for tumor ROI using 3D-multimodal affine registration. Qualitatively, IVIM parameters with state-of-the-art Total-Variation produced better quality parameter maps. Tumor appeared hyperintense in SUV and K maps and hypointense in diffusion and perfusion parameters. No correlation was observed between IVIM-DKI with PET parameters. IVIM with Total-Variation showed substantial reproducibility as compared to conventional IVIM, DKI and SUV parameters.
Introduction
Fluorodeoxyglucose-Positron Emission Tomography(FDG-PET/CT) is often used in clinical routine to accurately localize, characterize lesion and treatment response with 87% accuracy1,2. It provides information on biochemical activity and anatomy of lesions. But excess glucose uptake becomes difficult to detect lesion and radiation exposure. Thus, Intravoxel incoherent motion(IVIM) and diffusion kurtosis imaging(DKI) can quantify perfusion and diffusion surrounding tissue with extent of homogeneity without radiation exposure3,4. IVIM signal analyzed using biexponential model(BE) to eliminate the perfusion signal contamination at low b-value3. However, at high b-values(>1000s/mm2), the signal is non-Gaussian due to irregularities in tissue structures(tumours). Thus, DKI follows non-Gaussian kurtosis model to obtain Dk(corrected diffusion coefficient) and excess kurtosis(K)4. IVIM-DKI are widely used in cancer detection and treatment management especially in head and neck cancer5. In this study, we will explore role of whole-body IVIM-DKI in comparison to PET parameters in lymphoma.Methods
Patients data acquisition: Five patients with lymphoma (Non-Hodgkin lymphoma(NHL);4: Hodgkin lymphoma(HL);age:38±11 years;M:F=3:2) were recruited and underwent biopsy procedure after the ethical approval of Institutional Ethics Board and written informed consent. The first scan(Scan1) was performed at enrollment time followed by a repeat scans(Scan2) within 8 weeks of chemotherapy initiation.18F-FDG PET/CT acquisition and analysis: PET/CT examinations were performed with a PET/CT scanner(Biograph MCT; Siemens Healthcare, Germany) and Discovery 710(General electric company, USA). Dosage of 6–11 MBq/kg(0.16–0.18 mCi/kg; minimum, 3 mCi) FDG intravenously injected. After the 45–60-minute uptake period, the patients were taken for the PET/CT study. SUVmax(maximum Standard Uptake Value) and SUVmean were calculated from SUV:
$$SUV=r/(a^{'}/w)$$
where, r=radioactivity activity concentration(kBq/ml),a′=decay-corrected amount of injected radiolabeled FDG(kBq), and w=weight of the patient(g).
MR acquisition and analysis: All patients were scanned in 1.5T MRI (Ingenia; Philips Healthcare, Netherlands), with a STIR(Thoracic:TR=1.503s and TE=0.09s; Abdomen:TR=1.503s and TE=0.06s), including IVIM-DKI with 9b-values= 0,35,50,100,175,300,500,1500,2000 s/mm2(Thoracic:TR=12.44s,TE=0.081s; Abdomen:TR=12.44s,TE=0.081s) using phased-array surface coil for thoracic and abdominal area. All parameters were estimated using Non-linear least square optimization-based IVIM-DKI model with in-house toolbox using MATLAB. ADC was calculated voxelwise using monoexponential model. IVIM parameters such as D, D*, and f were evaluated using two methods i) BE model3 and ii) BE with Total variation penalty function (TV)6–8. BE model defined below3:
$$S⁄S_0=fe^{-bD^*}+(1-f)e^{-bD}$$
where S and S0 are diffusion signals with and without diffusion gradient b in s/mm2. DKI parameters such as Dk and k were analyzed using DKI model4:
$$S⁄S_0=e^{-bD_k+b^2D_k^2K/6}$$
Registration of MRI and PET images: Imregister from Image registration toolbox in MATLAB was used to perform 3D multimodal registration of DWI image at b= 0s/mm2 onto PET image using spatial referencing information like voxel sizes.
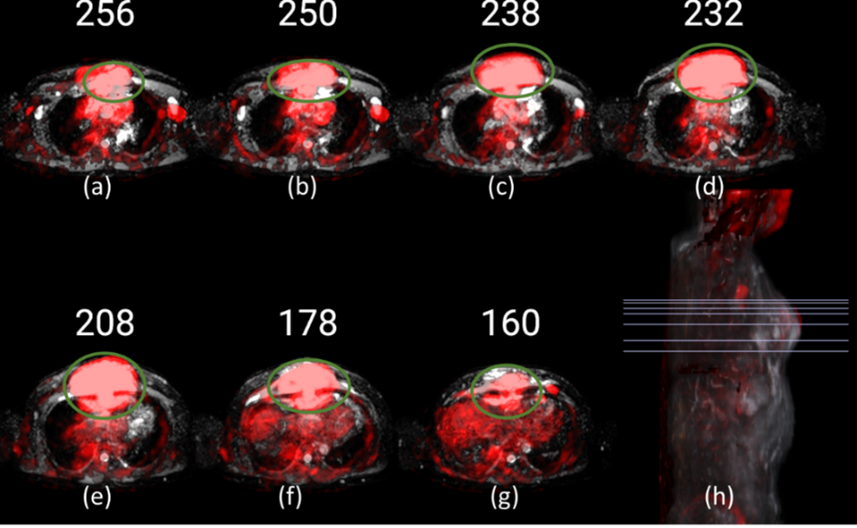
ROI localization: Image DWI at b=2000 s/mm2(hyperintense), ADC map(hypointense) and PET-SUV maps(hyperintense) were used to localize tumour as shown in figure1.
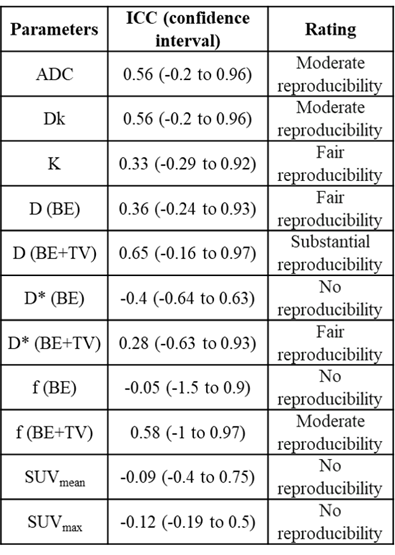
Statistics: Spearman correlation was performed between IVIM-DKI and PET parameters. Bland-Alman (BA) plot was plotted using bias and limit of agreement(LOA)9. Intraclass correlation coefficient(ICC) was calculated using the two-way random single measures(ICC(2,1) ranges 0.00–1.00 where 1.00 represents better reproducibility) and interpretation of ICC was labelled using Landis-Koch method10.
Results
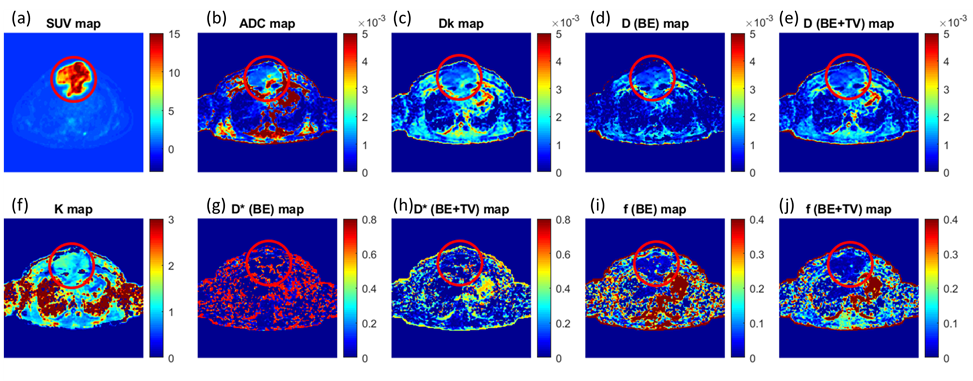
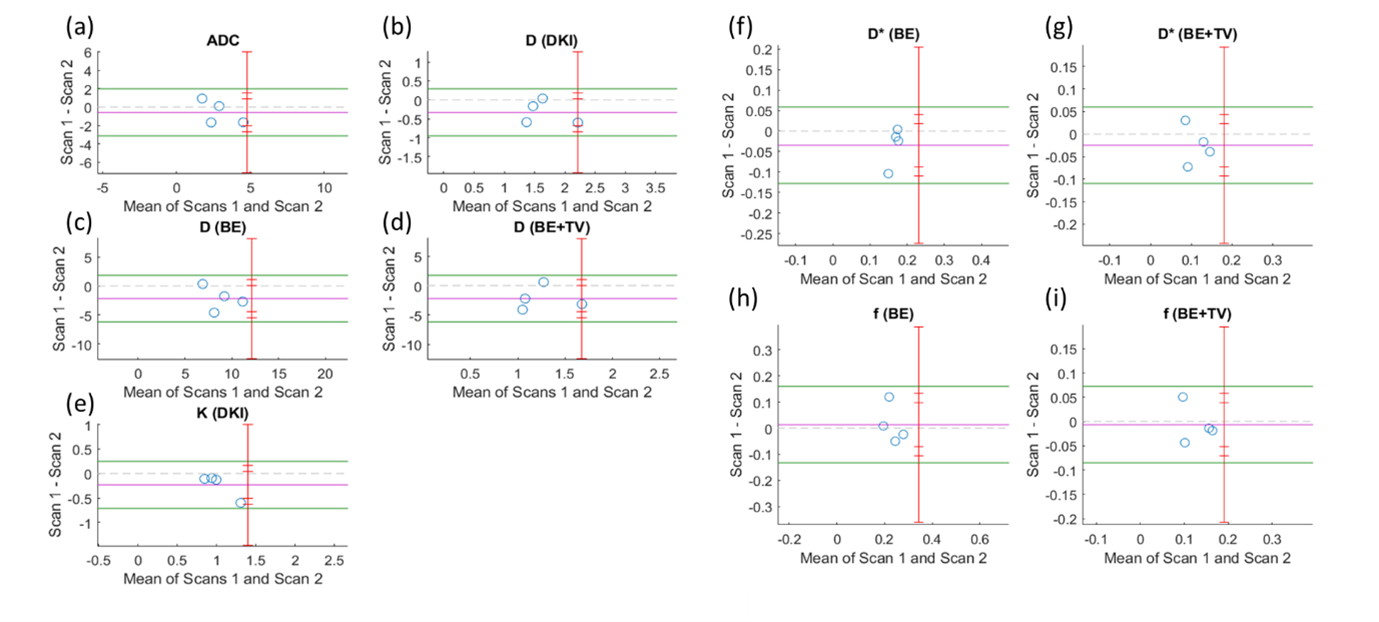
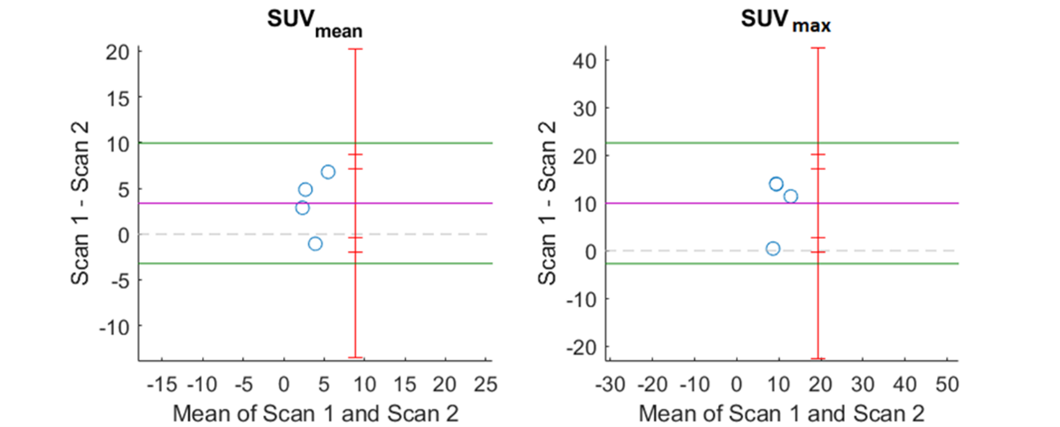
Qualitative assessment of IVIM-DKI and PET parameters: As shown in figure2, tumour region is hyperintense in SUV and in K map and whereas hypointense in ADC, Dk, diffusion coefficient, and perfusion parameters obtained using BE and BE+TV. Parameter maps obtained using BE model showed noisy map and BE+TV shows uniformity in tumour region with removal non-physiological inhomogeneity in parameter map as shown in figure2(e,h and j).Quantitative assessment of IVIM and DKI parameters with PET parameters: No correlations were observed between IVIM, DKI with PET parameters(p>0.05). Figure3(a-i) shows BA plot of IVIM and DKI parameters to access the scan reproducibility. For ADC, f(BE and BE+TV), bias line was near to equality line. Figure4(a-b) shows BA plot of PET parameters where bias line of SUVmean and SUVmax far from equality line indicating low reproducibility. Figure5 shows ICC single measure values of all parameters with D (BE+TV) showed highest ICC with 0.65 i.e., substantial reproducibility.
Discussion
PET/CT is widely used imaging modality for lymphoma diagnosis and its management. Repeated PET scans can increase radiation exposure, this may cause complication in patients. Thus, non-invasive IVIM-DKI was used as it simultaneously measures perfusion and diffusion around tissue. IVIM signal analyzed using BE model but produces non-physiological inhomogeneity. This can be corrected by parametric reconstruction method such as TV incorporated into BE model. In this study, we compared IVIM and DKI with PET parameters. Qualitatively, SUV map showed hyperintense in tumor region due to high cell proliferation rate and same was observed in K map due to increase in tissue inhomogeneity. Hypointense region in diffusion and perfusion parameters was observed due to densely packed tissues with low perfusion. Quantitatively, there were no correlation between them, similar results were obtained from previous studies11,12; however, this could be limitation because of the small cohort size. D parameter obtained from BE+TV model showed substantial reproducibility as compared to other IVIM-DKI parameters. Good scan reproducibility was observed for IVIM parameters obtained from BE+TV. PET parameters showed poor reproducibility which can be improved using large patient data.Conclusion
IVIM parameters with BE+TV model produced substantial reproducibility with better quality parameter maps. Correlation between IVIM-DKI and PET parameters need to be evaluated further on a large dataset.Acknowledgements
This study was supported by IIT Delhi and AIIMS Delhi. AVM was supported by research fellowship fund from the Ministry of Human Resource Development, Government of India.References
1. Ben-Haim, S. & Ell, P. 18F-FDG PET and PET/CT in the evaluation of cancer treatment response. Journal of Nuclear Medicine 2009;50, 88–99.
2. Wu, R. et al. Assessment of chemotherapy response in non-Hodgkin lymphoma involving the neck utilizing diffusion kurtosis imaging: a preliminary study. Diagnostic Interv. Radiol. 2017;23, 245–249. 3. Le Bihan, D. et al. Separation of diffusion and perfusion in intravoxel incoherent motion MR imaging. Radiology 1988;168, 497–505.
4. Jensen, J. H. & Helpern, J. A. MRI quantification of non-Gaussian water diffusion by kurtosis analysis. NMR in Biomedicine 2010;23, 698–710.
5. Hauser, T. et al. Prediction of treatment response in head and neck carcinomas using IVIM-DWI: Evaluation of lymph node metastasis. Eur. J. Radiol. 2014;83, 783–787.
6. Kayal, E. B., Kandasamy, D., Khare, K et al. Quantitative Analysis of Intravoxel Incoherent Motion (IVIM) Diffusion MRI using Total Variation and Huber Penalty Function. Med. Phys. 2017;44, 5849–5858.
7. Kayal, E. B., Kandasamy, D., Khare, K et al. Intravoxel incoherent motion (IVIM) for response assessment in patients with osteosarcoma undergoing neoadjuvant chemotherapy. Eur. J. Radiol. 2019;119, 108635.
8. Malagi, A. V., Das, C. J., Khare, K. et al. Effect of combination and number of b values in IVIM analysis with post-processing methodology: simulation and clinical study. Magn. Reson. Mater. Physics, Biol. Med. 2019;32, 519–527. 9. Bland, J. M. & Altman, D. G. Measuring agreement in method comparison studies. Stat. Methods Med. Res. 1999;8, 135–160.
10. Landis, J. R. & Koch, G. G. The measurement of observer agreement for categorical data. Biometrics 1977;159–174.
11. Choi, S. H. et al. Correlation of 18F-FDG uptake with apparent diffusion coefficient ratio measured on standard and high b value diffusion MRI in head and neck cancer. J. Nucl. Med. 52, 2011;1056–1062.
12. Varoquaux, A. et al. Functional imaging of head and neck squamous cell carcinoma with diffusion-weighted MRI and FDG PET/CT: quantitative analysis of ADC and SUV. Eur. J. Nucl. Med. Mol. Imaging 2013;40, 842–852.
Figures