3663
Non-gaussian IVIM DW-and fast exchange regime DCE- MRI for predicting of locoregional failure in nasopharyngeal carcinoma
Ramesh Paudyal1, Linda Chen2, Jung Hun Oh1, Kaveh Zakeri2, Vaios Hatzoglou3, Chiaojung Jillian Tsai2, Nancy Lee2, and Amita Shukla-Dave1,3
1Medical Physics, Memorial Sloan Kettering Cancer Center, New York, NY, United States, 2Radiation Oncology, Memorial Sloan Kettering Cancer Center, New York, NY, United States, 3Radiology, Memorial Sloan Kettering Cancer Center, New York, NY, United States
1Medical Physics, Memorial Sloan Kettering Cancer Center, New York, NY, United States, 2Radiation Oncology, Memorial Sloan Kettering Cancer Center, New York, NY, United States, 3Radiology, Memorial Sloan Kettering Cancer Center, New York, NY, United States
Synopsis
The study aims to assess quantitative imaging (QI) metrics from pre-treatment (TX) non-gaussian intravoxel incoherent DW- and fast exchange regime (FXR) DCE-MRI for predicting locoregional failure (LRF) in nasopharyngeal carcinoma (NPC) patients. Cumulative incidence analysis (CIA) was performed on the two subgroups dichotomized with Youden’s index. Competing-risks regression based on Fine and Gray’s (FG) proportional sub hazards model was used to estimate survival subdistribution hazard ratios (SHRs). The pre-TX ADC, D, f, and ti cutoff values from CIA analysis and K cutoff value from the competing risk regression analysis indicated these QI’s could predict the LRF in NPC patients.
Purpose
Nasopharyngeal carcinoma (NPC) has been linked to Epstein-Barr virus (EBV)1. The current standard of care for locally-advanced NPC is definitive chemoradiation therapy (chemo-RT)2. Due to deep anatomic tumor location and proximity to critical tissue structures, treatment is still associated with toxicities1. Therefore, identification of quantitative imaging (QI) metrics that predict the optimal chemo-RT dosage prior to treatment would greatly benefit NPC patients. The pre-treatment (TX) apparent diffusion coefficient (ADC) skewness value is a predictor of locoregional failure (LRF) in NPC3. DCE-MRI-derived QI metrics correlate with clinical stage of NPC4. The fast exchange regime (FXR) model volume transfer constant Ktrans has exhibited promise at pre-TX for predicting chemo-RT in HN cancer5. A previous study reported that the combination of Ktrans and ADC metrics were superior to either separately in detecting early-stage NPC accurately6. The aim of the present study was to identify whether the QI metrics from pre-TX NG IVIM DW- and FXR DCE-MRI can predict patients with LRF in NPC.Materials and Methods
Patient: Our institutional review board approved this retrospective study, and written informed consent was obtained from all eligible NPC patients prior to the pre-TX MRI study. Between June 2014 and September 2016, a total of 29 NPC patients (median age: 43 years, range: 21-67 years; 20 M/9 F) were enrolled, all were treated with chemoradiation therapy (standard dose 70Gy). The clinical response was based on standard-of-care imaging and clinical follow-up after treatment completion up to 33 months. Treating physicians categorized the patients into two groups, with (n=6) and without (n=23) locoregional failure (LRF).DWI and DCE data acquisition: MRI protocol consisted of multi-planar T1/T2 weighted imaging followed by multiple b-value DWI on a 3.0T scanner (Ingenia, Philips Healthcare, Netherlands) using a neurovascular phased-array coil as detailed in Paudyal et al.7. T1w DCE-MRI were acquired using a fast 3D Spoiled Gradient Recalled sequence as detailed elsewhere8.
DW- and DCE-MRI data analysis: ADC was calculated from mono-exponential, and (b) true diffusion (D), pseudo diffusion (D*), diffusion kurtosis (K) coefficients, and perfusion fraction (f) from NG-IVIM model9,10 were estimated by fitting all multiple b- value data. The longitudinal relaxation rate, R1 (R1=1/T1), with time derived from the FXR model yields the following QI metrics: Ktrans, extravascular extracellular volume fraction [EES], ve, and the mean lifetime of intracellular water molecules τi, a marker of cellular metabolic activity11. Regions of interest (ROIs) were delineated on the primary tumor by radiation oncologists on the multiple b- value DW image (b = 0 s/mm2) and late phase of T1w DCE images using ImageJ software12. All image processing was performed using in-house software MRI-QAMPER (MRI Quantitative Analysis of Multi-Parametric Evaluation Routines)8,13.
Statistical analysis: Wilcoxon rank-sum test was performed to assess the differences in QI values between the groups. Cumulative incidence analysis (CIA) was performed on the two groups, dichotomized with Youden’s index14. Competing-risks regression, based on Fine and Gray’s (FG) proportional sub hazards model, was used to estimate subdistribution hazard ratios (SHRs) and their adjusted 95% confidence intervals (CIs) were calculated. A p-value <0.05 was considered statistically significant. Statistical analysis was performed using R15.
Results
The mean pre-TX tumor volume was not significantly different between patients with and without LRF of NPC (P>0.05). Representative pre-TX ADC, D, f, and K maps display the tumor cellularity, vascularity, and microstructure integrity, respectively, in patients with (n=6) and without LRF (n=22) (Figure 1). The mean f showed borderline-significant difference between the groups (P=0.08). The mean ve value was significantly higher in patients without LRF than those with LRF (P=0.03). Ktrans and ti values were leaning towards a significant difference between two groups (P=0.14 for Ktrans and P=0.11 for ti). Representative pre-TX maps of Ktrans, ve, and τi are displayed in Figure 2 for two groups. The regions with alternating high and low values of Ktrans and τi can be seen. D and Ktrans histograms tend to show sharper peaks in patients who experienced LRF compared to those without LRF. K and τi histograms showed the longer tail towards higher values with LRF than those without LRF (Figure 3). QI metrics from DW- and DCE-MRI analyses are given in Table 1. The results from the CIA and FG proportional sub-hazards model are listed in Table 2. Gary’s test showed a significant difference between dichotomized ADC, D, and f values (P<0.05). K showed a significant difference (P=0.034), whereas τi showed a borderline significant trend (0.07) with the FG proportional sub-hazards model analysis. Figure 4 displays the predicted CIA analysis curves for the two groups.Discussion and Conclusion
QI metrics values indicate different tumor cell density, microstructure integrity, permeability, and cell metabolic activity between patients with and without LRF in NPC. Representative parametric maps and voxel distribution (%) histogram plots of QI metrics revealed tumor heterogeneity between the two groups. CIA analysis demonstrated that the pre-TX ADC, D, and τi could be the a priori predictors of LRF in NPC patients.After appropriate validation in a larger NPC population, these findings may be useful for adaptive radiotherapy.
Acknowledgements
NIH U01 CA211205 and NIH/NCI Cancer Center Support Grant P30 CA008748References
1. Kamran SC, Riaz N, Lee N. Nasopharyngeal carcinoma. Surg Oncol Clin N Am. 2015;24(3):547-561. 2. Lee AW, Ma BB, Ng WT, Chan AT. Management of Nasopharyngeal Carcinoma: Current Practice and Future Perspective. Journal of clinical oncology : official journal of the American Society of Clinical Oncology. 2015;33(29):3356-3364. 3. Law BK, King AD, Bhatia KS, et al. Diffusion-Weighted Imaging of Nasopharyngeal Carcinoma: Can Pretreatment DWI Predict Local Failure Based on Long-Term Outcome? AJNR American journal of neuroradiology. 2016;37(9):1706-1712. 4. Zheng DC, Chen YB, Chen Y, et al. Dynamic Contrast-Enhanced MRI of Nasopharyngeal Carcinoma: A Preliminary Study of the Correlations Between Quantitative Parameters and Clinical Stage. Journal of Magnetic Resonance Imaging. 2014;39(4):940-948. 5. Kim S, Loevner LA, Quon H, et al. Prediction of response to chemoradiation therapy in squamous cell carcinomas of the head and neck using dynamic contrast-enhanced MR imaging. AJNR American journal of neuroradiology. 2010;31(2):262-268. 6. Ni LP, Liu Y. Contrast-enhanced dynamic and diffusion-weighted magnetic resonance imaging at 3.0 T to assess early-stage nasopharyngeal carcinoma. Oncol Lett. 2018;15(4):5294-5300. 7. Paudyal R, Oh JH, Riaz N, et al. Intravoxel incoherent motion diffusion-weighted MRI during chemoradiation therapy to characterize and monitor treatment response in human papillomavirus head and neck squamous cell carcinoma. J Magn Reson Imaging. 2017;45(4):1013-1023. 8. LoCastro E, Paudyal R, Mazaheri Y, et al. Computational Modeling of Interstitial Fluid Pressure and Velocity in Head and Neck Cancer Based on Dynamic Contrast-Enhanced Magnetic Resonance Imaging: Feasibility Analysis. Tomography. 2020;6(2):129-138. 9. Le Bihan D, Breton E, Lallemand D, Grenier P, Cabanis E, Laval-Jeantet M. MR imaging of intravoxel incoherent motions: application to diffusion and perfusion in neurologic disorders. Radiology. 1986;161(2):401-407. 10. Lu Y, Jansen JF, Mazaheri Y, Stambuk HE, Koutcher JA, Shukla-Dave A. Extension of the intravoxel incoherent motion model to non-gaussian diffusion in head and neck cancer. J Magn Reson Imaging. 2012;36(5):1088-1096. 11. Nath K, Pickup S, Lee S, Cai K, Popatani H, Glickson J. Assessment of chemotherapy in a mouse model of non-Hodgkin's lymphoma using Dynamic contrast-enhanced and diffusion weighted MRI. Paper presented at: Proc. Intl. Soc. Mag. Reson. Med. 2013. 12. ImageJ [computer program]. Bethesda, Maryland, USA: U. S. National Institutes of Health; 1997-2016. 13. Paudyal R, Konar AS, Obuchowski NA, et al. Repeatability of Quantitative Diffusion-Weighted Imaging Metrics in Phantoms, Head-and-Neck and Thyroid Cancers: Preliminary Findings. Tomography : a journal for imaging research. 2019;5(1):15-25. 14. Youden WJ. Index for rating diagnostic tests. Cancer. 1950;3(1):32-35. 15. R: A language and environment for statistical computing. R Foundation for Statistical Computing [computer program]. Vienna, Austria: R Foundation for Statistical Computing; 2020.Figures
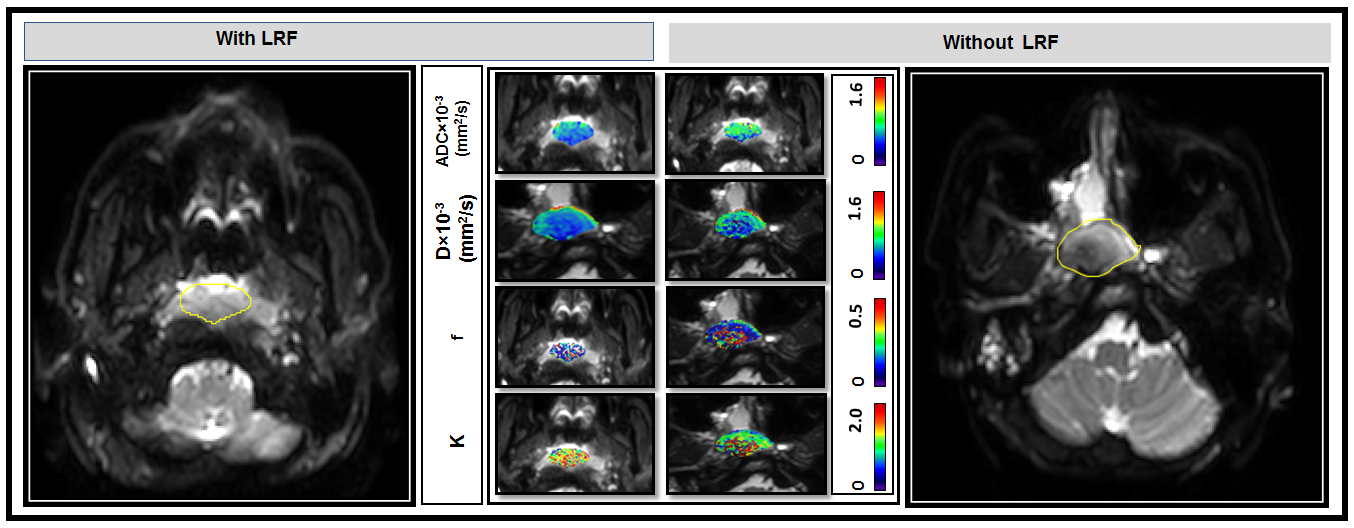
Figure 1. Representative pre-treatment (TX)
diffusion-weighted images (b=0 s/mm2) and parametric maps of
apparent diffusion coefficient, ADC, true diffusion coefficient, D, perfusion
fraction, f, and Kurtosis coefficient, K, in patients with (48 years, male) and
without LRF (55 years, male) of NPC (Left and Right). Primary tumor parametric
maps are overlaid on pre-TX DW images (b=0 s/mm2).
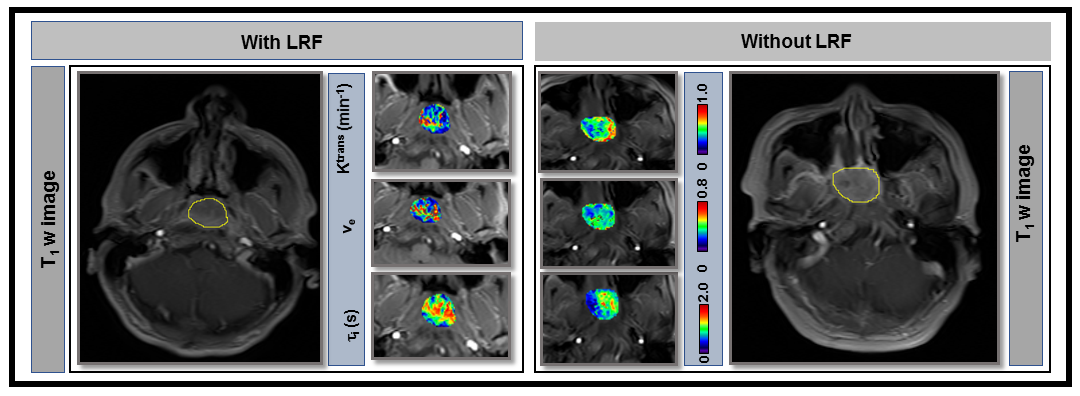
Figure 2.
Representative pre-treatment (TX) T1 w images from the late phase of
dynamic series from patients with (67 years, female) and without locoregional
failure (LRF) (55 years, male) of nasopharyngeal cancer (Left and Right).
Primary tumors parametric maps of Ktrans (min-1), ve,
and τi (sec) overlaid
on pre-TX T1w images
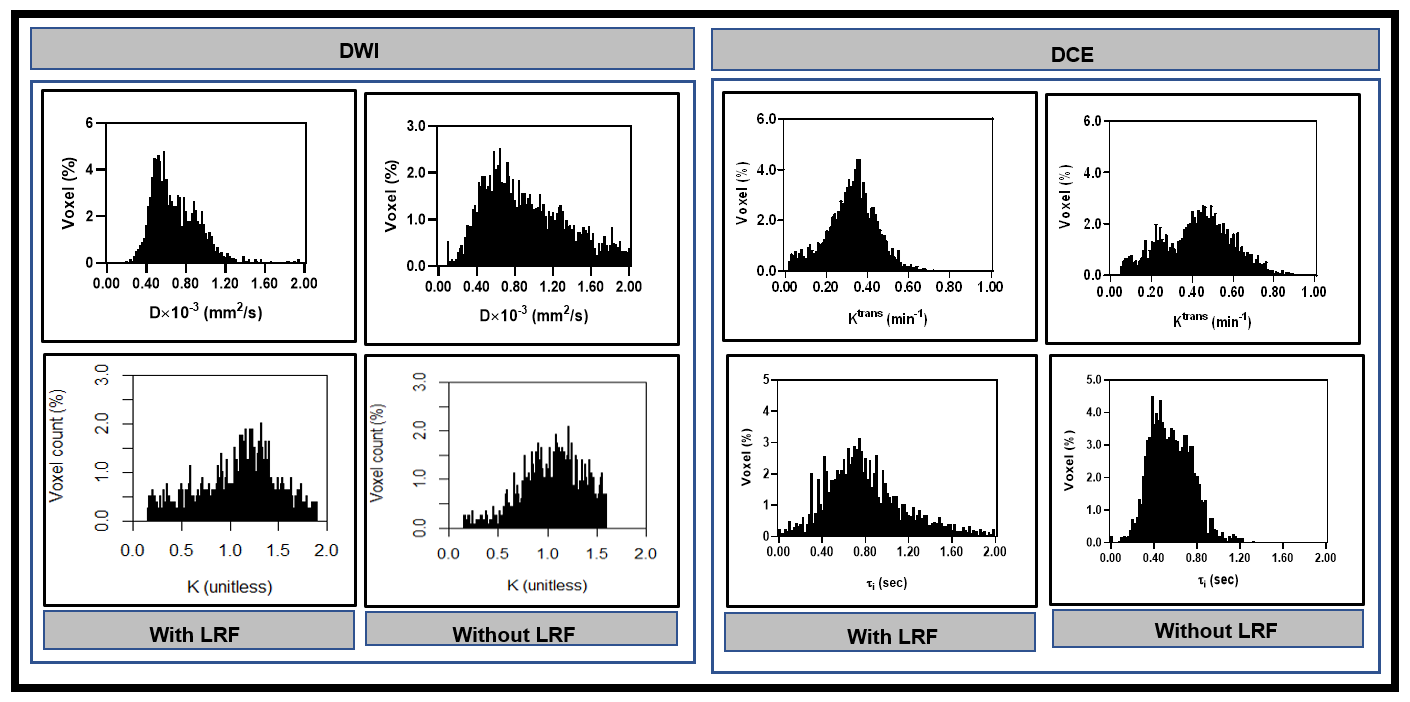
Figure 3. Left:
Representative histogram plot of true diffusion coefficient, D, and kurtosis
coefficient, K), in patients with and without LRF of nasopharyngeal cancer
(Figure 2). D values spread out towards higher in a patient without LRF than
compared to with LRF. In contrast, K values spread to a higher value in a
patient with LRF than without LRF. Right: Ktrans values spread out
towards higher in a patient without LRF as compared to with LRF. In contrast, τi values spread to
higher in a patient with LRF as compared without LRF.
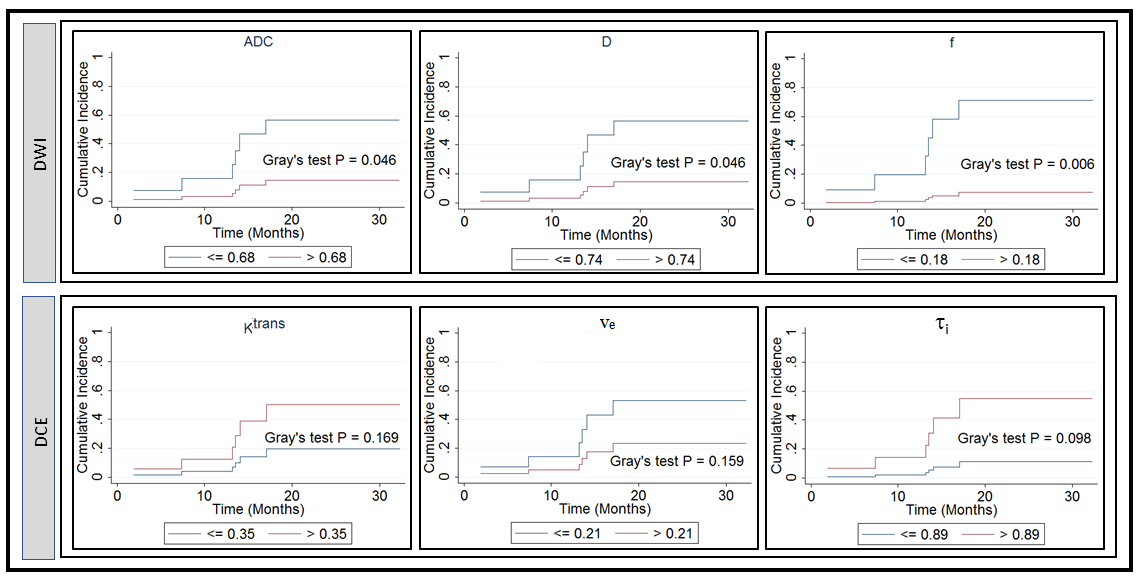
Figure 4. Cumulative
incidence analysis for pretreatment apparent diffusion coefficient, ADC (mm2/s),
true diffusion coefficient, D (mm2/s), perfusion fraction, f, volume transfer
constant, Ktrans (min-1), the volume fraction of
extravascular extracellular, ve, and mean lifetime of intracellular
water protons, τi (sec). Gray’s
test revealed a significant difference for ADC, D, and f (P <0.05), and a
borderline significance for τi (sec) (P=0.098).
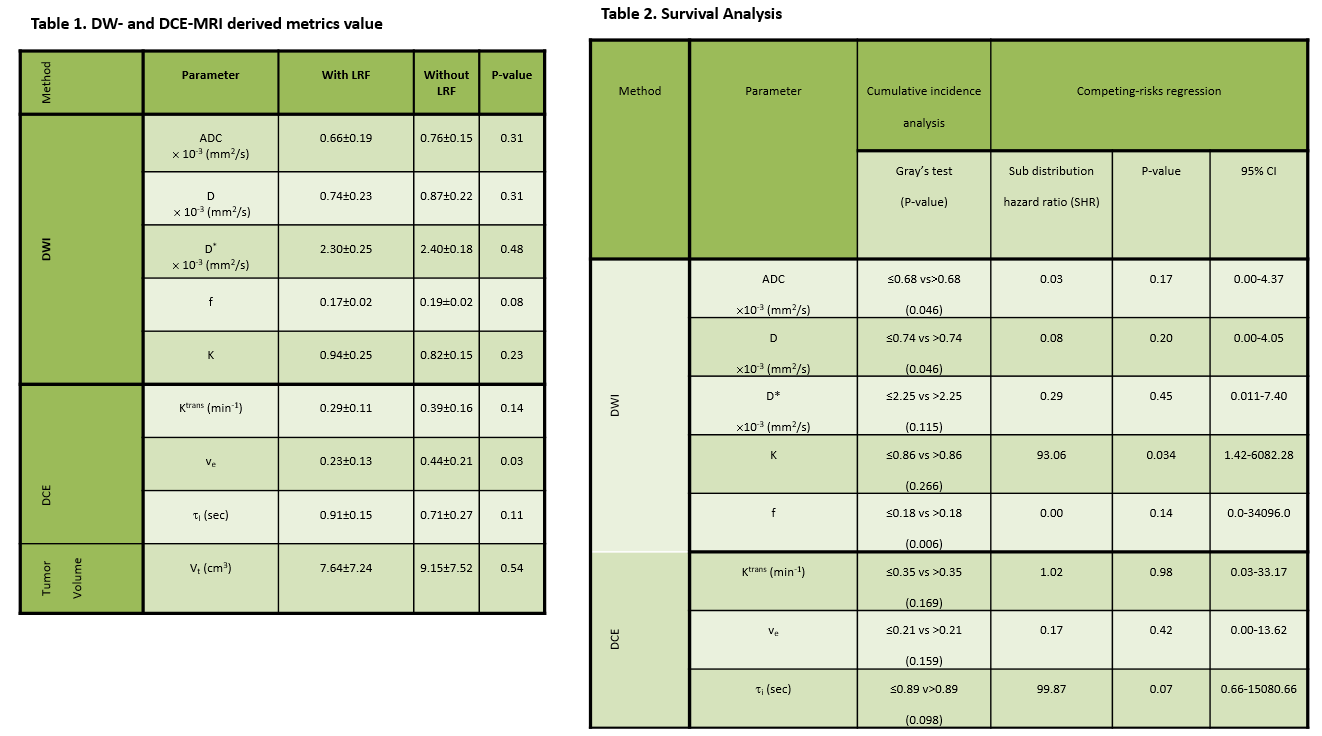
Table 1 and 2