3658
Developing a multi-parametric model of response based on biomarkers derived from Whole-Body Diffusion Weighted Imaging1The Institute of Cancer Research, London, United Kingdom, 2IEO, European Institute of Oncology IRCCS, Milan, Italy, 3Mint Medical, Heidelberg, Germany, 4The Royal Marsden NHS Foundation Trust, London, United Kingdom
Synopsis
We develop a model of treatment response in patients with advanced prostate cancer (APC), based on measurements of median Apparent Diffusion Coefficient (ADC) and tumour Diffusion Volume (tDV) derived using Whole-Body Diffusion Weighted Imaging (WBDWI) and blood biomarkers. The model showed that change in ADC is positively correlated with response in this patient population. Furthermore, our model predicted response with an accuracy of 87%, and sensitivity/specificity of 75/93% using a probability cut-off of 0.5.
Background
Approximately 20% of patients with prostate cancer will be diagnosed with late-stage disease (advanced prostate cancer, APC), the skeleton being the primary site of metastatic spread. APC is associated with poor patient outcome and a high risk of bone fracture and spinal cord compression [1]. Novel cancer drugs have been developed and successfully translated into clinical practice where they appear to be beneficial for patients with APC [2]. However, assessment of response to treatment is still not possible using conventional imaging; CT and bone scans demonstrate low sensitivity in tracking the progress of metastatic bone disease over time [3].Whole-Body Diffusion Weighted Image (WBDWI) can detect malignant bone lesions with high sensitivity [4]. Through recent developments in automatic contouring of disease, it also provides measurement of the total disease volume (tDV) and the global Apparent Diffusion Coefficient (gADC), a surrogate of bone cellularity [5]. The combination of tDV and ADC changes following treatment may prove to be a robust multi-parametric response biomarker assay for APC [6], [7].
Purpose
To develop a multi-parametric model of response in patients with APC based on quantitative estimates of median ADC and tDV derived from WBDWI combined with blood-based biomarkers.Methods
Patient populationA cohort of 41 patients with APC was analysed; all patients underwent WBDWI scans before starting targeted treatment. The average time between the baseline and post-treatment WBDWI scan was 15 weeks (range = 8 – 26 weeks). Patients were treated with Docetaxel (N=15), Abiraterone (11), Enzalutamide (7), Cabazitaxel (4) and Radium (4).
Image acquisition
WBDWI images were acquired using a 1.5T scanner (Siemens Aera, Erlangen, Germany) over 4-5 stations from skull to mid-thigh using b-values 50, 600 and 900 . Each station consisted of 40 slices with a slice thickness of 5mm. Echo-planar image acquisition was used (parallel image acceleration R=2), using a double-spin echo diffusion encoding scheme applied over three orthogonal encoding directions. Other parameters included echo time (TE) = 69ms, repetition time (TR) = 6000-18000ms, matrix size = 128x104, pixel spacing = 1.68x1.68, receive bandwidth = 1955 Hz/pixel and STIR fat suppression with an inversion time (T1) of 180ms.
Statistical modelling
A logistic regression (LR) model was used to derive the probability of response of patients with APC. An experienced radiologist with 1 year experience in WBDWI performed manual delineation of metastatic bone lesions on WBDWI across the cohort. The whole-body ROIs were transferred on ADC map to derive changes in median global ADC (𝛥gADC) and tDV (𝛥tDV) after treatment. To define ground truth, a second experienced radiologist with 10+ years of experience in WBDWI classified patients as responders/non-responders based on all available clinical data.
Maximum-likelihood model fitting provided log-ratio coefficients $$$(\beta_{i})$$$, and predicted probability of response was estimated using the LR equation
$$p_{resp} = \frac{1}{1+e^{-\beta_0 - \sum_i\beta_ix_i}}$$
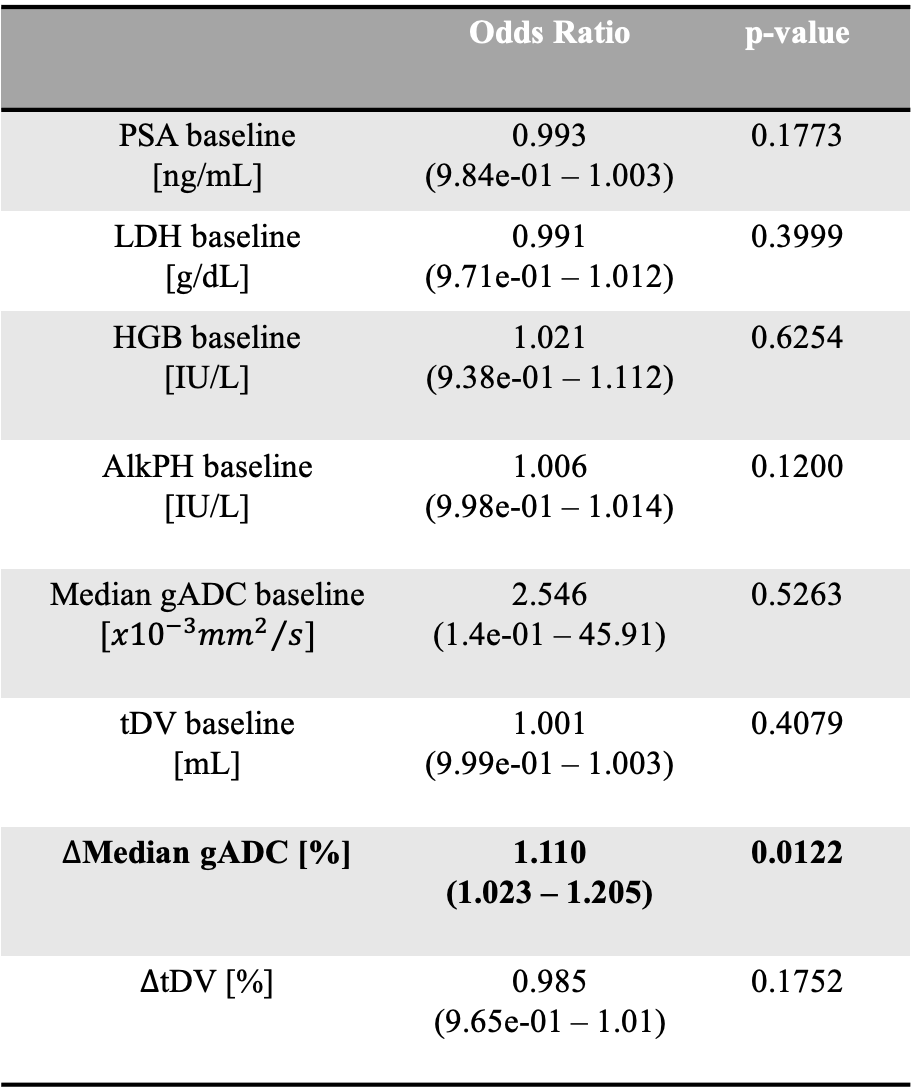
where $$$x_i$$$ represent each of the biomarkers considered (Table 1). A p-value of 0.05 or less was taken to indicate statistical significance.
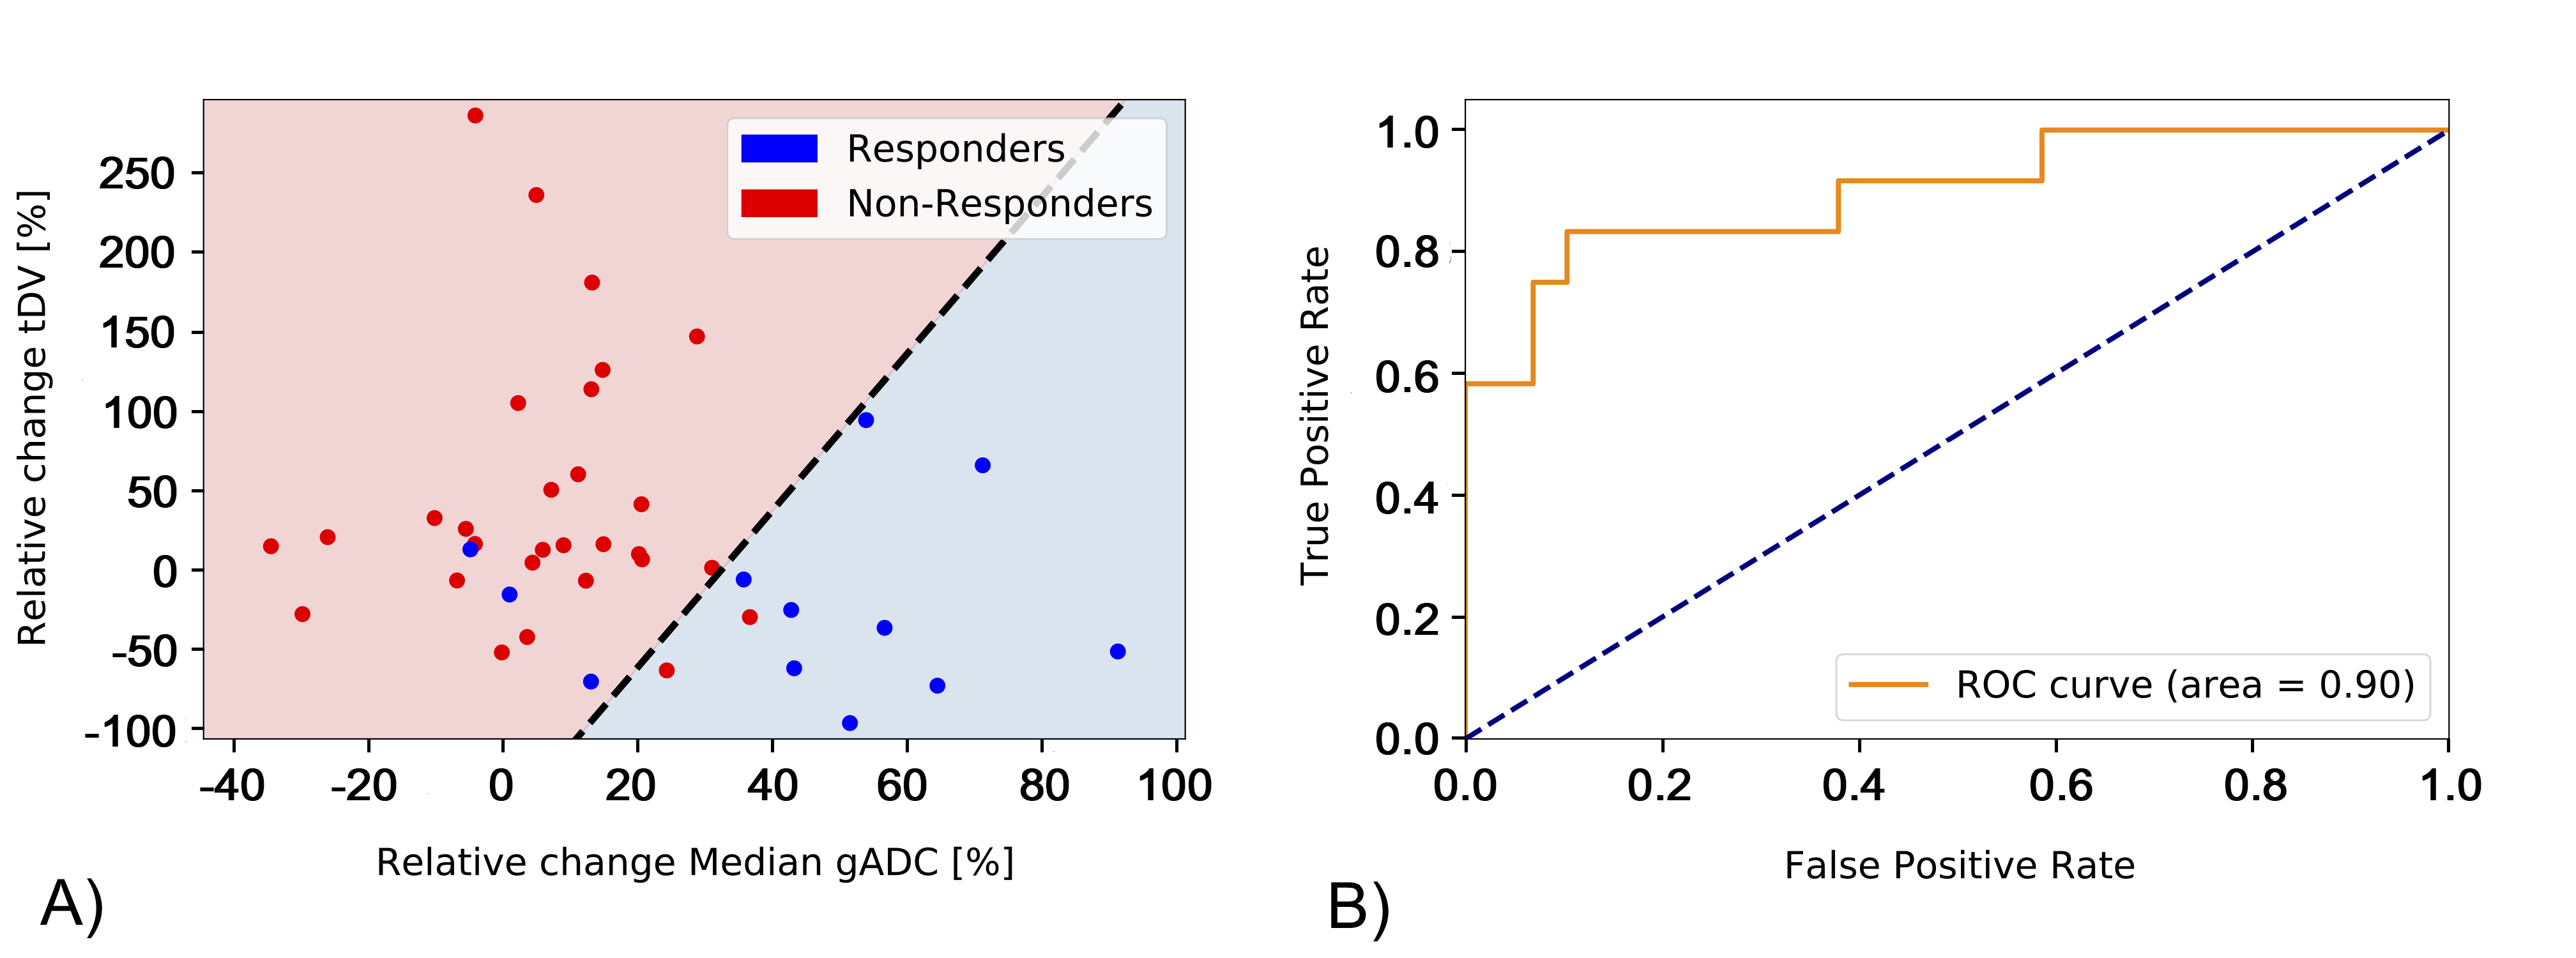
From the derived response probability model, a binary classifier was investigated using a probability cut-off of 0.5 or more representing response. ROC analysis was used to investigate the accuracy of this classifier.
Results
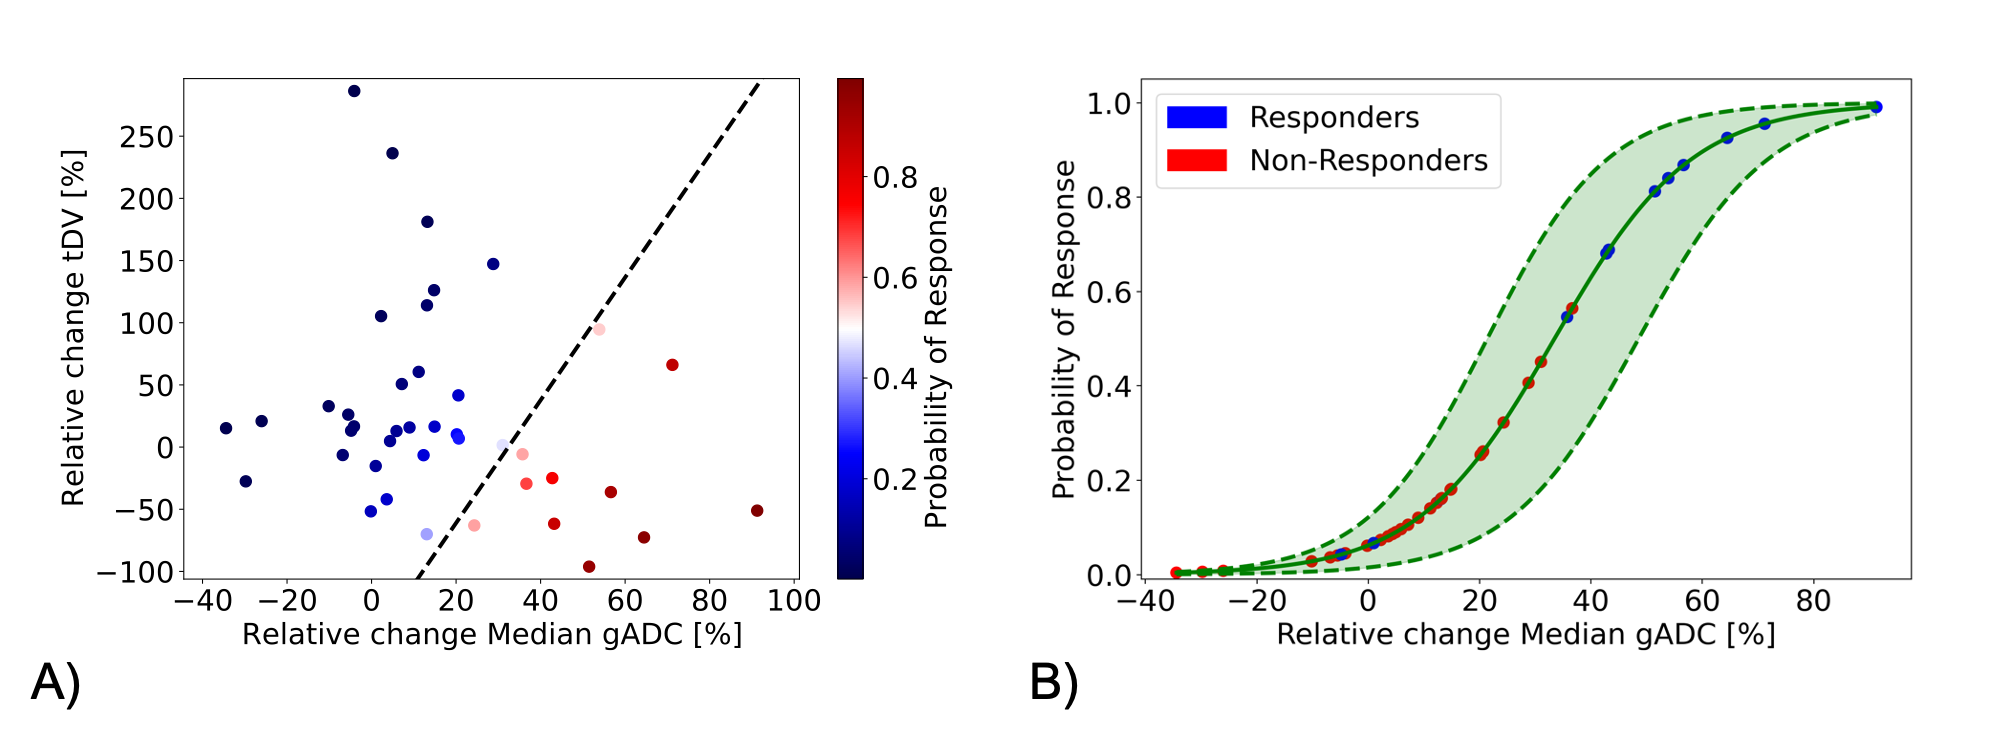
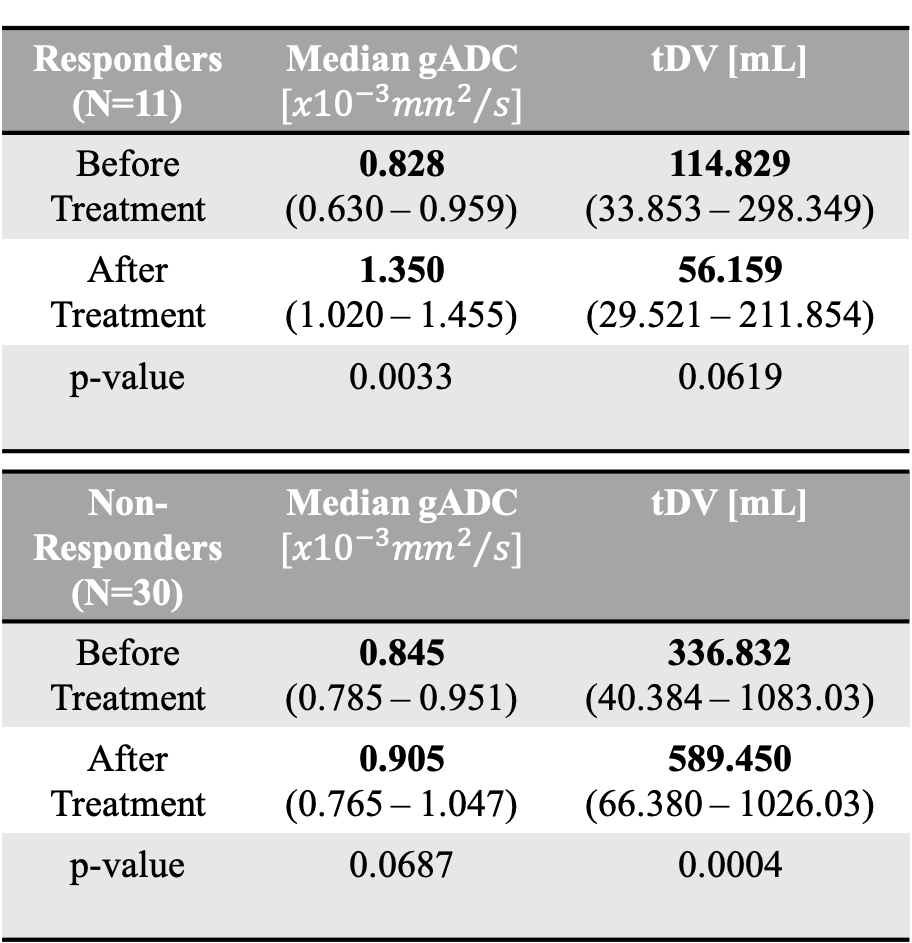
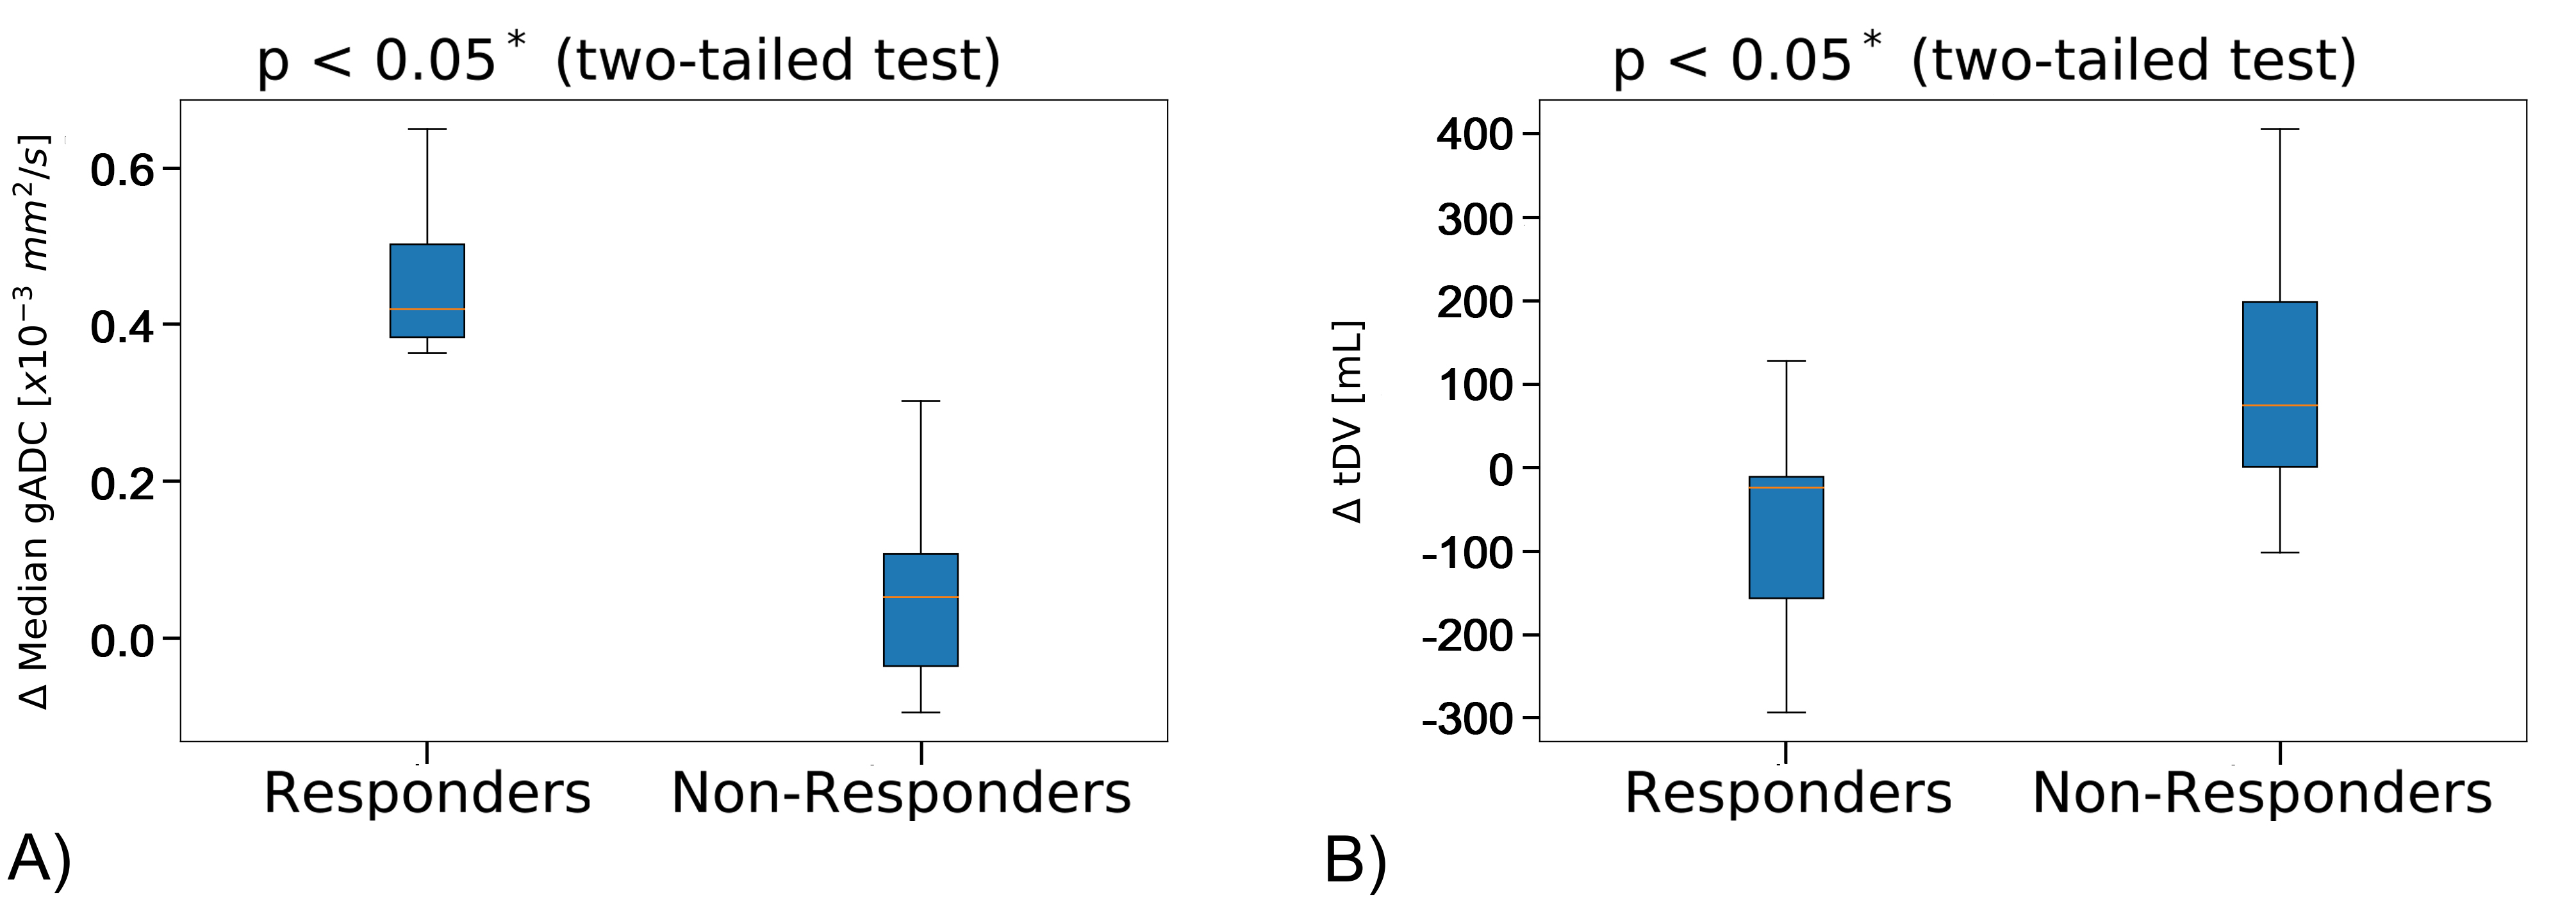
The odds ratio derived after fitting the logistic regression are reported in Table 1. The odds ratio (OR) for the relative change of Median gADC were 1.110 (1.023, 1.205), p-value = 0.0122, demonstrating a statistically significant correlation in identifying responders from non-responders (Figure 1). Our binary model was able to predict response with an accuracy of 0.878, with sensitivity and specificity of 0.75 and 0.93 respectively. ROC analysis demonstrated an area under the curve (AUC) of 0.9 (Figure 2).Changes in median gADC and tDV were compared for responders/non-responders, as shown in Table 2 and Figure 3. Responding patients demonstrated a significant increase in ADC after treatment (from 0.828 to 1.350 $$$x10^{-3}mm^2/s$$$, p-value = 0.0033).
Discussion
Our results indicate that quantitative measures derived from WBDWI show high sensitivity for assessing response in patients with APC. In particular, a change in median ADC showed significance in identifying response in this patient cohort, independent of blood-based biomarkers. Further improvements to our model would include relative changes in blood-based biomarkers, yet our results indicate that changes in median ADC might be exploited as a complementary index by clinicians to improve the prognosis of patients with APC.Acknowledgements
The authors would like to acknowledge Mint Medical®; Invention for Innovation, Advanced computer diagnostics for whole body magnetic resonance imaging to improve management of patients with metastatic bone cancer II-LA-0216-20007; and NIHR Clinical Research Facilities and Biomedical Research Centre at the Royal Marsden Hospital and Institute of Cancer Research.References
[1] R. E. Coleman, Roodman, Smith, Body, Suva, and Vessella, “Clinical features of metastatic bone disease and risk of skeletal morbidity,” Clin. Cancer Res., vol. 12, no. 20 PART 2, pp. 6243–6250, 2006.
[2] J. J. Body, S. Casimiro, and L. Costa, “Targeting bone metastases in prostate cancer: improving clinical outcome,” Nat. Rev. Urol., vol. 12, no. 6, pp. 340–356, 2015.
[3] G. Shen, H. Deng, S. Hu, and Z. Jia, “Comparison of choline-PET/CT, MRI, SPECT, and bone scintigraphy in the diagnosis of bone metastases in patients with prostate cancer: a meta-analysis,” Skeletal Radiol., vol. 43, no. 11, pp. 1503–1513, 2014.
[4] A. R. Padhani, D. M. Koh, and D. J. Collins, “Whole-body diffusion-weighted MR imaging in cancer: Current status and research directions,” Radiology, vol. 261, no. 3, pp. 700–718, 2011.
[5] D. M. Koh et al., “Whole-body diffusion-weighted mri: Tips, tricks, and pitfalls,” Am. J. Roentgenol., vol. 199, no. 2, pp. 252–262, 2012.
[6] M. D. Blackledge et al., “Assessment of treatment response by total tumor volume and global apparent diffusion coefficient using diffusion-weighted MRI in patients with metastatic bone disease: A feasibility study,” PLoS One, vol. 9, no. 4, pp. 1–8, 2014.
[7] R. Perez-Lopez et al., “Diffusion-weighted imaging as a treatment response biomarker for evaluating bone metastases in prostate cancer: A pilot study,” Radiology, vol. 283, no. 1, pp. 168–177, 2017.
Figures