3655
Cerebrospinal Fluid Partial Volume Effects in Microscopic Fractional Anisotropy Imaging1Medical Biophysics, Western University, London, ON, Canada, 2Centre for Functional and Metabolic Mapping, Robarts Research Institute, London, ON, Canada
Synopsis
Microscopic fractional anisotropy (μFA) quantifies diffusion anisotropy independent of fiber orientation, giving it high specificity to microstructure. However, it is underestimated in brain regions containing cerebrospinal fluid (CSF) partial volumes. Here, we investigated two methods to reduce CSF partial volume effects: the free-water elimination method and a shifted kurtosis method. Compared to diffusion tensor imaging and diffusion kurtosis imaging, these techniques produced more accurate diffusivity estimates in simulations and higher μFA estimates in brain tissue. This preliminary work demonstrates the potential for CSF-suppressing techniques to improve μFA estimation in regions where CSF partial volume effects are prevalent.
Introduction
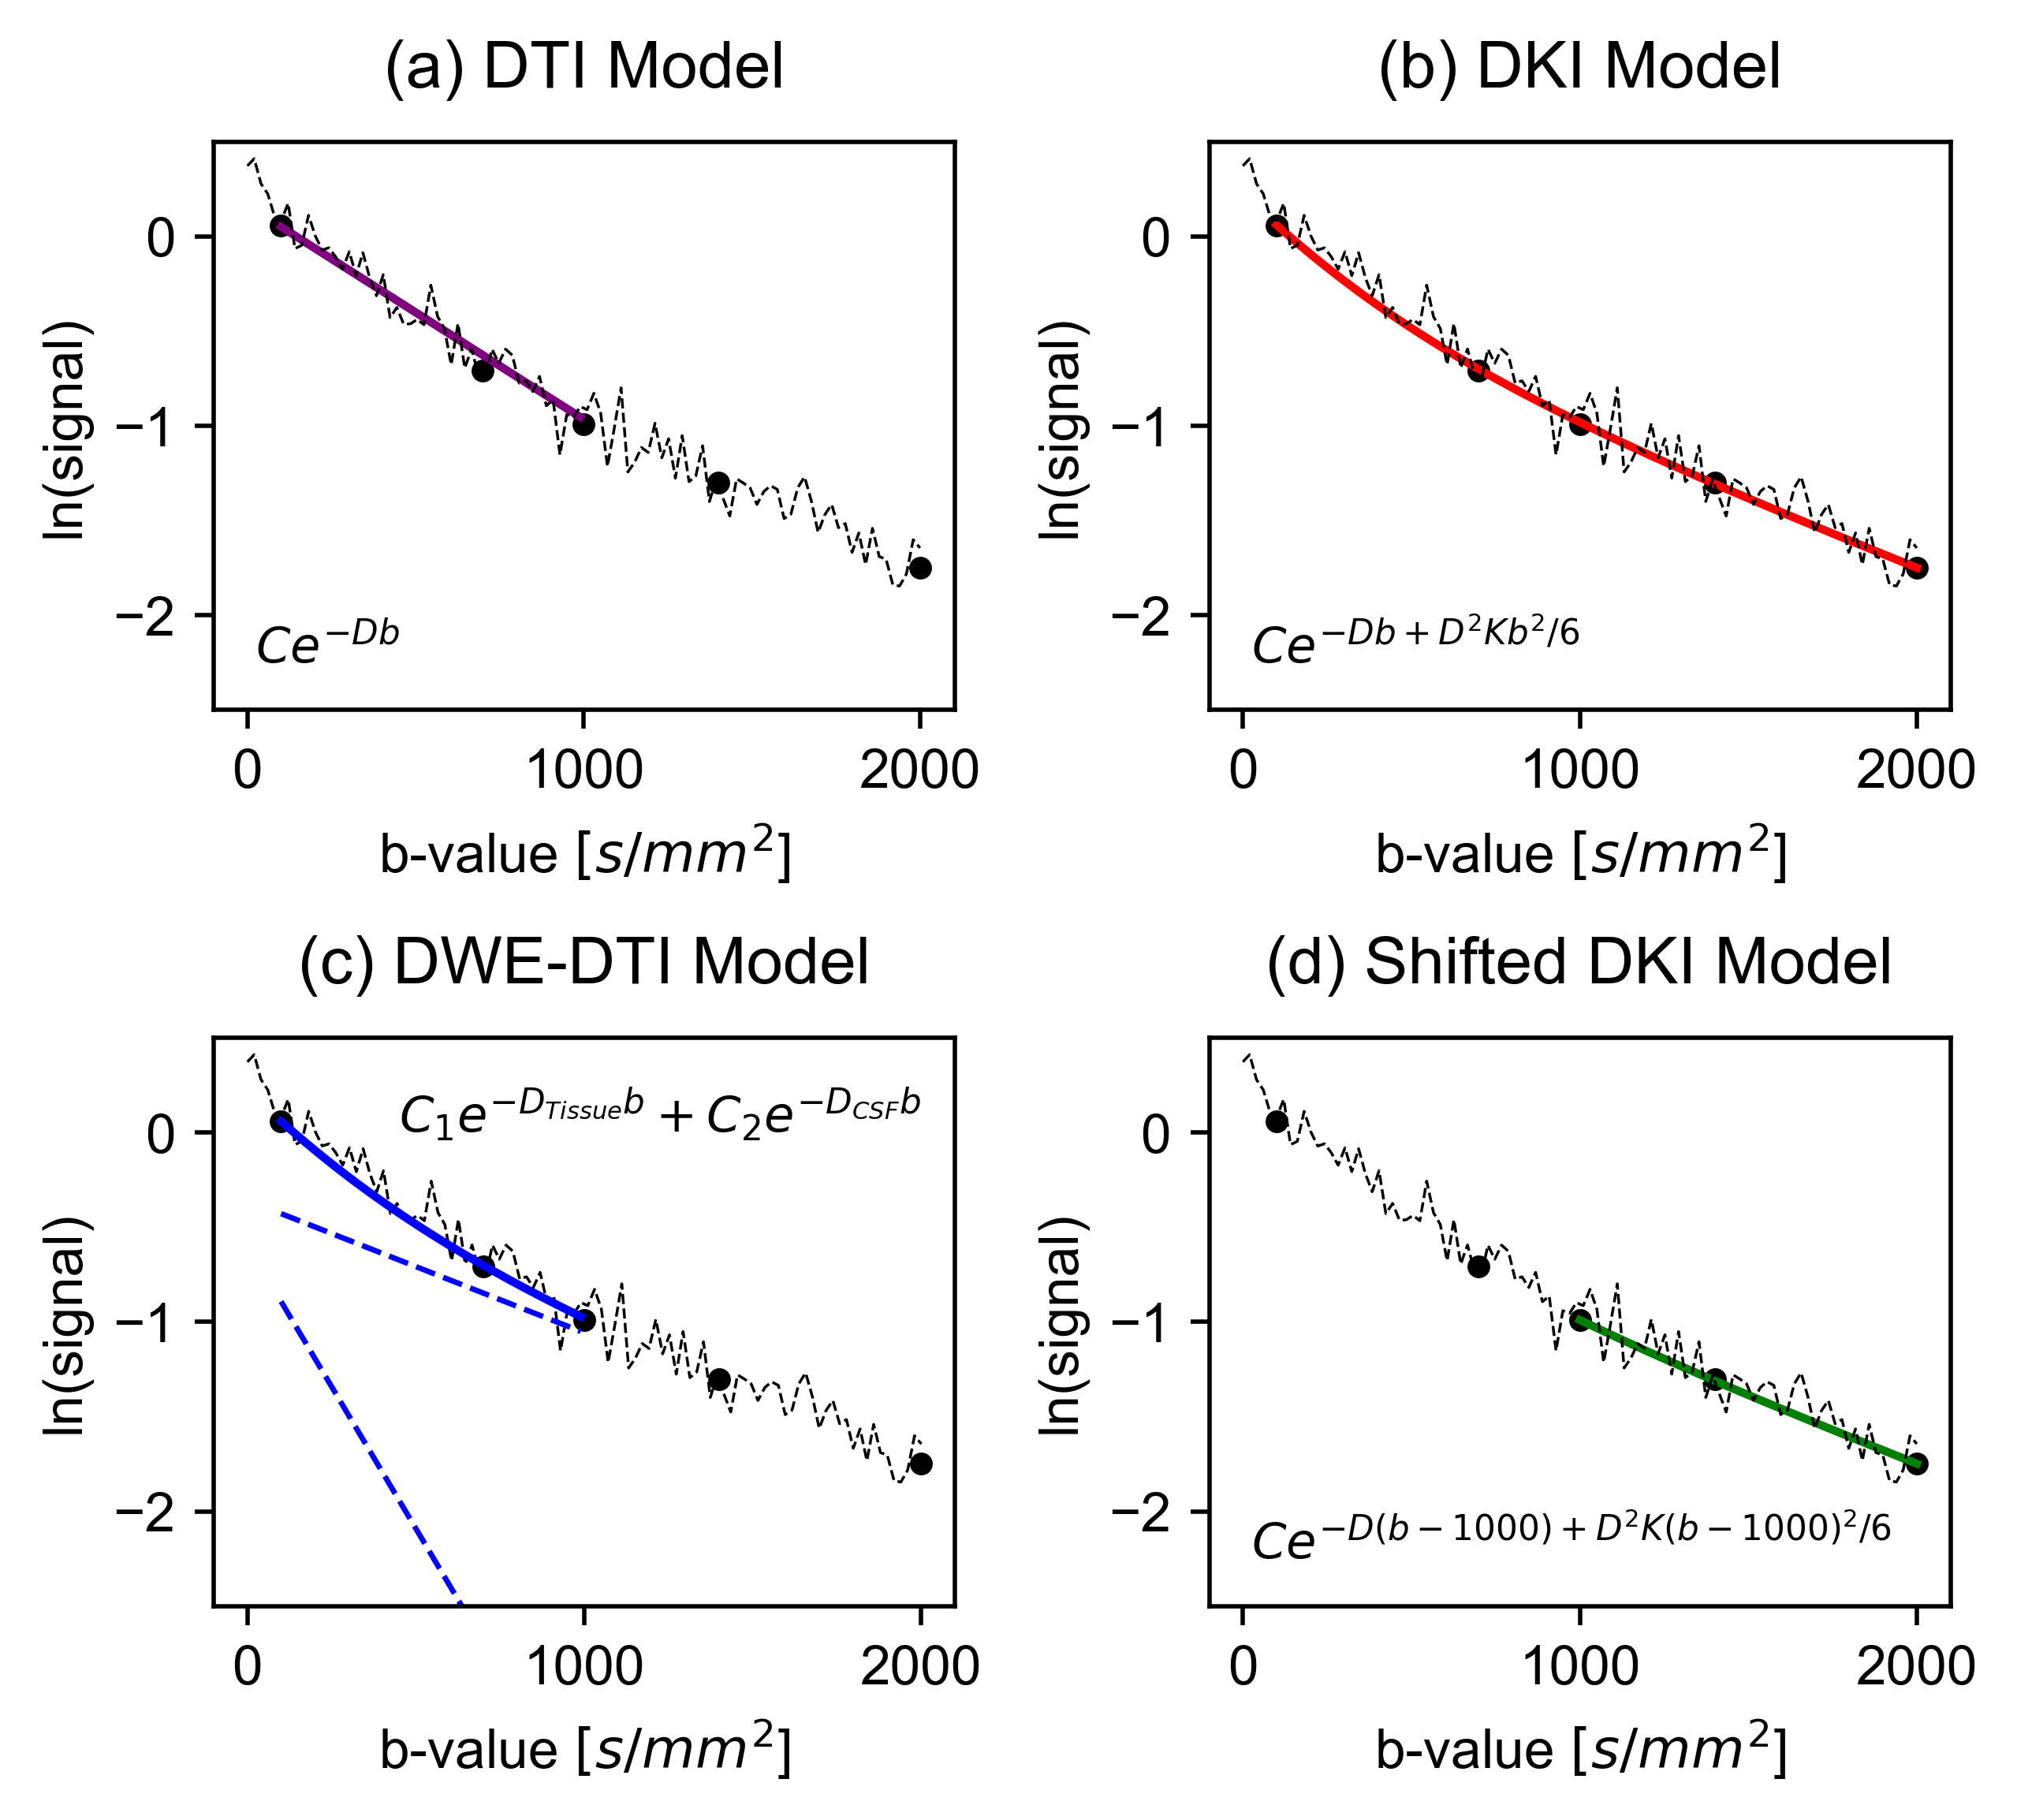
Microscopic fractional anisotropy (μFA) estimates water diffusion anisotropy independent of fiber orientation dispersion, giving it high specificity to microstructural changes. 1 However, μFA is susceptible to cerebrospinal fluid partial volume effects (CSF-PVEs) that can lead to it being underestimated in regions adjacent to CSF. Here, we investigate two techniques to reduce CSF-PVEs in μFA imaging, shown in Fig.1. Both exploit the fact that the non-normalized microscopic anisotropy (μA) depends only on the highest b-shell and is thus negligibly affected by CSF-PVEs; thus mean diffusivity (MD) is the only metric affected by CSF contamination when μFA is estimated via the direct cumulant method: 2$$(1)\qquad\qquad\ \mu FA=\sqrt{\frac{3}{2}\frac{\mu A^2}{\mu A^2+0.2D^2 }}$$μA2 is given by:$$(2)\qquad\qquad\ \mu A^2 = b^{-2}ln(\frac{S_{LTE}}{S_{STE}})$$where SSTE is the average of spherical tensor encoding (STE) acquisitions at a single high b-value (i.e. ~2000s/mm2), and SLTE is the average of linear tensor encoding (LTE) averages at the same b-value.The first technique employs the free-water elimination diffusion tensor imaging (FWE-DTI) technique to estimate D for tissue (DTissue) separately from CSF (DCSF). 3 The second fits the diffusion kurtosis imaging (DKI) model to dMRI signal with a non-zero minimum b-value to attenuate rapidly-diffusing CSF signal. 4 Both techniques are assumed to utilize STE acquisitions to remove the directional dependence of acquisitions.
Methods
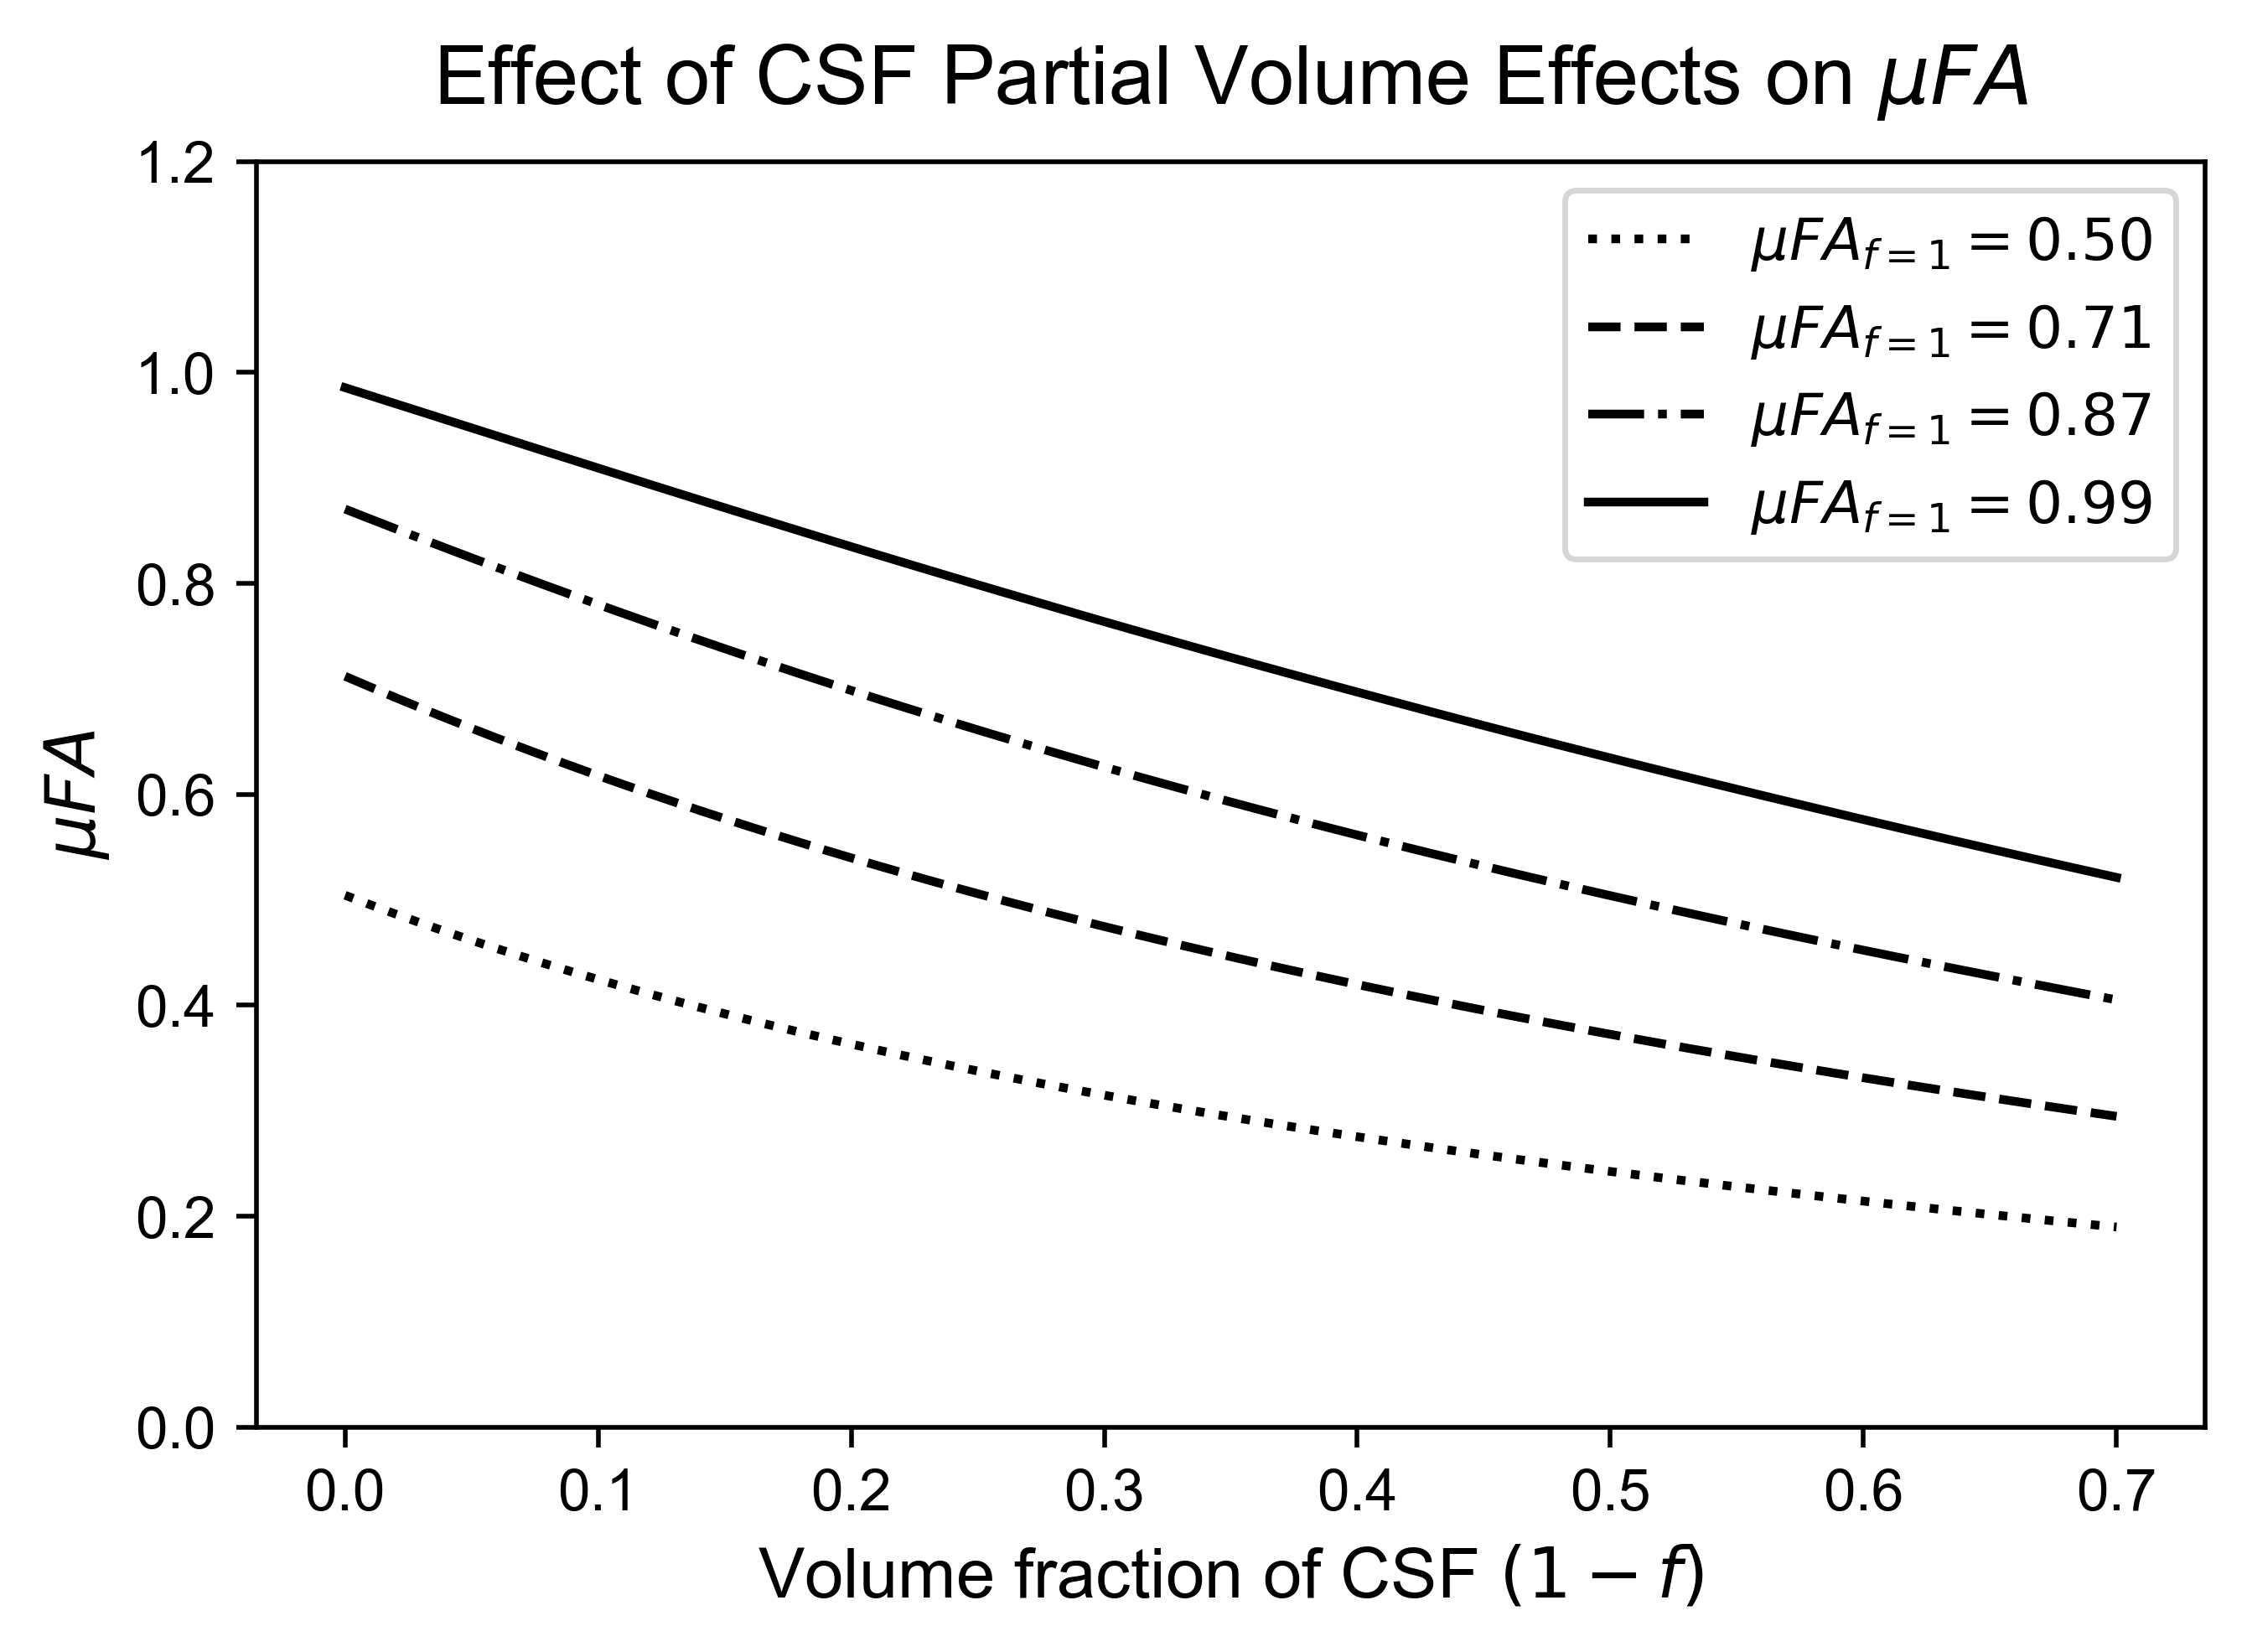
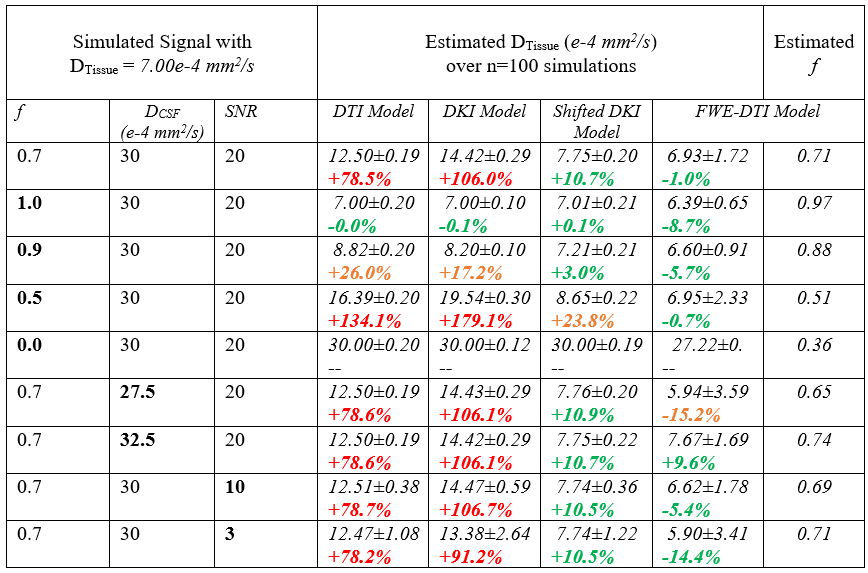
To estimate the effects of CSF-PVEs on μFA, STE signals were simulated using the FWE-DTI model, with tissue volume fractions from 0.3 to 1:$$(3)\qquad\qquad\ \frac{S_{b}}{S_{0}}=f\frac{1}{R+1}e^{-D_{Tissue}b}+(1-f)\frac{R}{R+1}e^{-D_{CSF}b}$$where S is the signal, f is the tissue volume fraction, and R is the ratio of CSF signal to tissue signal when no diffusion weighting is present (estimated to be 1.85). 4 DTissue and DCSF were assumed to be 7e-4mm2/s and 3e-3mm2/s, respectively, based on in vivo measurements. Note that kurtosis was omitted in the simulations as it is typically negligible in STE in healthy brain tissue. 5 D was estimated using diffusion tensor imaging (DTI), 6 and μFA was calculated via Eq.1 (Fig.2).To test the CSF-suppressing models, dMRI signals were simulated across 5 b-values (100, 700, 1000, 1400, and 2000 s/mm2) using Eq.3 with noise added to achieve the desired SNR. Various parameters were toggled in 9 configurations, summarized in Table 1, and each was simulated 100 times. To estimate the DTissue, the simulated signals were fitted to four models (Fig.1.): DTI, DKI, FWE-DTI assuming DCSF=3e-3mm2/s, and a shifted DKI model described as follows:$$(4)\qquad\qquad\ \frac{S_{b}}{S_{0}}=e^{D(b-1000)+\frac{D^2K(b-1000)^2}{6}}$$where K is the kurtosis. The DKI model used b-values from 100-2000s/mm2, the DTI and FWE-DTI models used 100-1000s/mm2, and the shifted DKI model used 1000-2000s/mm2. Additionally, one healthy volunteer was scanned (female, 23), abiding by ethics board guidelines, to acquire 6, 6, 10, 10, and 16 STE acquisitions at b=100, 700, 1000, 1400, and 2000s/mm2, respectively (matching the simulations), and 6 linear tensor encoding directions at b=2000s/mm2. Other parameters were TE/TR=94/4500ms, resolution=2x2x2mm3, and R=2GRAPPA. Single-slice diffusivity maps were generated using the four models and b-value schema above, and were used to compute μFA using Eq.1.
Results
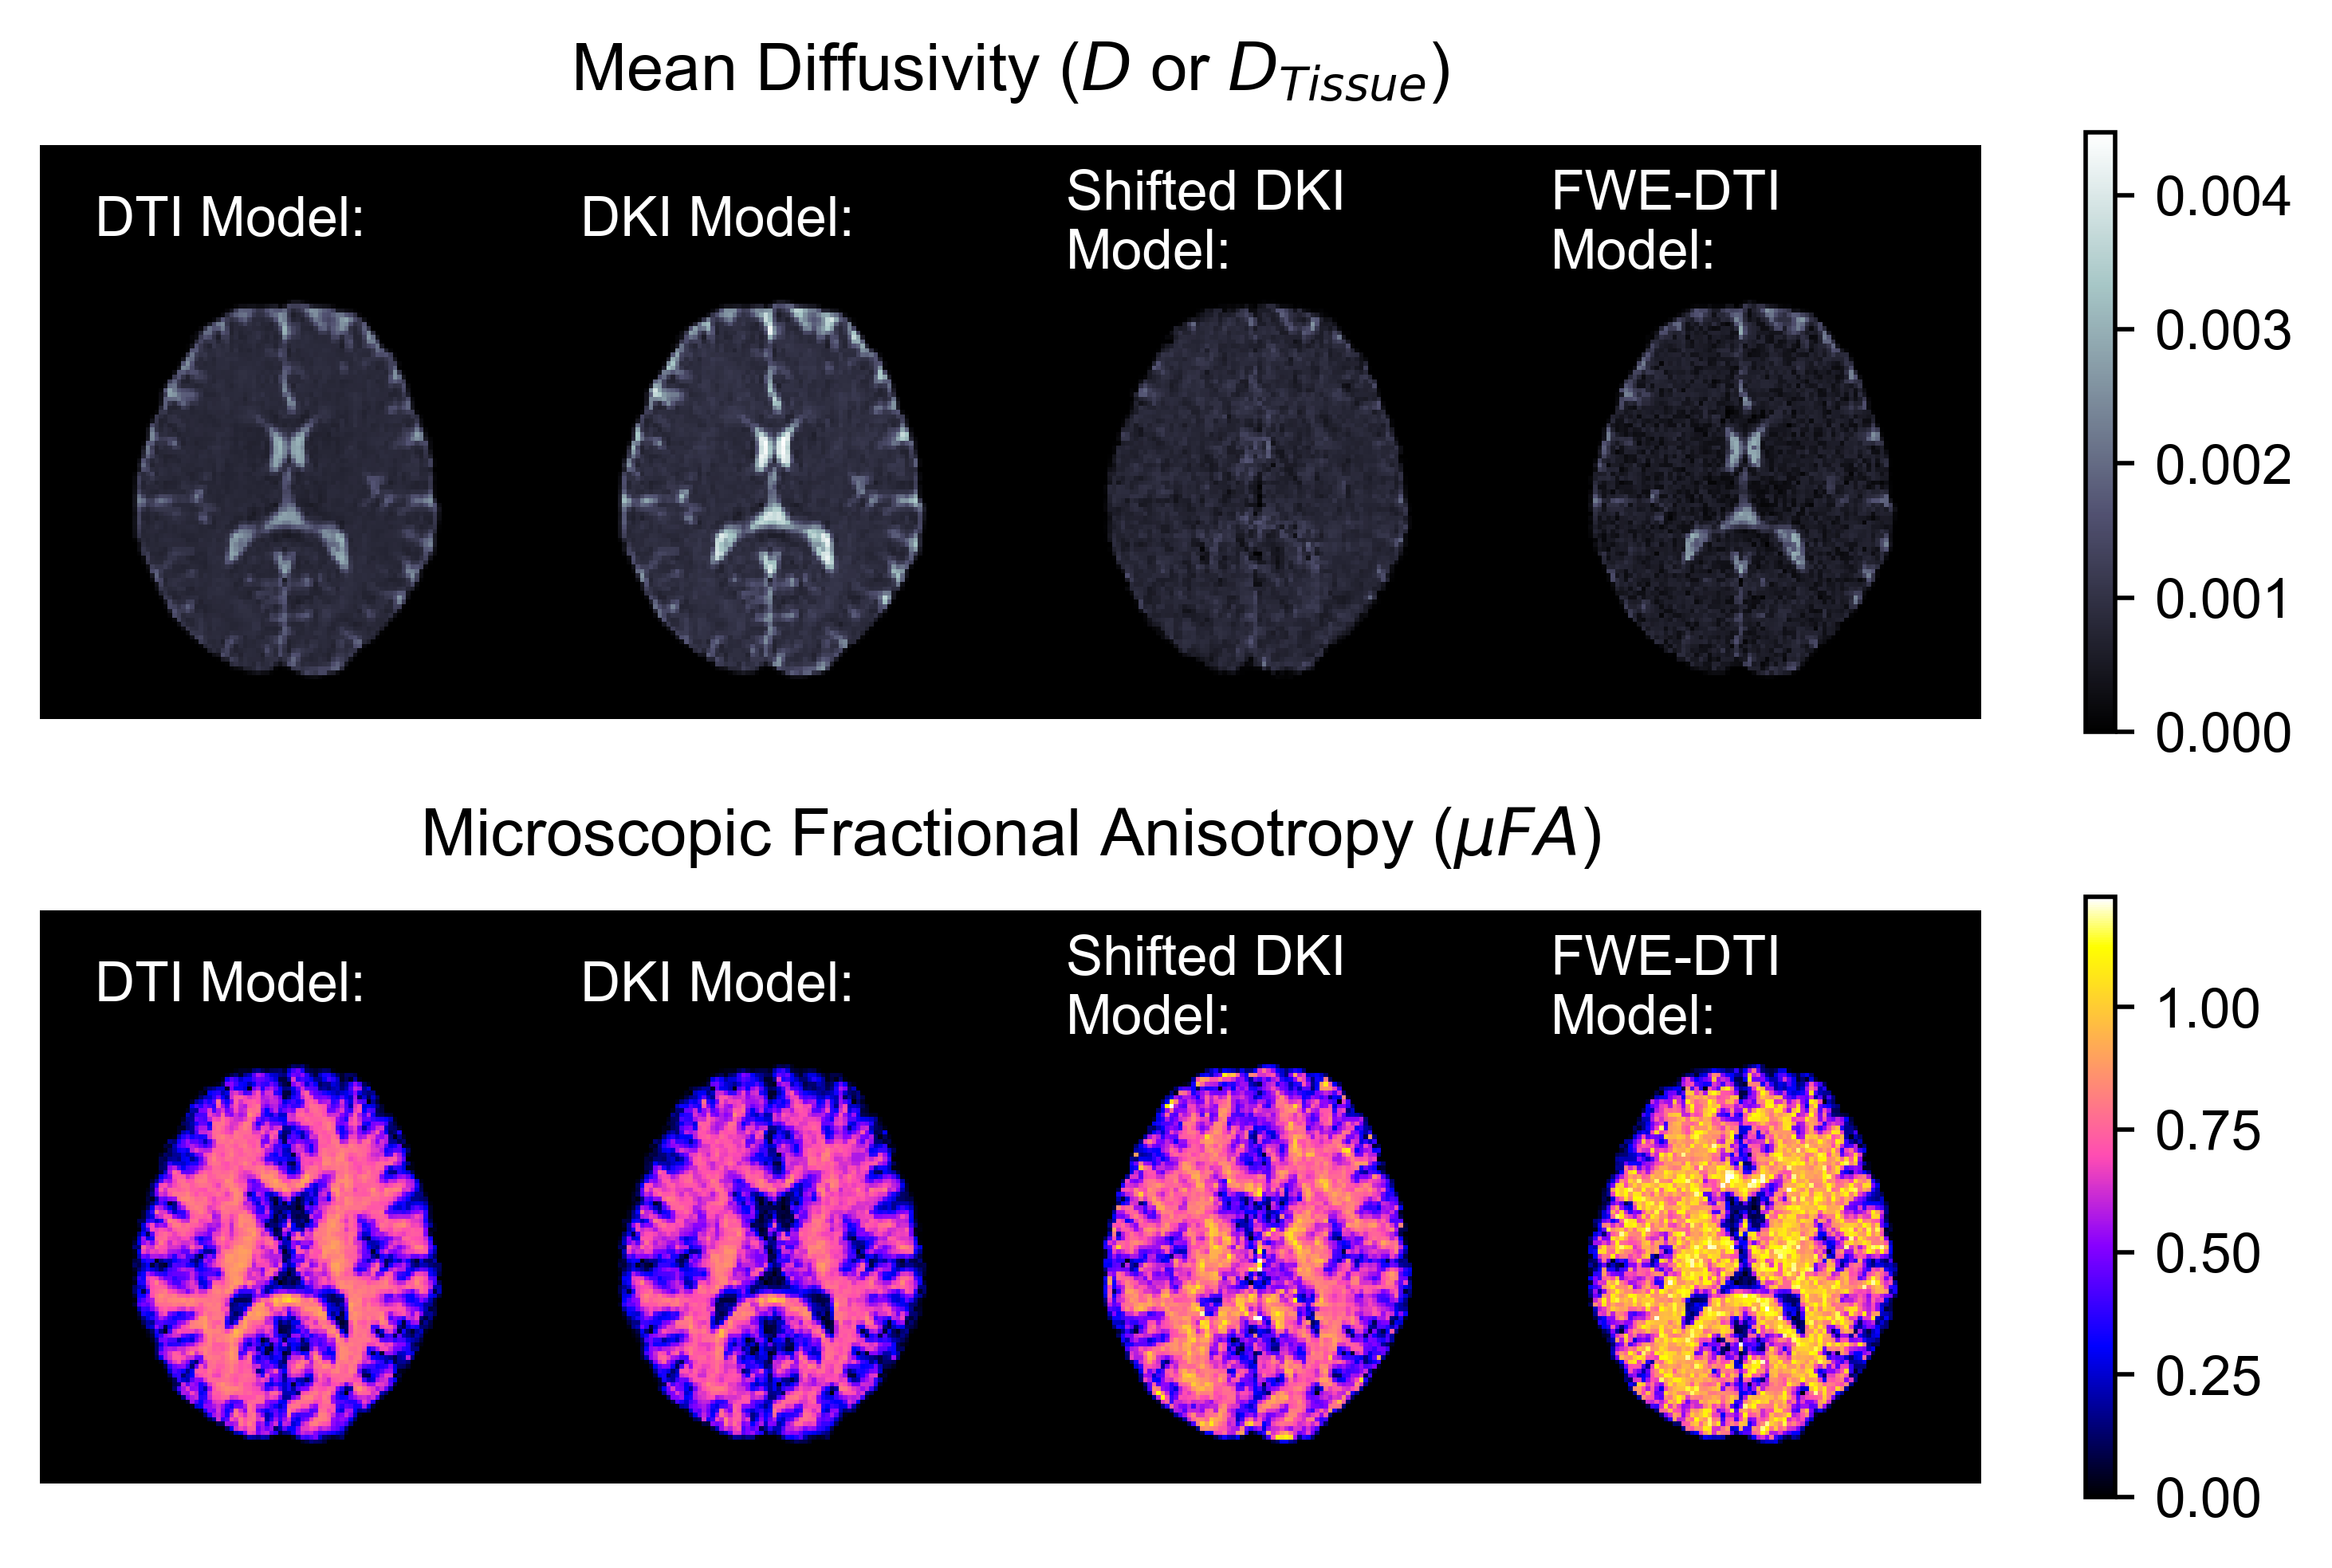
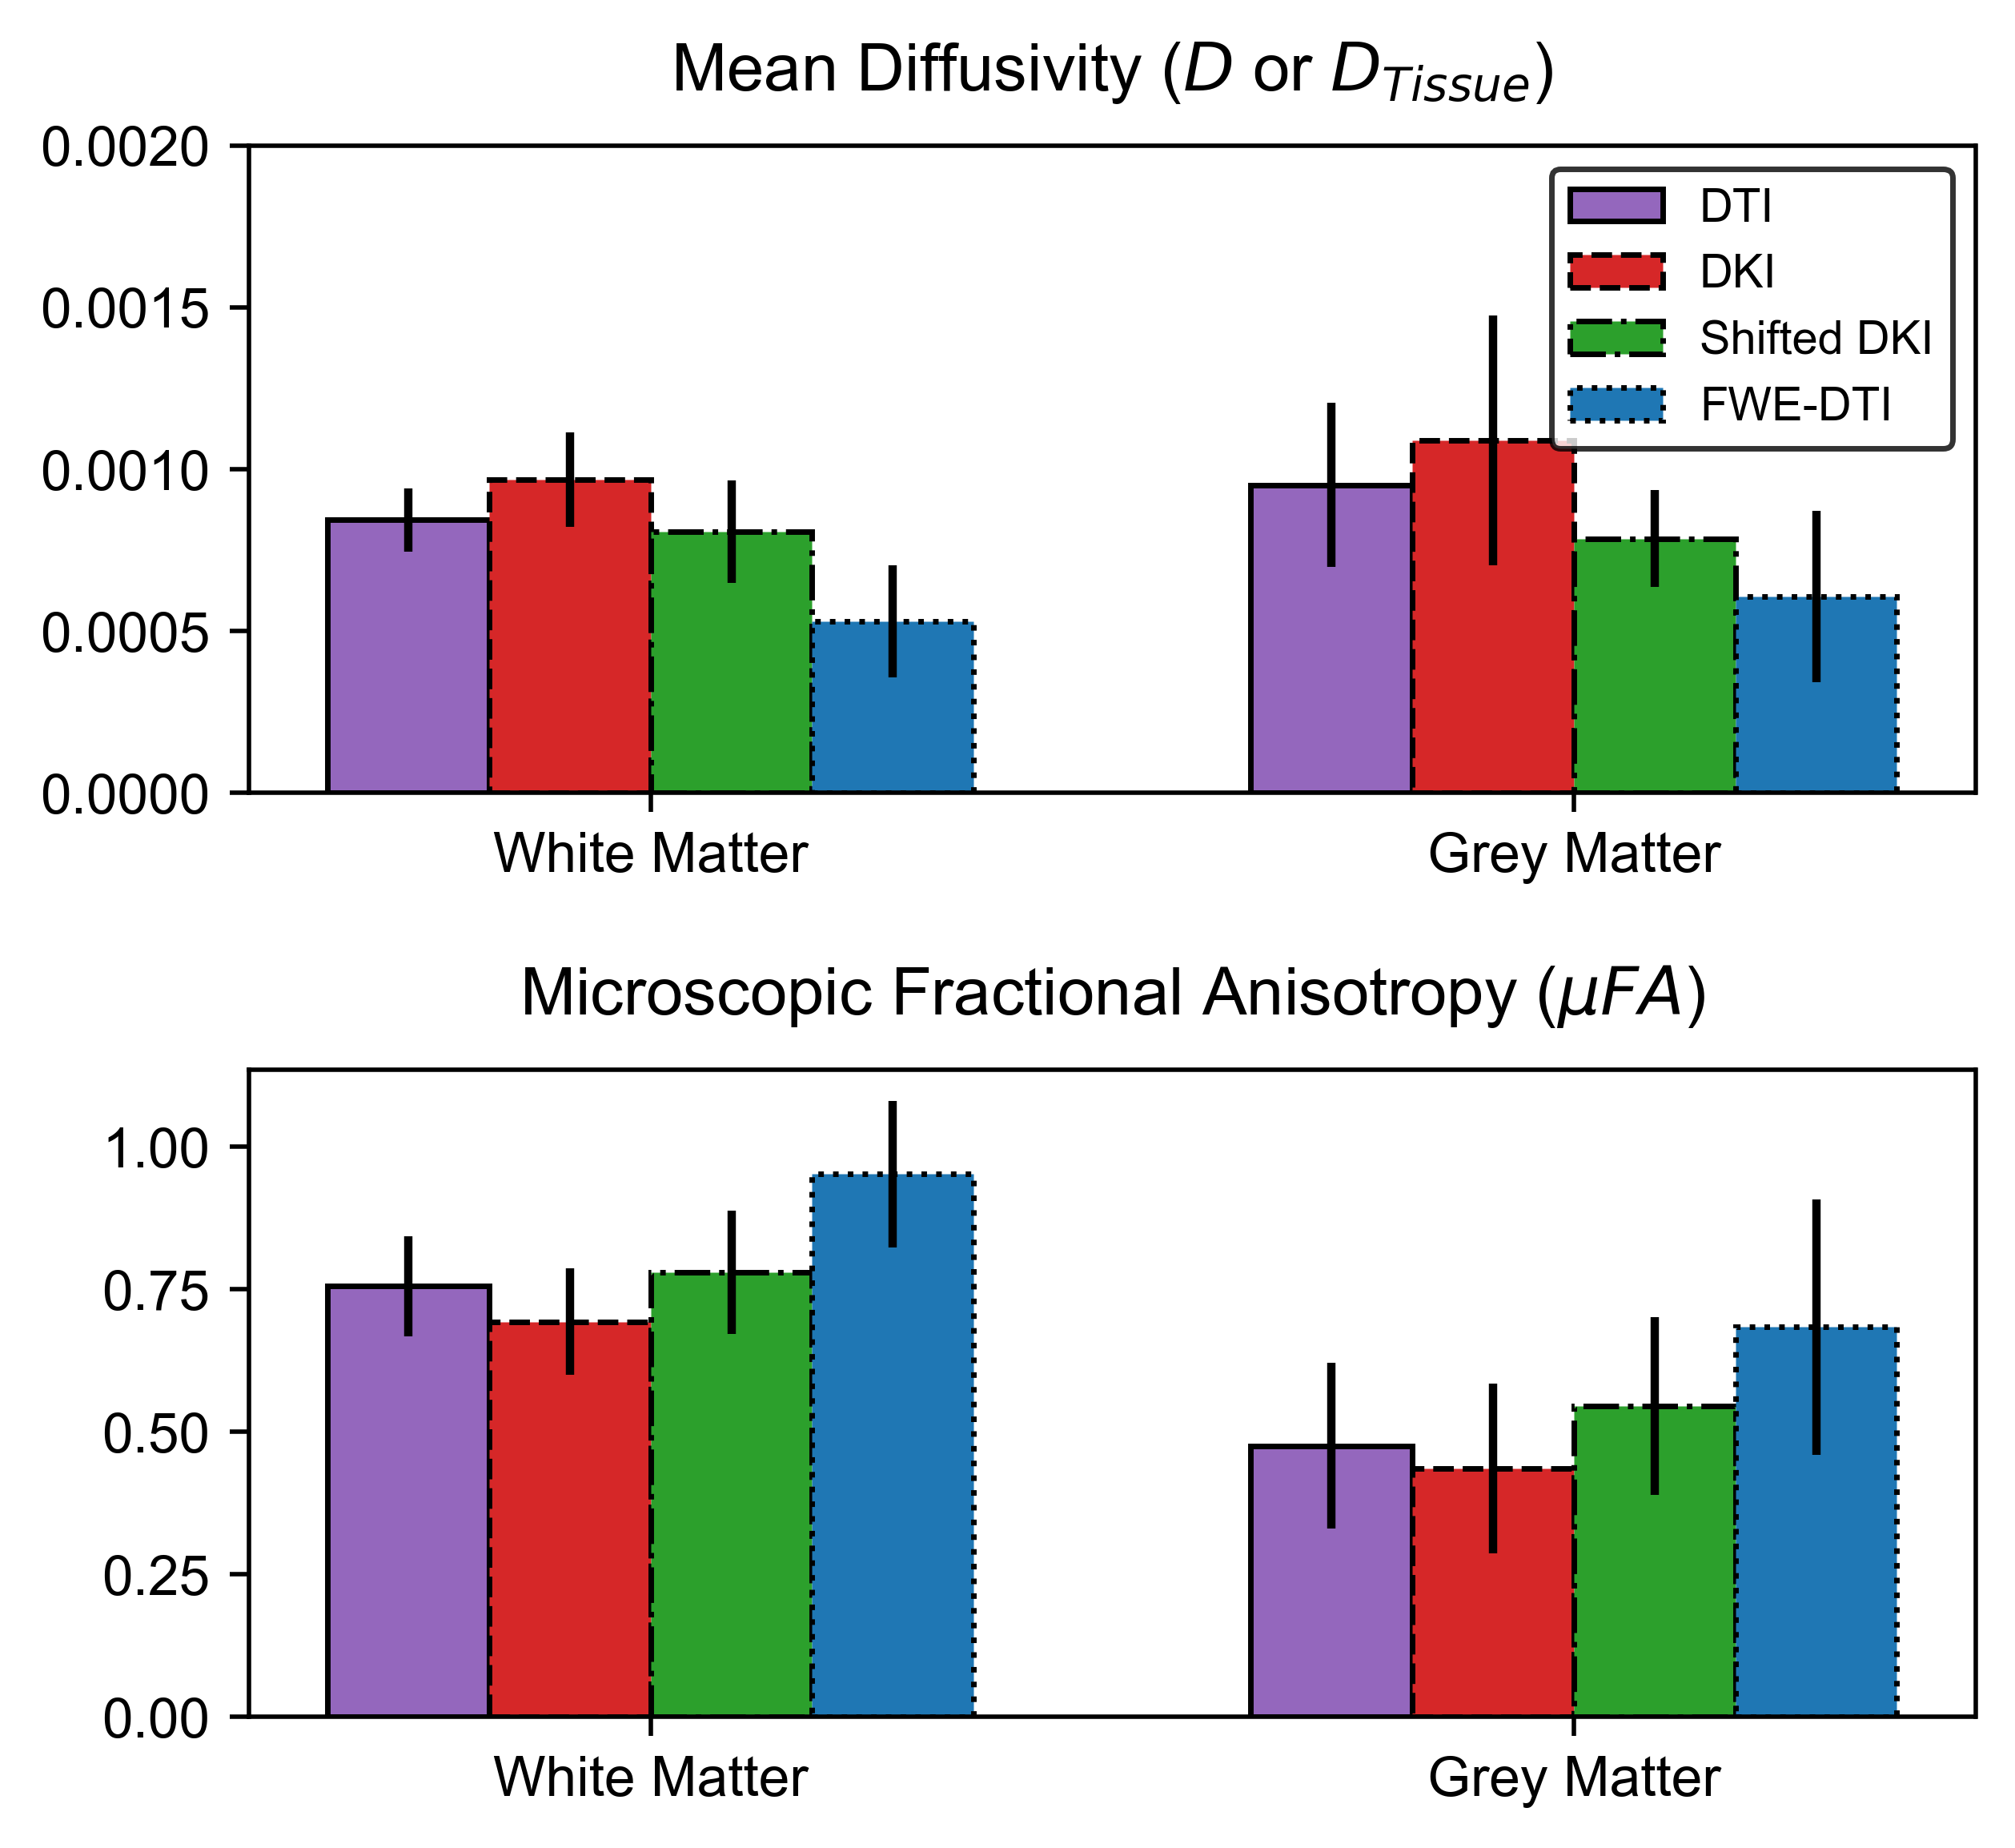
The simulation results are summarized in Table 1. Both the shifted DKI and FWE-DTI models estimated the tissue diffusivity more accurately than the DTI and DKI models. The shifted DKI method overestimated diffusivity in most configurations, while the FWE-DTI model underestimated it. Example D and μFA in vivo slices are depicted in Fig.3. Compared to the DTI and DKI models, the two CSF-suppressing models yielded images with lower mean D and higher mean μFA, summarized in Fig.4.Discussion
Both CSF-suppressing methods yielded lower D values than the DTI and DKI models in simulations, and in vivo grey matter (GM) and white matter (WM) regions, providing evidence that they may reduce CSF-PVEs. As expected, the differences in the D and μFA metrics between the CSF-suppressing models and the DTI and DKI models were greater in GM than WM, as GM regions typically have larger free-water volume fractions. Simulations revealed that the FWE-DTI technique is prone to misestimation when free-water diffusivity isn’t the assumed value of 3e-3mm2/s, and in the presence of added noise a global bias in the model was observed, evidenced by the f=0.0 and f=1.0 cases in Table 1 as well as the high standard deviations in all simulation configurations. This may indicate some instability in the fitting algorithm, which could potentially be mitigated using regularization or other constraints. 7 While the shifted DKI method was susceptible to misestimation when tissue volume fraction was low (likely due to it attenuating, rather than removing, the CSF signal), it is relatively simple and requires minimal model assumptions.In summary, this preliminary work demonstrates the potential for CSF-suppressing techniques to improve μFA estimation in regions where CSF-PVEs are prevalent, which may improve the specificity of μFA imaging in the study of CSF-adjacent tissue like the fornix or cortical GM.
Acknowledgements
The authors would like to thank the National Sciences and Engineering Research Council of Canada (NSERC) and the Canada First Research Excellence Fund to BrainsCAN.References
1. Shemesh, N. et al. Conventions and nomenclature for double diffusion encoding NMR and MRI. Magn. Reson. Med. 75, 82–87 (2016).
2. Arezza, N. J. J., Tse, D. H. Y. & Baron, C. A. Rapid Microscopic Fractional Anisotropy Imaging via an Optimized Kurtosis Formulation. medRxiv 2020.11.23.20237099 (2020).
3. Pasternak, O., Sochen, N., Gur, Y., Intrator, N. & Assaf, Y. Free water elimination and mapping from diffusion MRI. Magn. Reson. Med. 62, 717–730 (2009).
4. Baron, C. A. & Beaulieu, C. Acquisition strategy to reduce cerebrospinal fluid partial volume effects for improved DTI tractography. Magn. Reson. Med. 73, 1075–1084 (2015).
5. Szczepankiewicz, F. et al. Quantification of microscopic diffusion anisotropy disentangles effects of orientation dispersion from microstructure: Applications in healthy volunteers and in brain tumors. Neuroimage 104, 241–252 (2015).
6. Basser, P. J., Mattiello, J. & LeBihan, D. MR diffusion tensor spectroscopy and imaging. Biophys. J. 66, 259–267 (1994).
7. Hoy, A. R., Koay, C. G., Kecskemeti, S. R. & Alexander, A. L. Optimization of a free water elimination two-compartment model for diffusion tensor imaging. Neuroimage 103, 323–333 (2014).
Figures