3652
Evaluation of Synthetic-DWI with T2-based Water Suppression for DTI1Department of Radiological Science, Shizuoka College of Medicalcare Science, Hamamatsu, Japan
Synopsis
We evaluated our proposed T2wsup-DWI method of reducing CSF-partial volume effects (PVE) on DTI. We assessed the errors in ADC and FA and the comparison of the ADC SNRs with several methods with simulation, and brain study. We clarified that our proposed T2wsup-DWI technique was superior to already proposed water suppression DWI methods of FLAIR and non-b-zero (NZE) methods in both of the ADC-SNR and the reduction effects of CSF-PVE in DTI parameters of ADC, FA, and tractograpy, typically at the portion of the fornix crus or genu of the corpus callosum which are close to the ventricle.
Introduction
It is very important to reduce CSF-PVE artifacts in quantification of ADC, FA, or in drawing fiber tractography in diffusion MRI (dMRI) [1]. There have proposed several methods to solve those problems [2-7]. We have proposed a new dMRI technique to solve those problems by combining with T2-based water suppression technique (T2wsup) with synthetic MRI [8-9]. Previous study reported mainly focused on the assessment for ADC with our T2wsup-DWI and the standard method (w/o wsup) [10]. In this study, we focused on the evaluation of DTI; that is quantitative maps of ADC as well as FA and fiber tractograpy. We quantitatively assessed the errors in ADC and FA introduced by CSF-PVE and the comparison of the ADC SNRs for T2wup-DWI with for alternative methods of FLAIR-DWI and non-zero b-value (NZB) method with simulation, and we showed that our proposed T2wsup-DWI provided a promising result by brain study.Methods
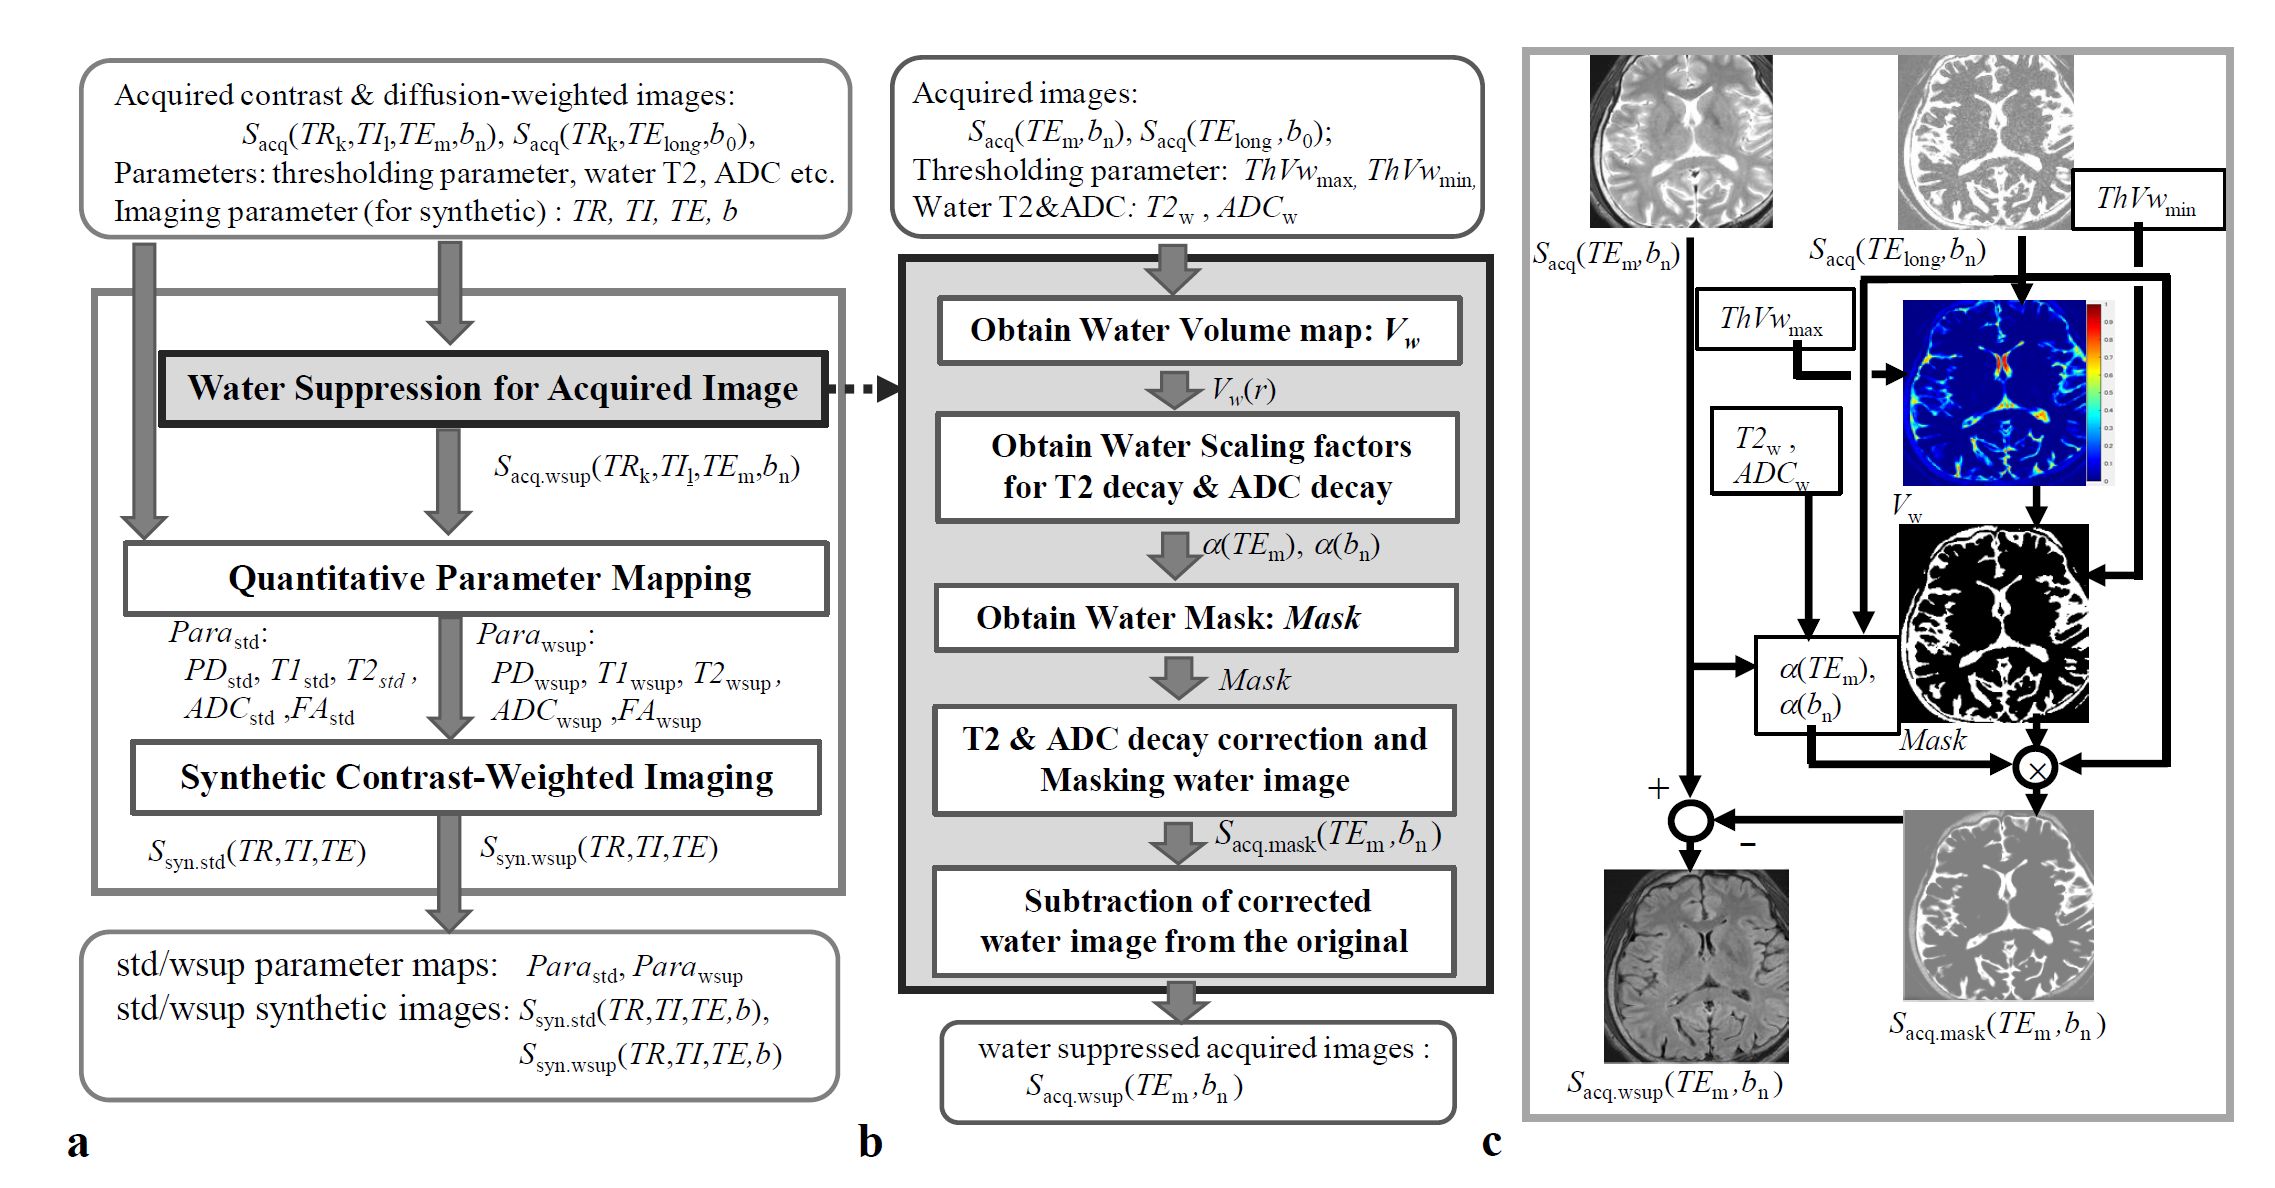
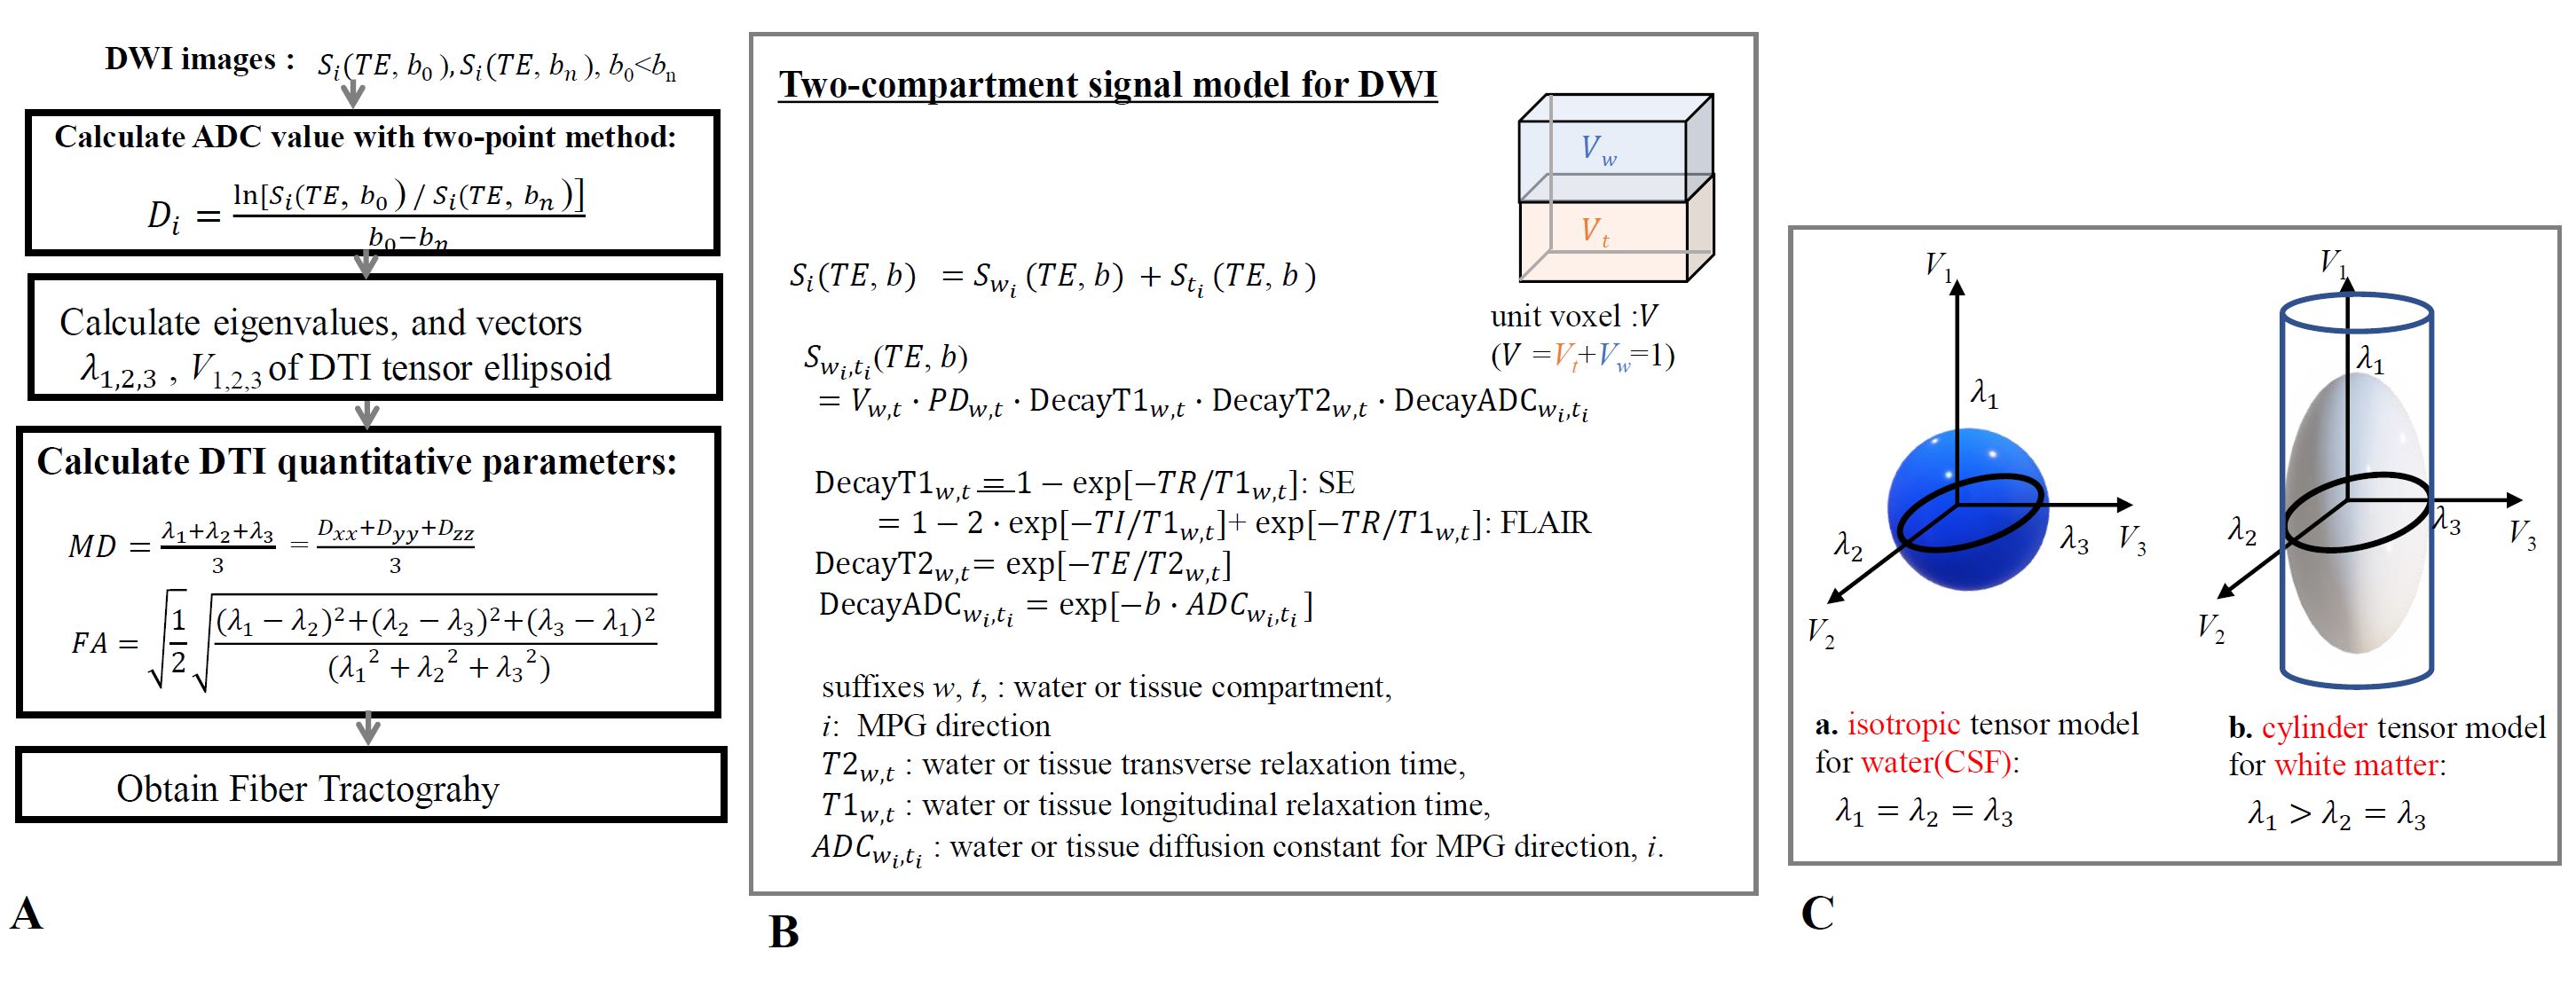
Theory:Process flow for our proposed T2wsup-DWI is shown in Fig. 1. Here as shown in Fig. 2, a two-compartment signal model for DWI signal in unit voxel, and diffusion tensor ellipsoid model for DTI analysis were assumed, and a two-point method was used for ADC and FA calculation. The SNR of the ADC map calculated by the two-point method is given by [11]:
$$ \frac{S_{0}}{\sigma}\frac{(b_{n}-b_{0})}{\sqrt{1+{ln(\frac{S_{0}}{S_{n}})}^2}} (1)$$
, where S0 and Sn indicate the signal intensities (SIs) of b=b0 and bn (bn>b0 ), σ is the standard deviation (SD) of the DWI image assuming Gaussian noise and independent of b.
Simulation:
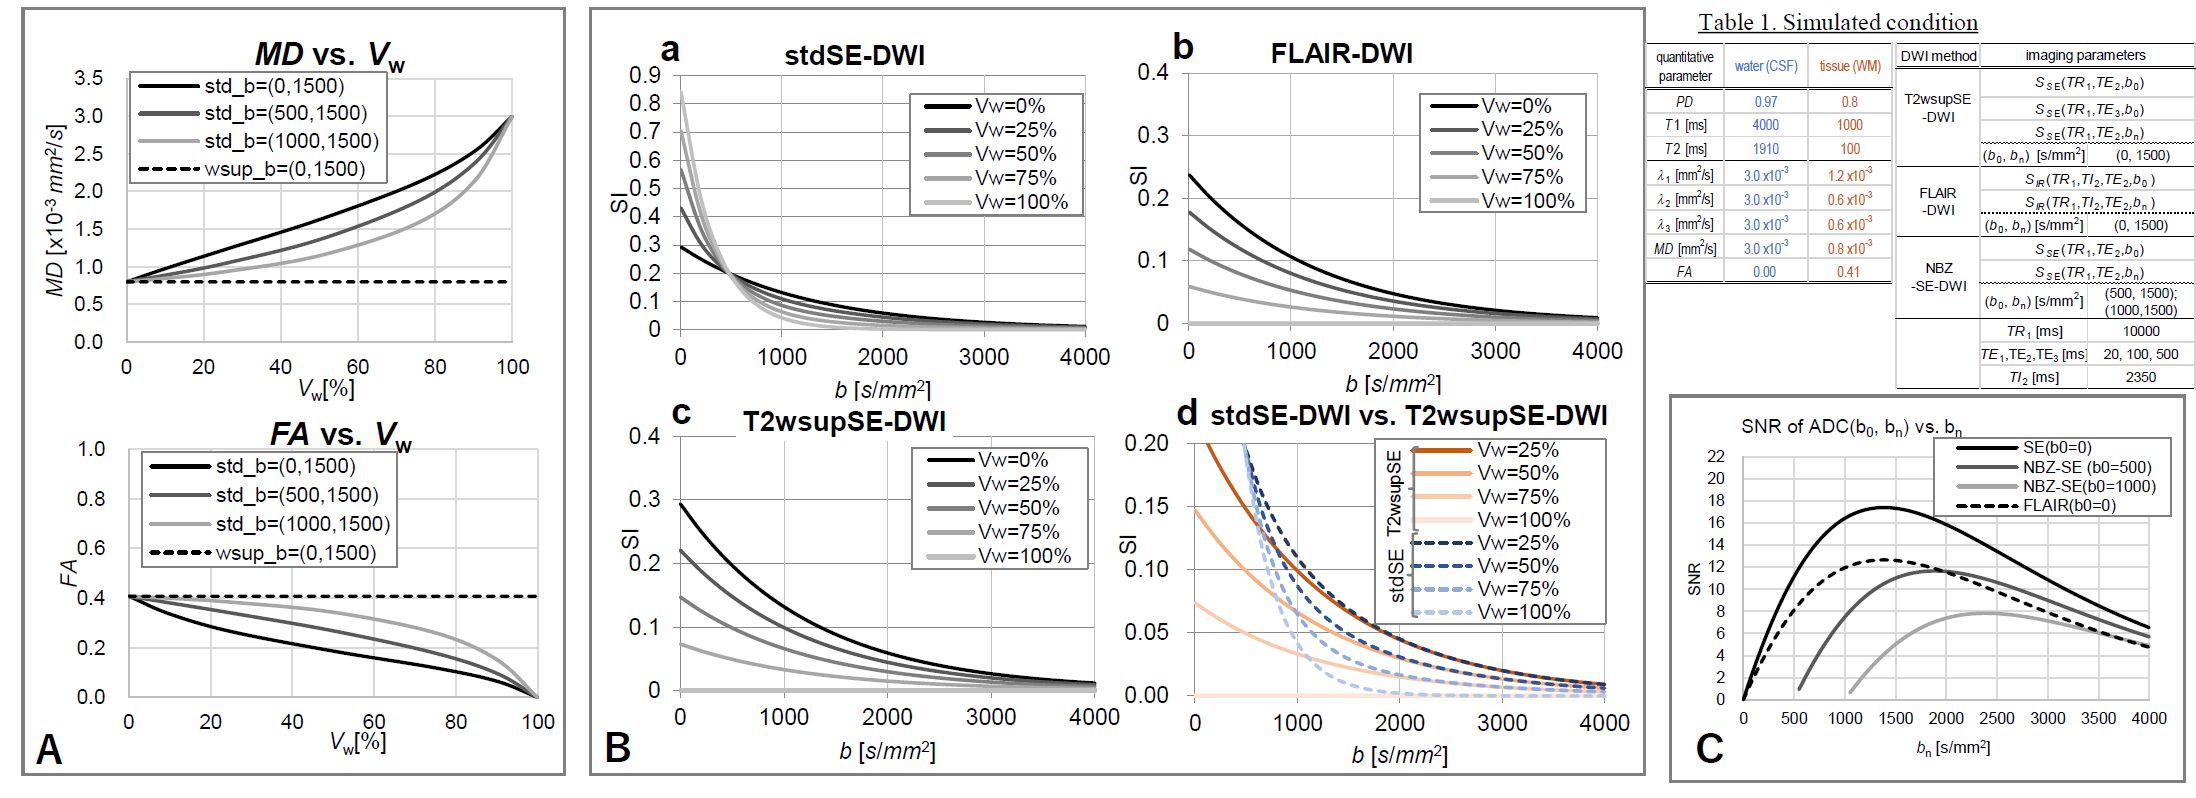
In the simulation, as shown in Fig.2, ADC (mean diffusivity: MD) and FA values were calculated as a parameter of water volume ratio, Vw, by assuming: two-compartment signal model for DWI signal, the axes of three MPGs (i = 1, 2, 3) coincide with the three axes of eigenvectors in tensor ellipsoid; thus, the isotropic diffusion model for water and WM of the cylinder tensor model. Next the SNRs of ADC values at pure tissue volume were compared among 3 DWI methods of SE (T2wsup), FLAIR, and NZB. Whole parameters were shown in Fig.3.
MRI Experiments:
A healthy volunteer study was performed on an MRI machine (Galan 3T ZGO; Canon Medical Systems Corp., Otawara, Japan) with a 32-channel head coil after obtaining written informed consent. This study was approved by our Institutional Review Board. The SE–EPI sequence was used, in which the common acquisition parameters were as follows: parallel imaging of speed-up factor 3; the number of slices was selected at the maximum for long TE images; the number of average = 1, acquisition matrix = 192 × 256 (phase encode × read out); and display matrix = 512 × 512 after sinc interpolation; MPG direction = 6, 3 mm × 50 slices; TR1 = 10000 ms; TElong = 500 ms; TE2 = 48 ms; and b = 0, 1000 s/mm2. The analysis parameters were as follows: α(TE) was measured using the SI ratio with ThVwmax = 1, ADCw = 3 × 10⁻³ mm2/s, and ThVwmin = 0.05. Isotropic DWI, MD, FA, color FA, and FT images were obtained. dTV-II.SR and Volume-One v.1.72 (http://medimg.info.hiroshima-cu.ac.jp/dTV.II.15g/) were used for DTI data analysis. Tractographic analysis was performed after iso-voxel interpolation, followed by drawing the tracts by setting two seed ROIs on the portion of the fornix crus with the threshold parameters of FA to stop drawing commonly at 0.25. The data was assessed with and without our T2wsup technique.
Results
Simulation:Figures 3 shows the simulation results. These three simulation results indicate that the standard SE–DWI technique along with ideal water suppression, that is, T2wsup–SE–DWI, provides the best results among the three methods evaluated in terms of both the SNR and the effects of water suppression.
MRI Experiments:
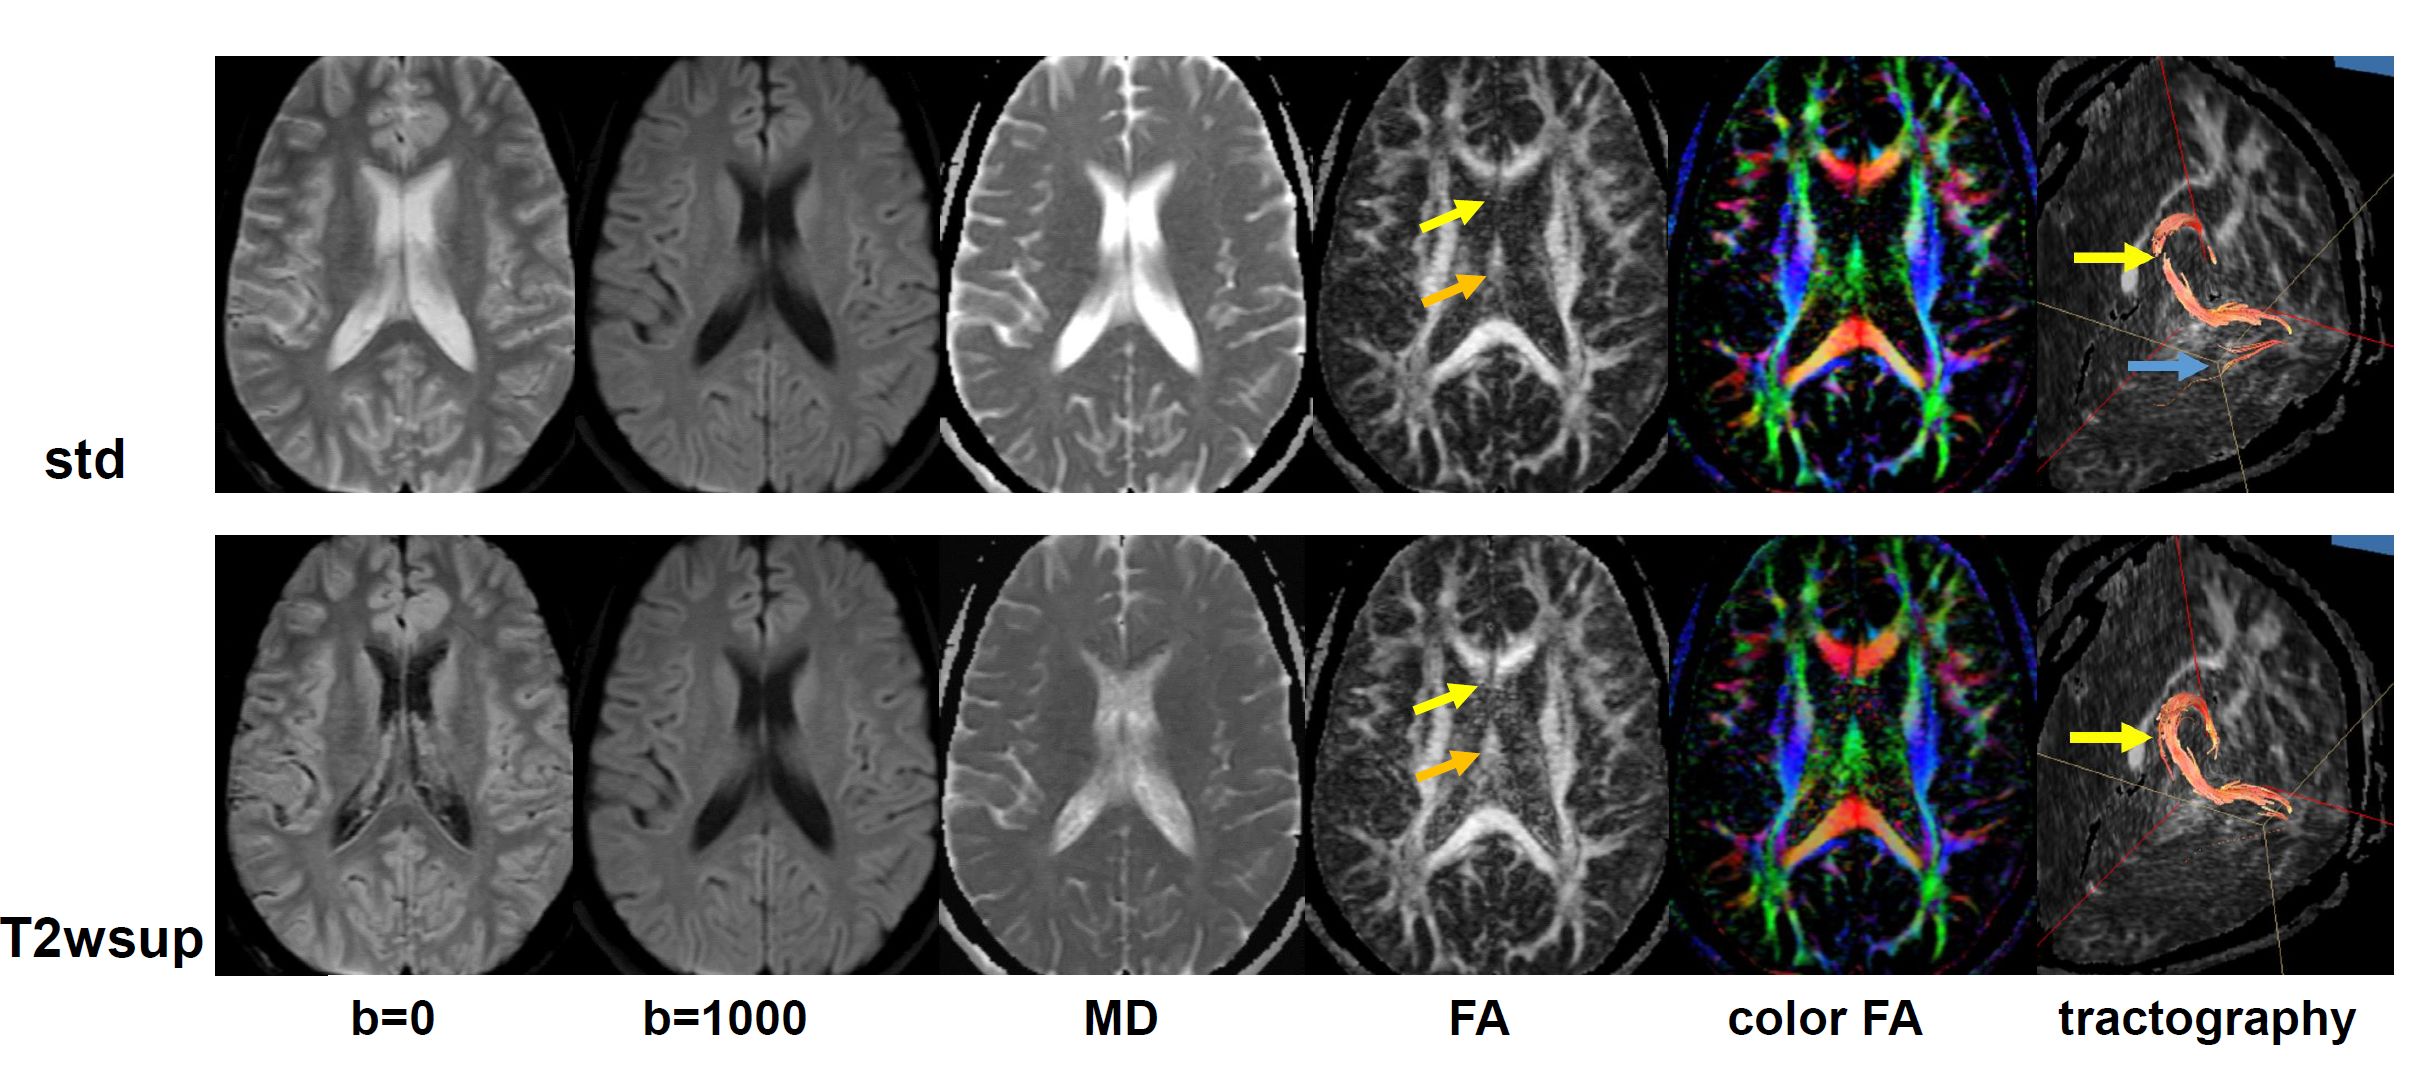
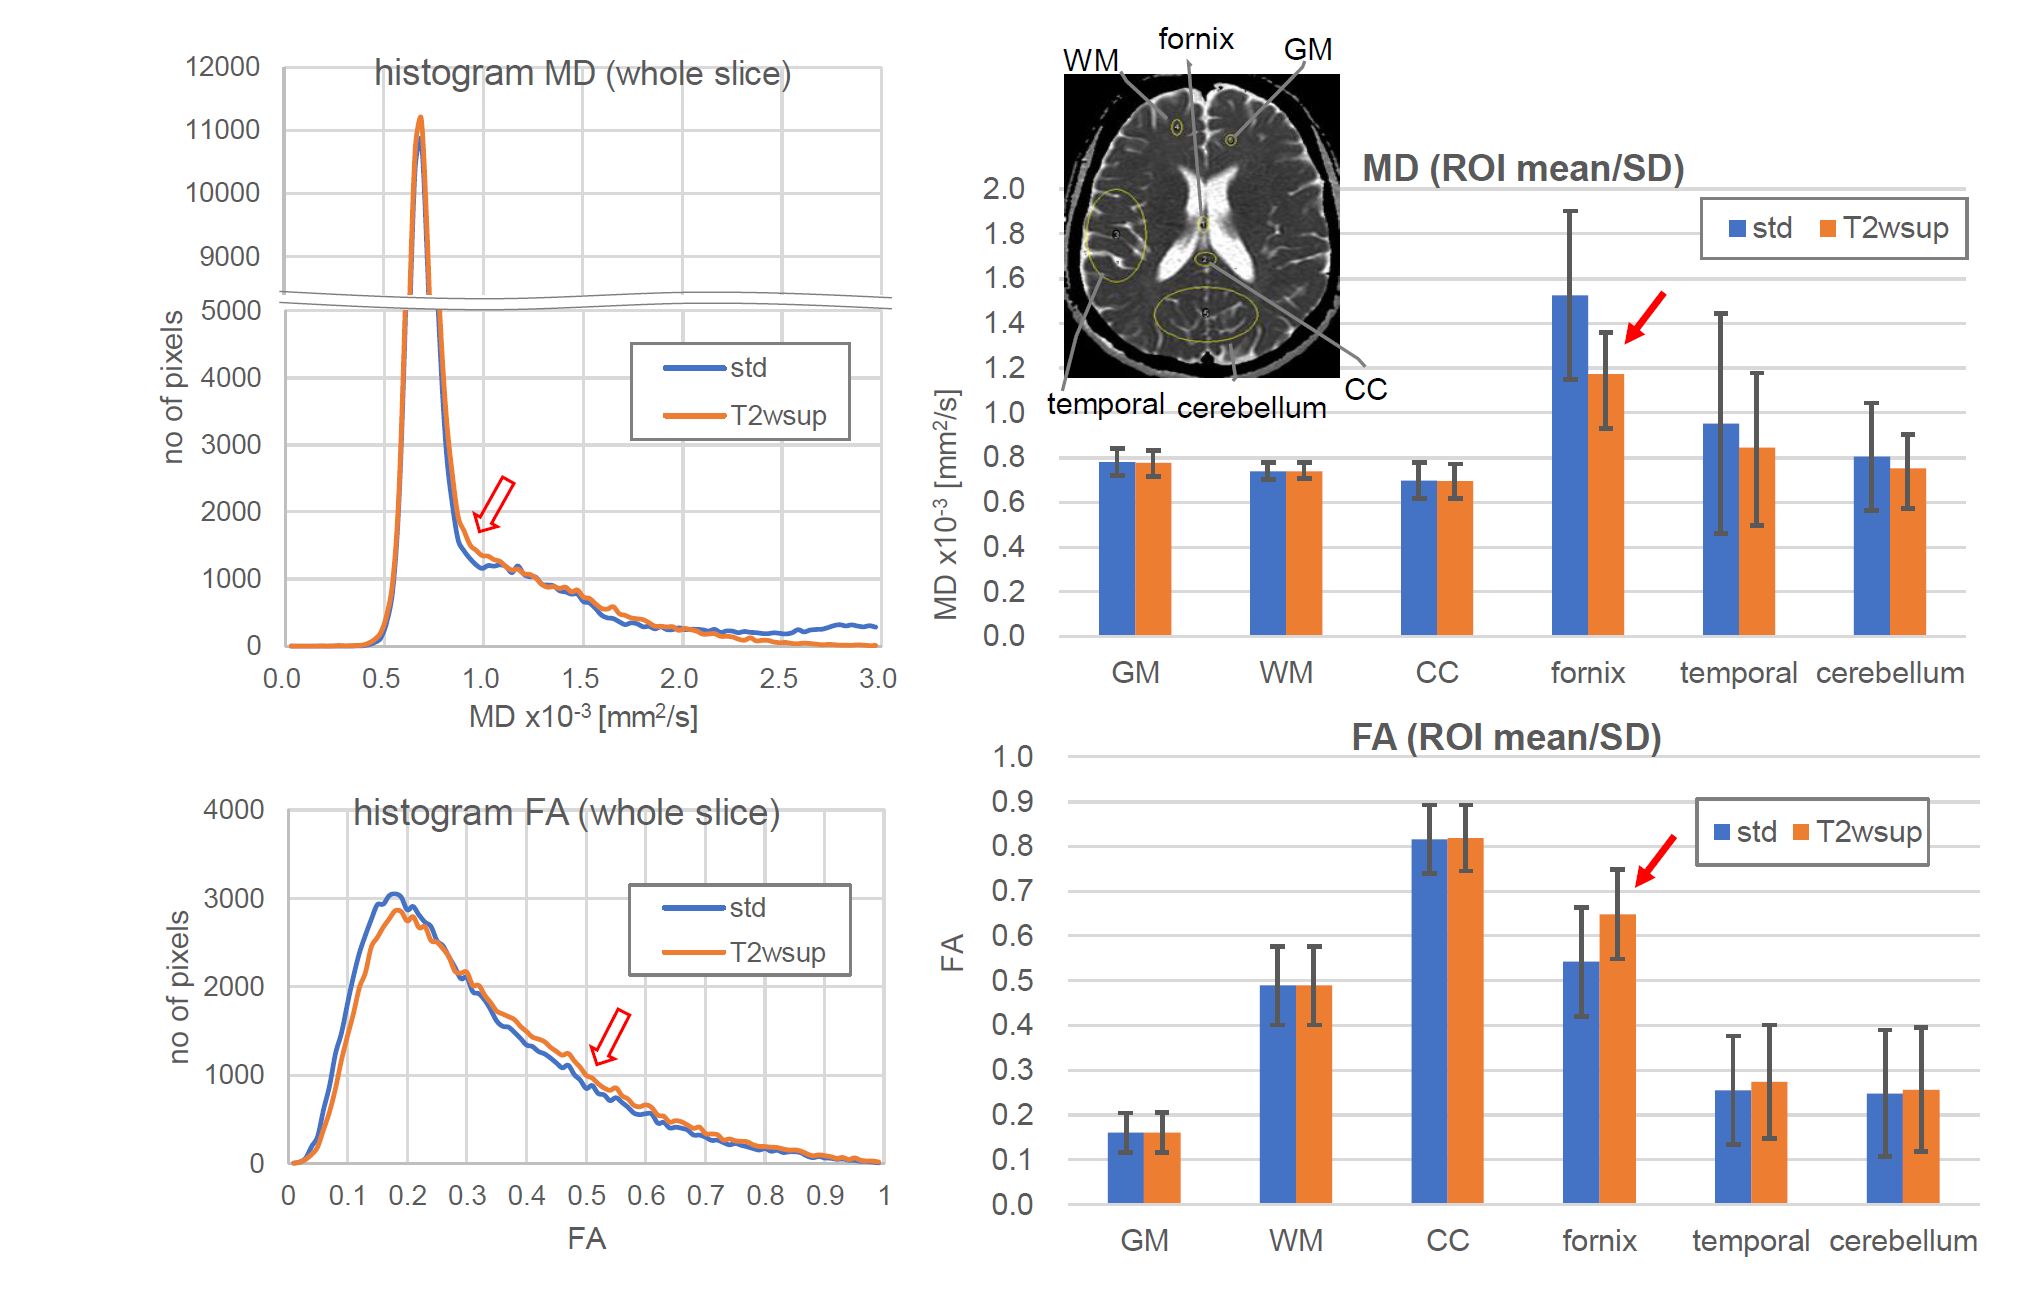
Figures 4-5 show the results of the MR brain study. Comparing the standard and T2wsup images (Fig. 4) with those numerical results in the CSF–PVE portions (Fig. 5), the ADC values became lower and the FA values became closer to 1 in the T2wsup images, typically at the portion of the fornix crus or genu of the corpus callosum where CSF–PVE due to the ventricle was greater. Furthermore, the tractography for T2wsup–DWI at the central portions of two seed ROIs was thicker and better connected than that for standard DWI.
Discussion
Solving the problem of CSF–PVE in the current dMRI technique using our proposed T2wsup–DWI technique is easy, with higher quality than those obtained with the other already proposed water suppression techniques. This technique has higher quality than the other already proposed water suppression techniques. Although further optimization of the pulse sequence and processing techniques and clinical assessments, particularly for long T2 lesions are required, it is expected that our proposed T2wsup–DWI method could be useful in clinical settings.Acknowledgements
We sincerely thank Yuki Takai, Hiroshi Kusahara, Ryo Shiroishi, and Hitoshi Kanazawa of Canon Medical Systems Corporation for supporting the data acquisition and analysis in this study.References
[1] Salminen LE, et al. Reducing CSF Partial Volume Effects to Enhance Diffusion Tensor Imaging Metrics of Brain Microstructure. Technol Innov. 2016;18:5-20.
[2] Latour LL, et al. Cerebral spinal fluid contamination of the measurement of the apparent diffusion coefficient of water in acute stroke. Magn Reson Med. 2002;48(3):478–486.
[3] Papadakis NG, et al. Study of the effect of CSF suppression on white matter diffusion anisotropy mapping of healthy human brain. Magn Reson Med. 2002;48(2):394–398.
[4] Pasternak O, et al. Free water elimination and mapping from diffusion MRI. Magn Reson Med. 2009;62(3):717–730.
[5] Pasternak O, et al. Estimation of extracellular volume from regularized multi-shell diffusion MRI. Med Image Comput Comput Assist Interv. 2012;15(2):305–312.
[6] Baron CA, et al. Acquisition strategy to reduce cerebrospinal fluid partial volume effects for improved DTI tractography. Magn. Res. Med. 2015;73(3):1075–1084.
[7] Salminen LE, et al. Phillips S, Paul RH. Regional age differences in gray matter diffusivity among healthy older adults. Brain Imag Behav. 2016;10(1):203–211.
[8] Kimura T et al. Synthetic MRI with water suppression technique to reduce CSF partial-volume dependent artifacts in brain. ISMRM, 27th 2019: #4867.
[9] Kimura T, Yamashita K, Fukatsu K. Synthetic MRI with T2-based Water Suppression without Loss of Tissue SNR. Proceedings of the 29th Annual Meeting of ISMRM, Paris, 2020; #3775.
[10] Kimura T, Yamashita K, Fukatsu K. Synthetic-DWI with T2-based Water Suppression. Proceedings of the 29th Annual Meeting of ISMRM, Paris, 2020; #4386.
[11] Xing D, Papadakis NG, Huang CLH, Lee VM, Carpenter TA, Hall LD. Optimised diffusion-weighting for measurement of apparent diffusion coefficient (ADC) in human brain. Magn Reson Imag 1997;15:771–784.
Figures