3651
Time-dependent anisotropic diffusion in the mouse heart: feasibility of motion compensated tensor-valued encoding on a 7T preclinical scanner1Danish Research Centre for Magnetic Resonance, Centre for Functional and Diagnostic Imaging and Research, Copenhagen University Hospital Hvidovre, Copenhagen, Denmark, 2Random Walk Imaging, Lund, Sweden, 3Leeds Institute of Cardiovascular and Metabolic Medicine, University of Leeds, Leeds, United Kingdom, 4Department of Neurosurgery, Medical College of Wisconsin, Milwaukee, WI, United States, 5Clinical Sciences, Lund University, Lund, Sweden
Synopsis
Tensor-valued diffusion encoding with simultaneous nulling of velocity, acceleration and concomitant gradients can be applied with high b-values on a preclinical 7T scanner. Results for ex-vivo mouse hearts confirm that time-dependent diffusion can significantly affect estimation of mean diffusivity. The estimated restriction sizes are consistent with results from pig hearts. Signal attenuations at high b-values suggest relatively low microscopic anisotropy and a strong influence of time-dependent diffusion on microstructure characterization.
Introduction
Tensor-valued diffusion encoding can probe microstructure unconfounded by macroscopic anisotropy1-9. In contrast to the conventional linear tensor encoding (LTE), it employs b-tensors of varying shapes. Spherical tensor encoding (STE)3,5 yielding isotropic diffusion weighting10-12 has the potential by itself to accelerate measurements of mean diffusivity (MD). In addition, STE can be combined with LTE to probe microscopic anisotropy from data at higher b-values1,2,13.Motion compensated diffusion encoding14-16 is required to mitigate motion artefacts, which can severely affect image quality in cardiac imaging. STE with simultaneous nulling of arbitrary diffusion encoding gradient moments and concomitant gradients were recently proposed17,18.
As we have demonstrated in ex-vivo pig hearts19, time-dependent diffusion effects20-26 could lead to significantly different MD values from different protocols. At high b-values, these effects may bias estimation of microscopic anisotropy or they can be used advantageously to simultaneously assess cell size and anisotropy26.
In this study, we examined the time dependence of MD in ex vivo mouse hearts on a 7T scanner to support microstructure characterization and faster MD estimation in the high-field preclinical setting.
Restricted diffusion model
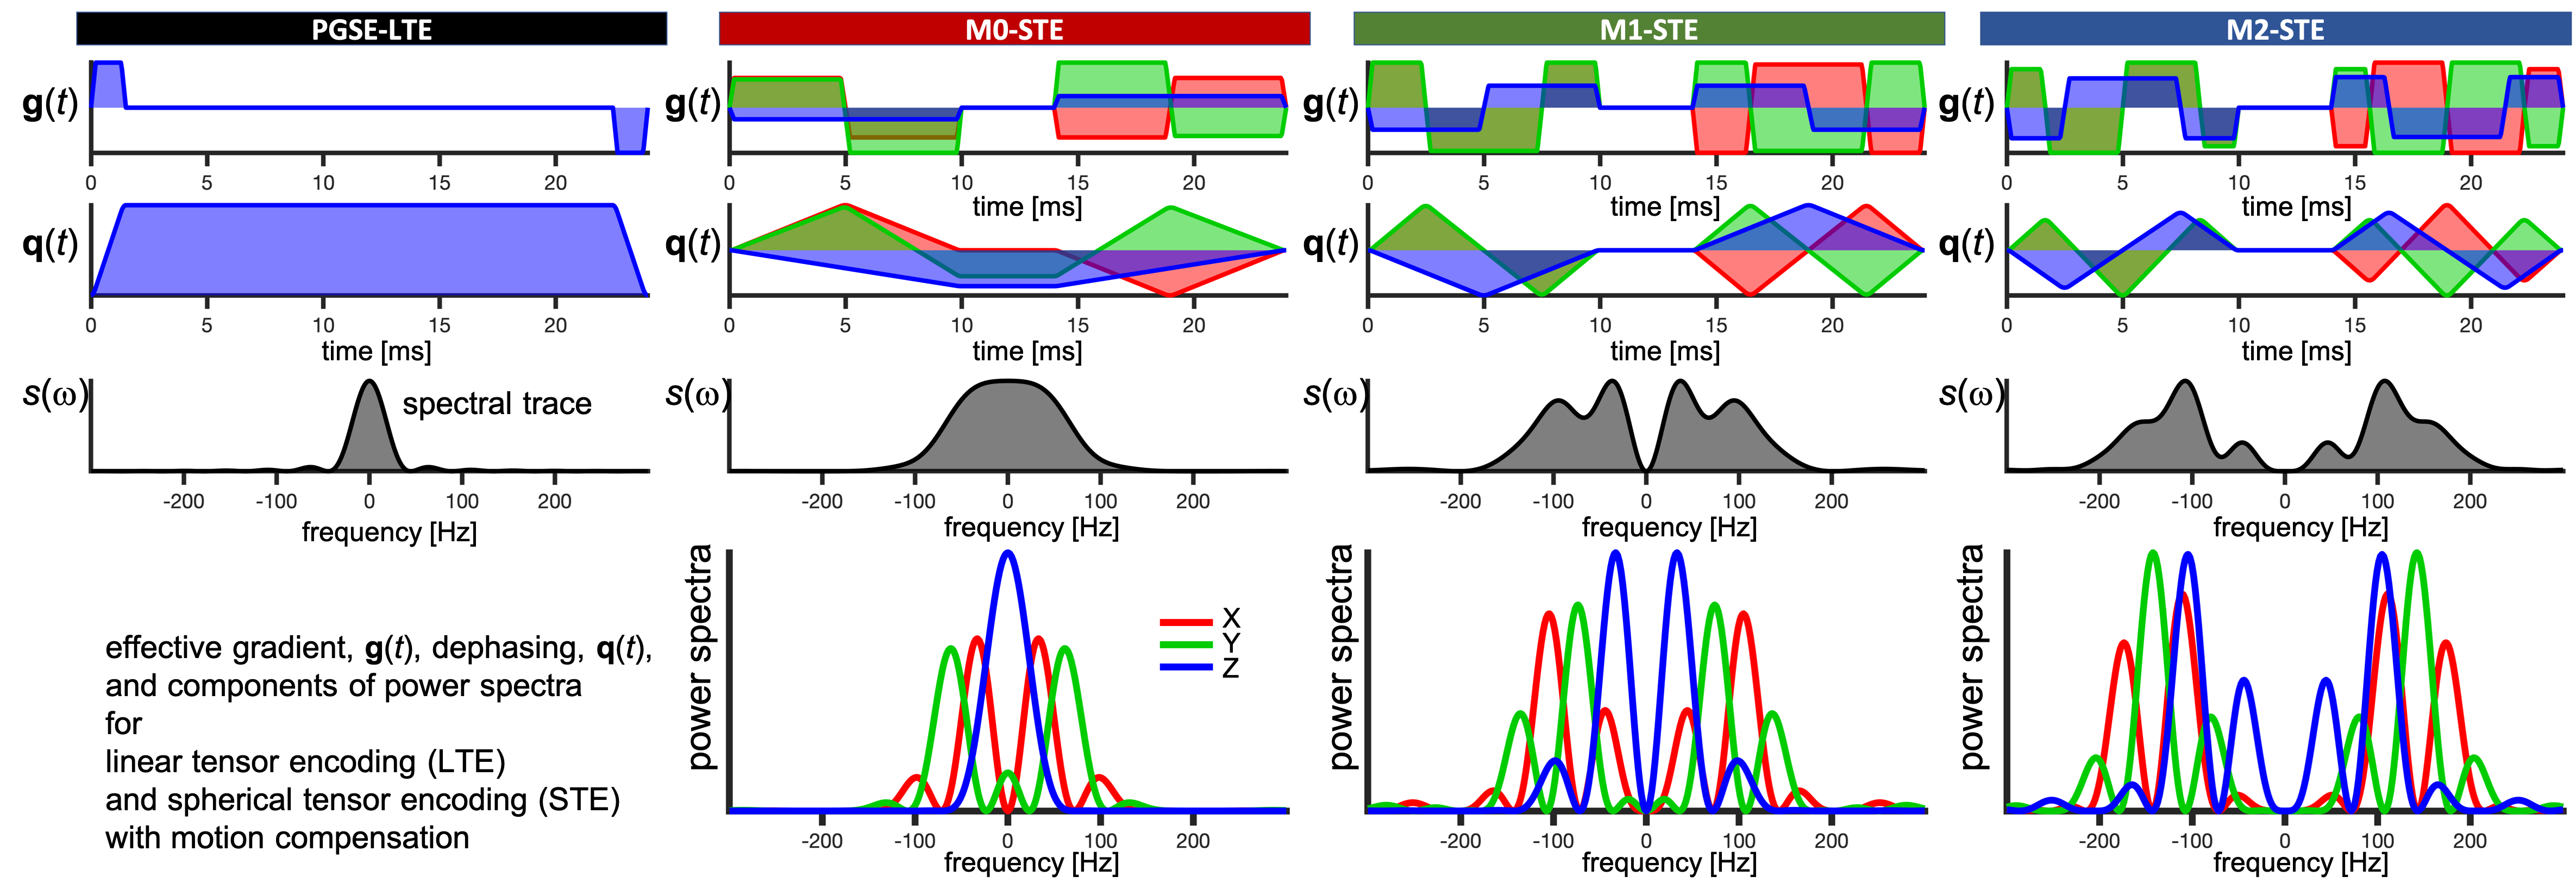
For diffusion restricted in impermeable cylinders23,26 of varying radii, diagonal components of diffusion spectra $$$D_{ii}(\omega,R)$$$ were used to predict MD from27$$b\cdot\text{MD}(R)=\sum_{i=1}^3\int_{\infty}^{\infty}s_{ii}(\omega)\,D_{ii}(\omega,R)\,d\omega.$$Here $$$s_{ii}(\omega)$$$ are diagonal elements of the dephasing cross power spectral density given by Fourier transforms of dephasing waveforms $$$q_{i}(t)$$$ as$$s_{ij}(\omega)=q_{i}(\omega)\overline{q}_{j}(\omega).$$
Total encoding power (b-value) is given by the spectral trace $$$s(\omega)$$$ (shown in Figure 1 for all waveforms) as27$$b=\sum_{i=1}^3\int_{-\infty}^{\infty}s_{ii}(\omega)d\omega\equiv\int_{-\infty}^{\infty}s(\omega)d\omega.$$
Data fitting
The hindered-restricted diffusion model was fitted globally to the ROI average data from 13 different waveforms:$$\text{MD}_{\text{calc}}=f_{\text{res}}\text{MD}_{\text{res}}(R)+(1-f_{\text{res}})D_{\text{h}},$$where $$$f_{\text{res}}$$$ is an apparent restricted fraction and $$$D_{\text{h}}$$$ is an apparent hindered Gaussian diffusion coefficient. $$$D_0 = 2.48 \, \mu \text{m}^2/\text{ms}$$$ was used for $$$\text{MD}_{\text{res}}$$$.Experiments
Two mouse hearts were arrested in slack state, perfusion fixed, excised, immersion fixed in PFA and embedded in 1% agarose PBS gel for MRI. All animal procedures were performed in accordance with UK Home Office authorization and the University of Leeds Animal Welfare and Ethical Review Committee.Multi-shot 3D DW EPI data were acquired at 28 ºC on a Bruker Biospec 7T MRI scanner using a custom diffusion waveform sequence: TR = 2 s, TE = 34.8 ms, NSA = 1, FOV = 10.8×9×9 mm, resolution = 225×225×450 μm3. Twelve different diffusion encoding waveforms, i.e. LTE (3x3) + STE (3) with all gradient moments nulled up to zeroth, first and second order (M0, M1, M2) were applied with 24 ms encoding time (6 non colinear directions) and b = 50, 800 s/mm2 (Figure 1). For the M2-waveforms, b = 50, 400, 800, 1200, 1600, 2000 s/mm2. The sensitivity to time-dependent diffusion was extended by employing a traditional PGSE.
Results and discussion
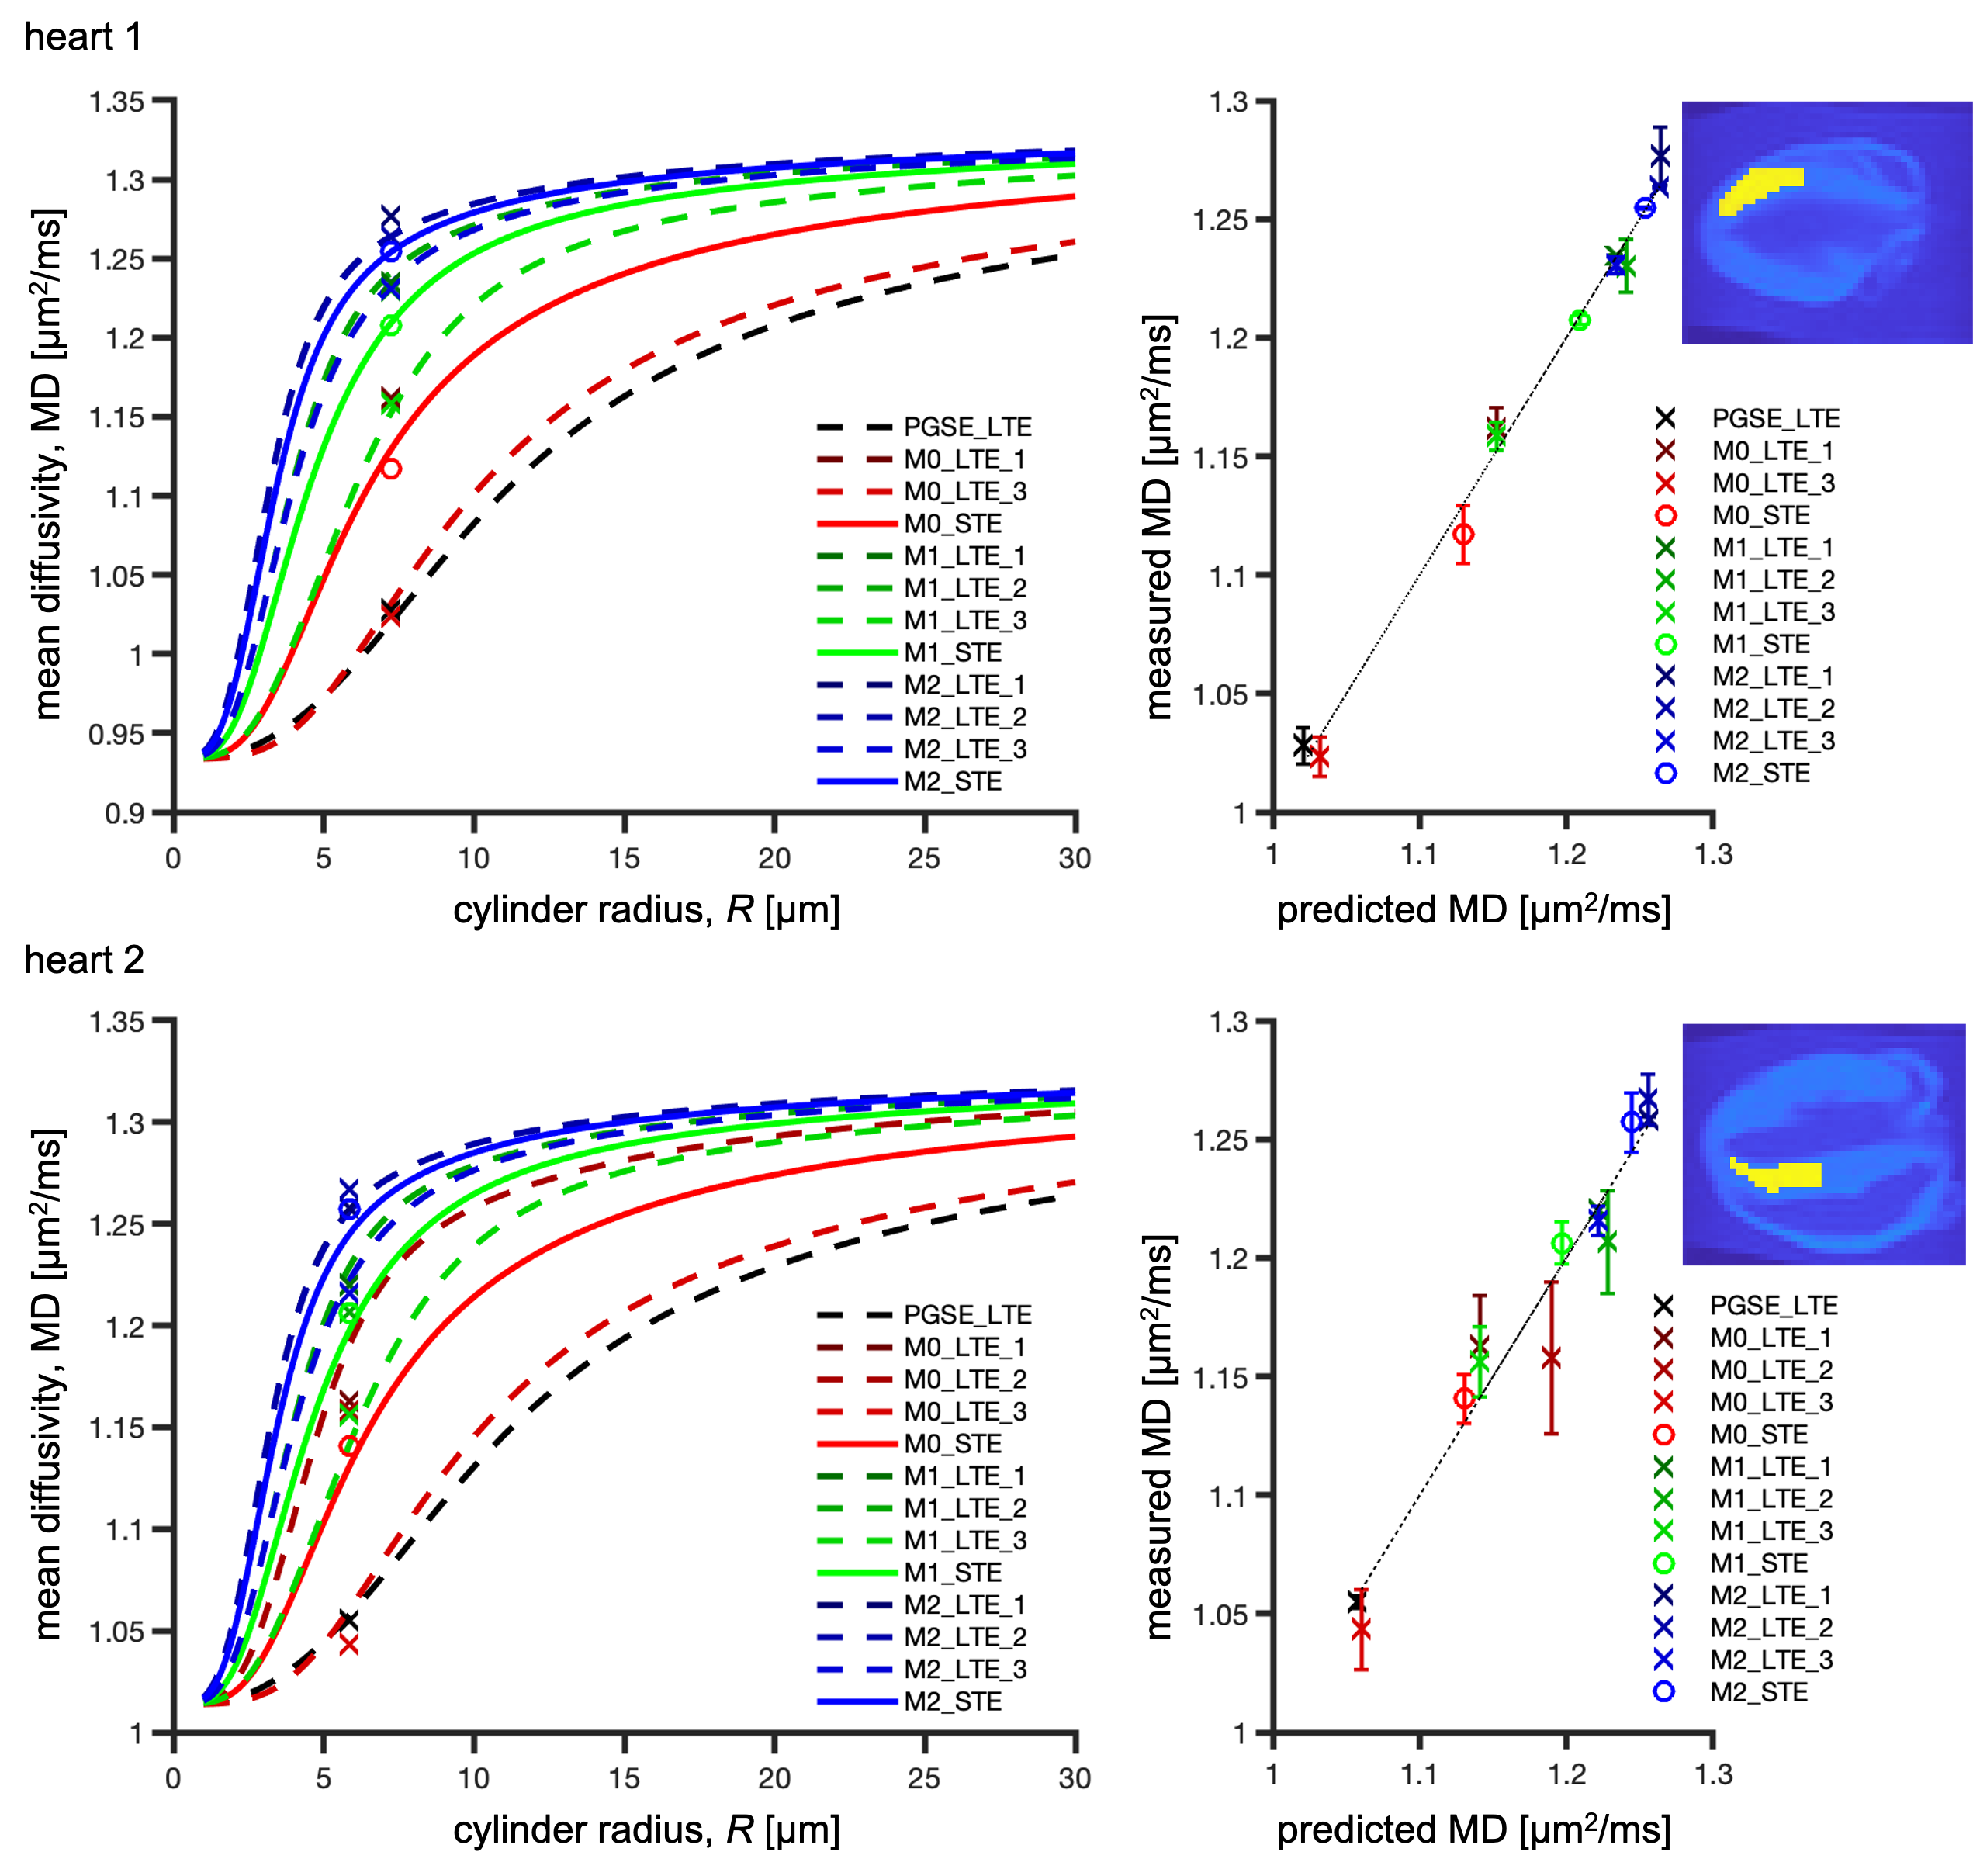
ROI average MD in the left ventricular myocardium was in the range of 0.91-1.28 µm2/ms for heart 1 and 1.04-1.27 µm2/ms for heart 2 (Figure 2). Due to sample preparation and data acquisition issues related to heart 1, only a small region of heart 1 was viable for analysis, and we had to exclude the M0-LTE2 data point.Our waveforms covered a similar range of diffusion times (frequencies) compared to a previous mouse heart study with PGSE and oscillating gradients (OGSE)28 (Figure 1). However, our experiment was not optimized for probing size, since our encoding spectra were broad and overlapping. Nevertheless, we obtained reasonable size estimates:
- heart 1 (Figure 2-top): $$$R = 7.2$$$ µm, $$$f_{\text{res}} = 0.24$$$, $$$D_{\text{h}} = 0.97$$$ µm2/ms, root mean square error (RMSE) = 0.0076 µm2/ms.
- heart 2 (Figure 2-bottom): $$$R = 5.8$$$ µm, $$$f_{\text{res}} = 0.19$$$, $$$D_{\text{h}} = 1.06$$$ µm2/ms, RMSE = 0.015 µm2/ms.
These results are consistent with our previous results in pig hearts19 and the estimated sizes correspond well to those observed in human hearts with microscopy and Coulter Channelyzer29. The differences between two hearts could be due to biological variation or differences in sample preparation.
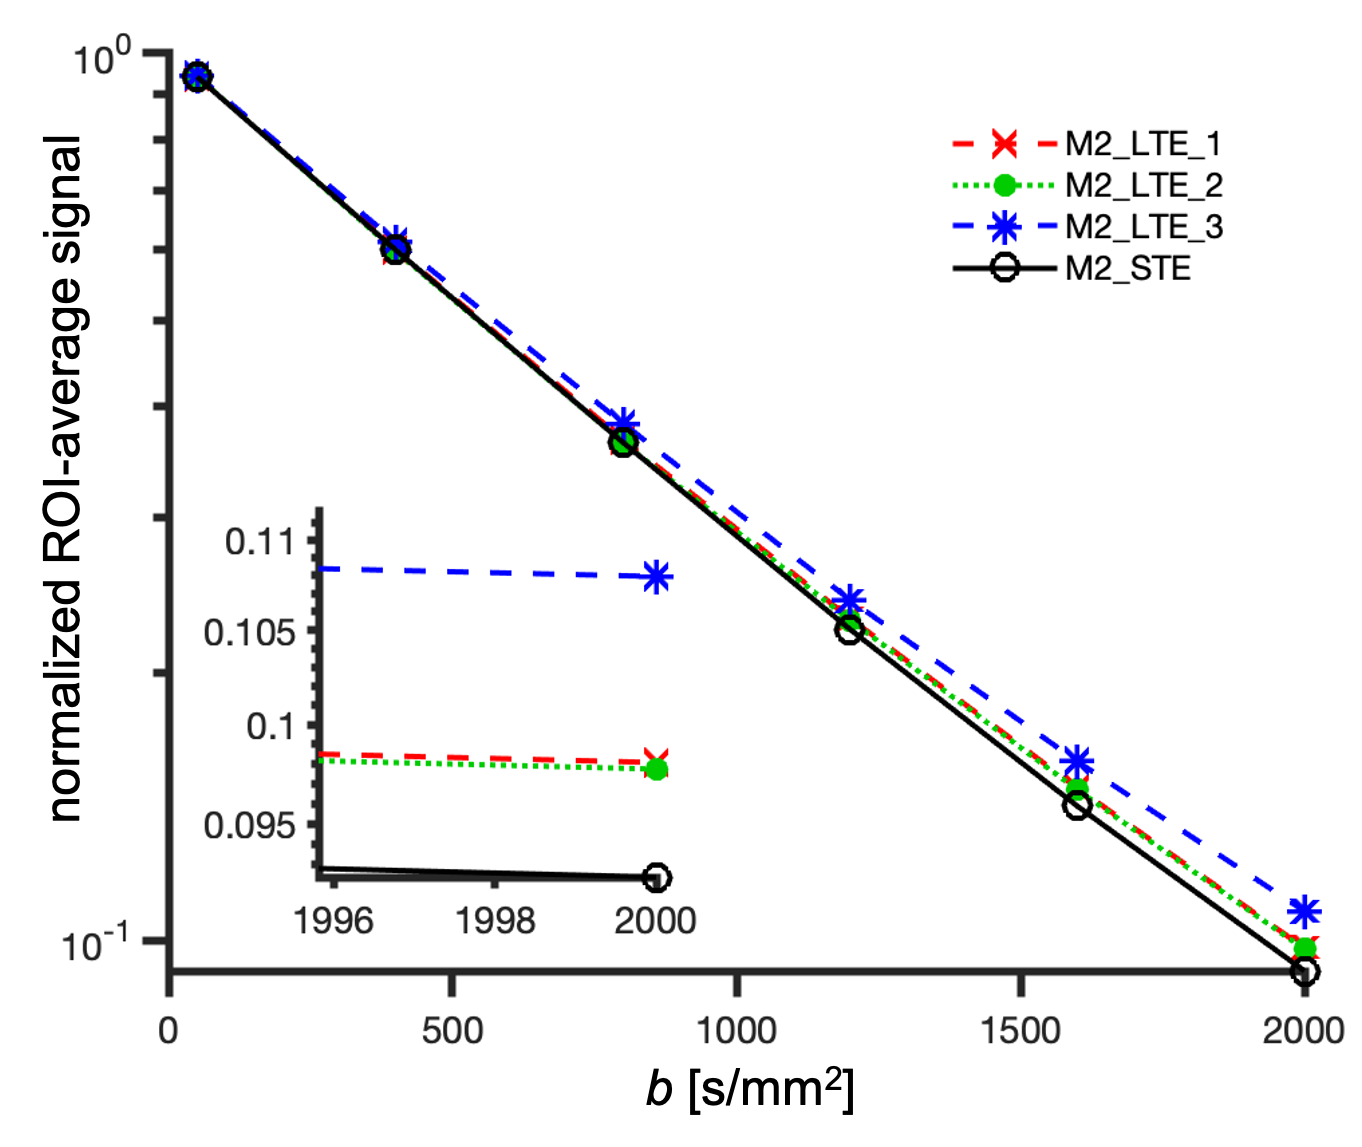
ROI average signals from M2-LTE and M2-STE are shown in Figure 3. A deviation between the STE and LTE can be attributed to microscopic anisotropy. The largest deviation occurs for M2-LTE3 (Z-axis in M3-STE), which has more power at low frequencies compared to M2-LTE1 and M2-LTE2 (see Figure 1). These results suggest a low microscopic anisotropy consistent with our additional experiments (separate abstract) allowing for simultaneous assessment of cell size and anisotropy26.
Conclusion
Our pilot ex vivo experiments in mouse hearts are a first step toward motion compensated tensor-valued encoding in vivo. We confirmed time-dependent effects on MD estimation. The results suggest the possibility for probing microstructure on a preclinical system. We are therefore encouraged to explore both ex-vivo and in-vivo on healthy and diseased mouse hearts.Acknowledgements
SL and HL have received funding from the European Research Council (ERC) under the European Union’s Horizon 2020 research and innovation programme (grant agreement No 804746). SL is supported also by Random Walk Imaging. This work was supported by the British Heart Foundation, UK (PG/19/1/34076, SI/14/1/30718). We thank Markus Nilsson for his expert inputs, and Joanna Koch-Paszkowski and Leah Khazin for their work on the sample preparation.References
1. Lasič S, Szczepankiewicz F, Eriksson S, Nilsson M, Topgaard D, Microanisotropy imaging: quantification of microscopic diffusion anisotropy and orientational order parameter by diffusion MRI with magic-angle spinning of the q-vector, Front. Phys., 2014, 2, (11), 1–14.
2. Szczepankiewicz F, Lasič S, van Westen D, Sundgren PC, Englund E, Westin C-F, Ståhlberg F, Lätt J, Topgaard D, Nilsson M, Quantification of microscopic diffusion anisotropy disentangles effects of orientation dispersion from microstructure: applications in healthy volunteers and in brain tumors., Neuroimage, 2015, 104, 241–52.
3. Westin C-F, Knutsson H, Pasternak O, Szczepankiewicz F, Kubicki M, Topgaard D, Nilsson M, Q-space trajectory imaging for multidimensional diffusion MRI of the human brain, Neuroimage, 2016, 135, (15), 345–362.
4. Szczepankiewicz F, van Westen D, Englund E, Westin CF, Ståhlberg F, Lätt J, Sundgren PC, Nilsson M, The link between diffusion MRI and tumor heterogeneity: Mapping cell eccentricity and density by diffusional variance decomposition (DIVIDE), Neuroimage, 2016, 142, 522–532.
5. Topgaard D, Multidimensional diffusion MRI, J. Magn. Reson., 2017, 275, 98–113.
6. Topgaard D, NMR methods for studying microscopic diffusion anisotropy, in Diffusion NMR of confined systems: fluid transport in porous solids and heterogeneous materials, New Developments in NMR no. 9, R. Valiullin, Ed. Cambridge, UK: Royal Society of Chemistry, 2017.
7. Topgaard D, Diffusion tensor distribution imaging, NMR Biomed., 2019, 32, (5), 1–12.
8. Nilsson M, Szczepankiewicz F, Brabec J, Taylor M, Westin CF, Golby A, van Westen D, Sundgren PC, Tensor-valued diffusion MRI in under 3 minutes: an initial survey of microscopic anisotropy and tissue heterogeneity in intracranial tumors, Magn. Reson. Med., 2020, 83, (2), 608–620.
9. de Almeida Martins JP, Tax CMW, Reymbaut A, Szczepankiewicz F, Chamberland M, Jones DK, Topgaard D, Computing and visualising intra-voxel orientation-specific relaxation–diffusion features in the human brain, Hum. Brain Mapp., 2020, (June), 1–19.
10. Wong EC, Cox RW, Song AW, Optimized isotropic diffusion weighting, Magn. Reson. Med., 1995, 34, (2), 139–143.
11. Mori S, Van Zijl PCM, Diffusion Weighting by the Trace of the Diffusion Tensor within a Single Scan, Magn. Reson. Med., 1995, 33, (1), 41–52.
12. Eriksson S, Lasič S, Topgaard D, Isotropic diffusion weighting in PGSE NMR by magic-angle spinning of the q-vector., J. Magn. Reson., 2013, 226, 13–8.
13. Jespersen SN, Lundell H, Sønderby CK, Dyrby TB, Orientationally invariant metrics of apparent compartment eccentricity from double pulsed field gradient diffusion experiments, NMR Biomed., 2013, 26, (12), 1647–1662.
14. Gamper U, Boesiger P, Kozerke S, Diffusion imaging of the in vivo heart using spin echoes-considerations on bulk motion sensitivity, Magn. Reson. Med., 2007, 57, (2), 331–337.
15. Stoeck CT, Von Deuster C, GeneT M, Atkinson D, Kozerke S, Second-order motion-compensated spin echo diffusion tensor imaging of the human heart, Magn. Reson. Med., 2016, 75, (4), 1669–1676.
16. Welsh CL, Dibella EVR, Member S, Hsu EW, Cardiac Diffusion Tensor Imaging in Rats, Trans. Med. Imaging, 2015, 34, (9), 1843–1853.
17. Lasič S, Szczepankiewicz F, Dall’Armellina E, Das A, Kelly C, Plein S, E. Schneider J, Nilsson M, Teh I, Motion compensated b-tensor encoding for in vivo cardiac diffusion-weighted imaging, NMR Biomed., 2019.
18. Szczepankiewicz F, Teh I, Dall’armellina E, Plein S, Schneider JE, Westin C-F, Motion-compensated gradient waveform design for tensor-valued diffusion encoding by constrained numerical optimization., Magn. Reson. Med., 2020, (October), 1–10.
19. Lasic S, Lundell H, Szczepankiewicz F, Nilsson M, Schneider JE, Teh I, Time-dependent and anisotropic diffusion in the heart: linear and spherical tensor encoding with varying degree of motion compensation, in Proc. 28th Intl. Soc. Magn. Reson. Med., 2020, Program no, 12–15.
20. Woessner DE, N.M.R. spin-echo self-diffusion measurements on fluids undergoing restricted diffusion., J. Phys. Chem., 1963, 67, 1365–1367.
21. Stejskal EO, Tanner JE, Spin Diffusion Measurements: Spin Echoes in the Presence of a Time-Dependent Field Gradient, J. Chem. Phys., 1965, 42, (1), 288.
22. Latour LL, Svoboda K, Mitra PP, Sotak CH, Time-dependent diffusion of water in a biological model system, Proc. Natl. Acad. Sci. U. S. A., 1994, 91, (4), 1229–1233.
23. Stepišnik J, Time-dependent self-diffusion by NMR spin-echo, Phys. B, 1993, 183, 343–350.
24. Parsons EC, Does MD, Gore JC, Modified oscillating gradient pulses for direct sampling of the diffusion spectrum suitable for imaging sequences., Magn. Reson. Imaging, 2003, 21, (3–4), 279–285.
25. Lundell H, Sønderby CK, Dyrby TB, Diffusion weighted imaging with circularly polarized oscillating gradients, Magn. Reson. Med., 2015, 73, (3), 1171–1176.
26. Lundell H, Nilsson M, Dyrby TB, Parker GJM, Cristinacce PLH, Zhou FL, Topgaard D, Lasič S, Multidimensional diffusion MRI with spectrally modulated gradients reveals unprecedented microstructural detail, Sci. Rep., 2019, 9, (1), 1–12.
27. Lundell H, Lasič S, Diffusion encoding with general gradient waveforms, in Advanced Diffusion Encoding Methods in MRI: New Developments in NMR Volume 24, D. Topgaard, Ed. Cambridge, UK: Royal Society of Chemistry, 2020, 12–67.
28. Teh I, Schneider JE, Whittington HJ, Dyrby TB, Lundell H, Temporal Diffusion Spectroscopy in the Heart with Oscillating Gradients, Proc. Intl. Soc. Mag. Reson. Med., 2017, 25, (Suppl 1), 3114.
29. Gerdes AM, Kellerman SE, Moore JA, Muffly KE, Clark LC, Reaves PY, Malec KB, McKeown PP, Schocken DD, Structural remodeling of cardiac myocytes in patients with ischemic cardiomyopathy, Circulation, 1992, 86, (2), 426–430.
Figures