3649
Comparison of DCE-MRI and FEXI in the measurement of vascular water exchange in high-grade glioma1Key Laboratory of Biomedical Engineering of Ministry of Education, College of Biomedical Engineering and Instrument Science, Zhejiang University, Hangzhou, China, 2Department of Radiology, Qilu Hospital of Shandong University, Jinan, China, 3Department of Neurosurgery, Shandong Provincial Hospital Affiliated to Shandong First Medical University, Jinan, China, 4Department of Physical Medicine and Rehabilitation, Interdisciplinary Institute of Neuroscience and Technology, The Affiliated Sir Run Run Shaw Hospital, School of Medicine, Zhejiang University, Hangzhou, China
Synopsis
Vascular water exchange is a highly sensitive marker of BBB dysfunction and a potential biomarker of metabolic activity. In this study, we compared two different MRI methods for vascular water exchange measurement, including shutter speed (SS) DCE-MRI and filter-exchange imaging (FEXI) in high-grade glioma patents. Our results demonstrated consistent vascular water exchange assessments by SS DCE-MRI and FEXI in both normal-appearing white matter and tumor.
Introduction
The blood-brain barrier (BBB) play an important role in the transfer of solutes and essential nutrients into the brain. More and more research show that many brain diseases are related to the BBB dysfunction. The water exchange across the BBB, which can be measured by MRI, maybe a highly sensitive marker of BBB dysfunction. On the other hand, water exchange across the BBB is also be reported as a biomarker of metabolic activity1. There are several MRI methods to measure the vascular water efflux rate constant (kbo), including shutter speed (SS) DCE-MRI2, arterial spin labeled (ASL) based methods3, and the recently developed filter-exchange imaging (FEXI) 4. However, there still lacks cross-validation of these different methods.In this study, we aim to explore the relation of kbo obtained from different methods, including SS DCE-MRI and FEXI. We performed the MRI comparison on high-grade glioma (HGG) patients, whose kbo shows significant reduction in tumor region in previous study5.
Methods
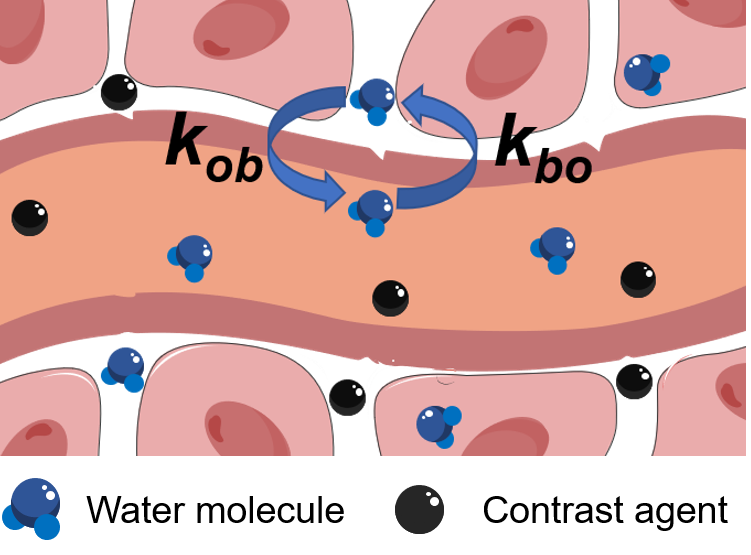
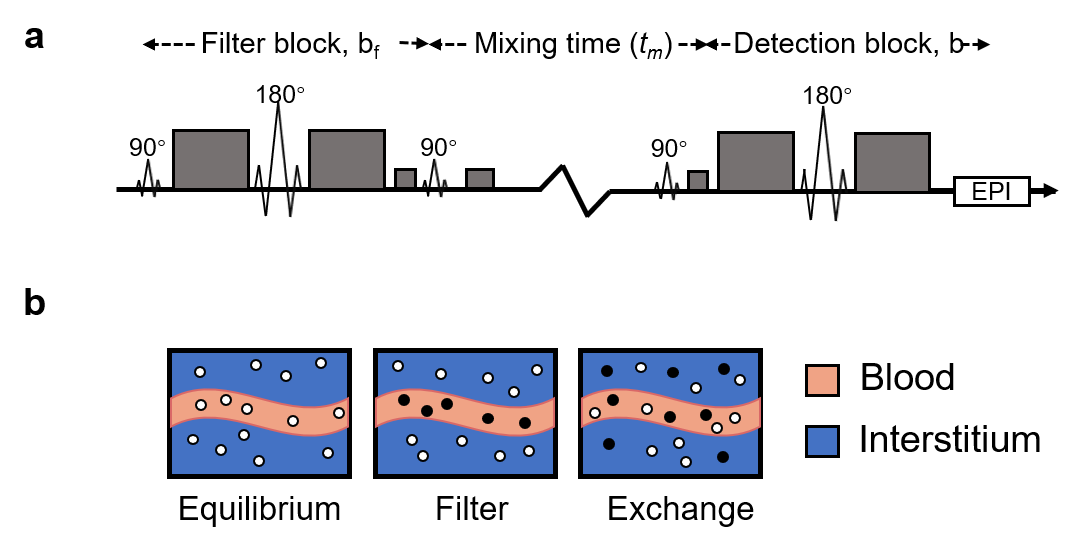
Four HGG patients were recruited for this study with approval from the ethic committee of Shangdong Province Hospital. All MRI data were acquired on a 3.0T MRI instrument (Magnetom Skyra, Siemens Healthcare, Erlangen, Germany). DCE-MRI data were acquired with 3D CAIPIRINHA-Dixon-TWIST sequence: FOV, 340×340×120 mm; resolution, 0.8×0.8×1.5 mm3; flip angle, 10°; TR, 6 msec; TE, 1.3 msec; temporal resolution, 4.5 seconds; 120 frames (~ 9 min). The shutter-speed model (SSM) is used to analyze the DCE-MRI data to obtain kbo5. As shown in Fig. 1, the key point of SS DCE-MRI is to use contrast agent to create enough transendothelial SS (defined as the longitudinal relaxation rate constants’ difference between intravascular and extravascular space). The SSM further considers the transmembrane water exchange rate constants as fitting parameters in the model5. Before SSM model fitting, a 3D gauss filter and kinetics-induced bilateral filter (KIBF) were performed to improve the image SNR6.On each subject, FEXI data were acquired before DCE-MRI. The FEXI sequence (Fig. 2a) containing two PGSE blocks separated by a mixing block (mixing time, tm). We followed the recommended FEXI protocol for kbo measurements by Bai et al4. (Fig. 2b): diffusion filter (bf) = 250 s/mm2 and two b values in the detection block (b = 0 s/mm2 and 250 s/mm2), TE in the filter block (TEf) 26ms, TE in the detection block 37ms, the directions of bf and b were always kept the same, 3.0×3.0 mm2 in plane resolution, slice thickness = 5 mm, 20 slices. Images were acquired for three tm : 25ms, 200ms, and 400ms. FEXI were also acquired with the filter inactive (bf = 0 s/mm2) and shortest tm (25ms), as the equilibrium data in the model fitting. For each tm , ADC'(tm) were computed from the two b values,$$ADC'(t_{m}) = -\frac{1}{b_{2}-b_{1}}\ln(\frac{s(t_{m},b_{2})}{s(t_{m},b_{1})}) [1]$$where b1 and b2 were the two b values in the detection block, and S(tm, b1) and S(tm, b2) are the FEXI signal at b1 and b2 , respectively. Then, the ADC'(tm) calculated at the three tm and bf = 0 were fitted to $$ADC'(t_{m}) = ADC(1-\sigma\exp(-t_{m}AXR)) [2]$$with the trust-region nonlinear least-squares algorithm in MATLAB to obtain AXR, the filter efficiency (σ) and equilibrium ADC.
Results and Discussions
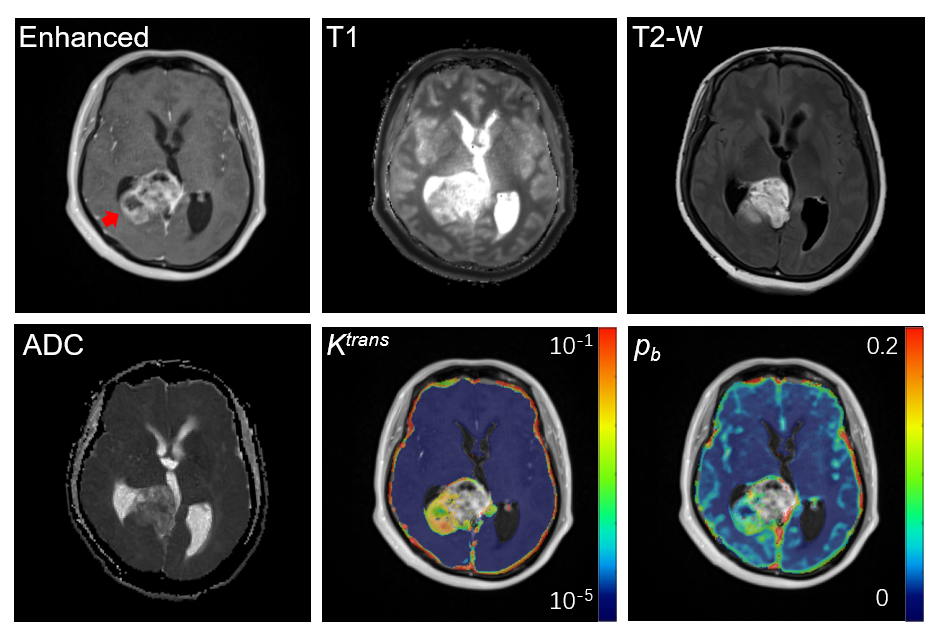
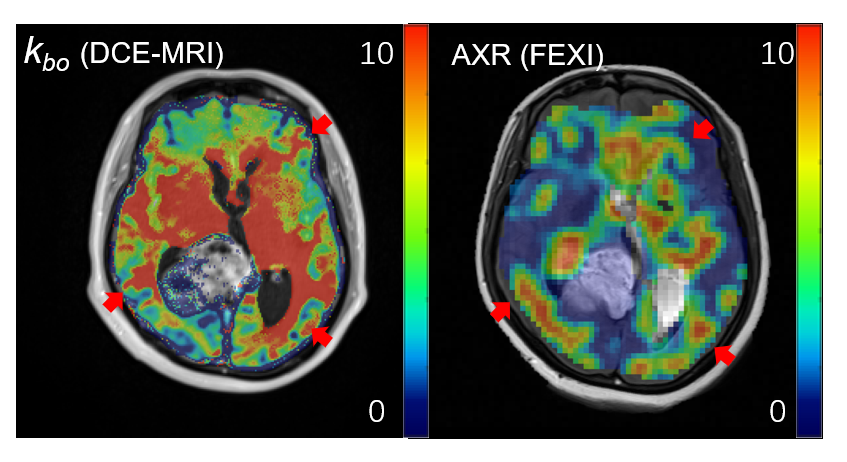
Examples of structural MRI images along with DCE-MRI parametric maps of one HGG subject are shown in Fig. 3. The tumor is located in the right temporal lobe (red arrow on enhanced image), which can be visualized in the enhanced image, T1 image, T2-weighted image, and ADC image. The tumor also shows typical hyperintensity on the SSM DCE-MRI Ktrans map and the water mole fraction for blood (pb) map. The high Ktrans in tumor reflect that the tumor BBB has been damaged causing the increased contrast agent leakage into brain tissue. And the vascular density has a significant increase in tumor as shown in pb map.Fig. 4 shows the kbo map from DCE-MRI and AXR map from FEXI of the same slice shown in Fig. 3. In visual inspection, both kbo and AXR shows significant reduction from normal-appearing tissue to tumor region. We can also observe that kbo and AXR shows similar spatial patterns as pointed with red arrows. On the other hand, AXR map shows much lower SNR than kbo map, which is due to the stimulated echo used in FEXI resulting with low SNR.
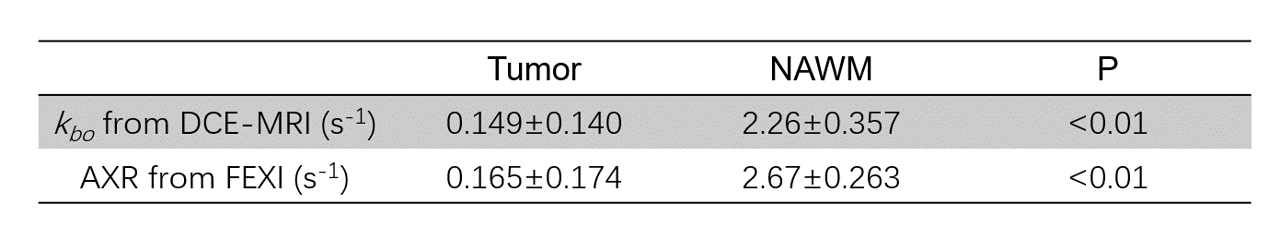
We further calculated the averaged kbo and AXR in tumor ROI and normal-appearing white matter (NAWM) ROI of the four HGG subjects (Fig. 5). kbo and AXR shows similar values in NAWM (2.26 s-1 and 2.67 s-1, respectively), which also agrees with previous findings4. In addition, both kbo and AXR shows significant reduction in tumor ROI with kbo = 0.149 s-1 (P < 0.01) and AXR =0.165 s-1 ( P < 0.01). These results suggest that these two methods report similar vascular water exchange speed in different pathological conditions and both these methods could reveal the kbo contrast in HGG.
Conclusion
By comparing AXR from FEXI with the kbo from SS DCE-MRI, we find consistent values in both NAWM and tumor ROIs in HGG patients, suggesting the consistence of these two MRI methods in measuring vascular water exchange.Acknowledgements
No acknowledgement found.References
1 Rooney, W. D., Li, X., Sammi, M. K., Bourdette, D. N., Neuwelt, E. A., and Springer, C. S. (2015), Mapping human brain capillary water lifetime: high‐resolution metabolic neuroimaging. NMR Biomed., 28, 607– 623. doi: 10.1002/nbm.3294.
2 Rooney, W. D., Li, X., Sammi, M. K., Bourdette, D. N., Neuwelt, E. A., and Springer, C. S. (2015), Mapping human brain capillary water lifetime: high‐resolution metabolic neuroimaging. NMR Biomed., 28, 607– 623. doi: 10.1002/nbm.3294
3 He, X., Wengler, K. and Schweitzer, M.E. (2018), Diffusion sensitivity of 3D‐GRASE in arterial spin labeling perfusion. Magn. Reson. Med., 80: 736-747. https://doi.org/10.1002/mrm.27058.
4 Bai R, Li Z, Sun C, et al. Feasibility of filter-exchange imaging (FEXI) in measuring different exchange processes in human brain. Neuroimage 2020; 219: 117039. 2020/06/14. DOI: 10.1016/j.neuroimage.2020.117039.
5 Bai, R., Wang, B., Jia, Y., Wang, Z., Springer, C.S., Jr, Li, Z., Lan, C., Zhang, Y., Zhao, P. and Liu, Y. (2020), Shutter‐Speed DCE‐MRI Analyses of Human Glioblastoma Multiforme (GBM) Data. J Magn Reson Imaging, 52: 850-863. https://doi.org/10.1002/jmri.27118
6 Bian Z, Huang J, Ma J, Lu L, Niu S, et al. (2014) Dynamic Positron Emission Tomography Image Restoration via a Kinetics-Induced Bilateral Filter. PLOS ONE 9(2): e89282. https://doi.org/10.1371/journal.pone.0089282
7 Sønderby, C.K., Lundell, H.M., Søgaard, L.V. and Dyrby, T.B. (2014), Apparent exchange rate imaging in anisotropic systems. Magn. Reson. Med., 72: 756-762. https://doi.org/10.1002/mrm.24957
Figures