3648
Brain microstructure at 1.5mm resolution via RMT reconstruction on a high-slew rate MAGNUS system1Radiology, NYU School of Medicine, New York, NY, United States, 2GE Research, Niskayuna, NY, United States, 3GE Healthcare, New York, NY, United States
Synopsis
A multishell diffusion neuro protocol at 1.5 mm isotropic resolution was acquired in 10 minutes with a high performance MAGNUS head gradient coil (200 mT/m with 500 mT/m/ms slew) at 3.0 T, and reconstructed using random matrix theory (RMT) denoising at the coil level. The SNR enhancement due to RMT reconstruction, and the nearly distortion-free images due to high slew rate, yield precise diffusion and kurtosis maps, fiber-dispersion, as well as microstructure parameters estimated using 3-compartment Standard Model of diffusion. We draw compartment fractions and diffusivities on fiber-tracts reconstructed based on fiber ODFs estimated by deconvolving model-based local fiber response.
Introduction
High-resolution microstructure mapping has remained the challenge for quantitative dMRI, particularly for beyond DTI methods and microstructure mapping1,2. Unfortunately, strong diffusion weightings3,4,5 or alternatives to linear diffusion encoding6,7 are impractical at high resolution due to longer echo times, resulting in decreased SNR and increased distortions8,9.Here we achieve practically anatomical, distortion-free brain DTI/DKI and microstructure maps, via a combination of exceptionally fast-slew gradients reducing echo time and distortions using the MAGNUS gradient coil (200 mT/m with 500 T/m/s)10, and the SNR-boosting random matrix theory (RMT)-based reconstruction starting from raw coil data11.
Methods
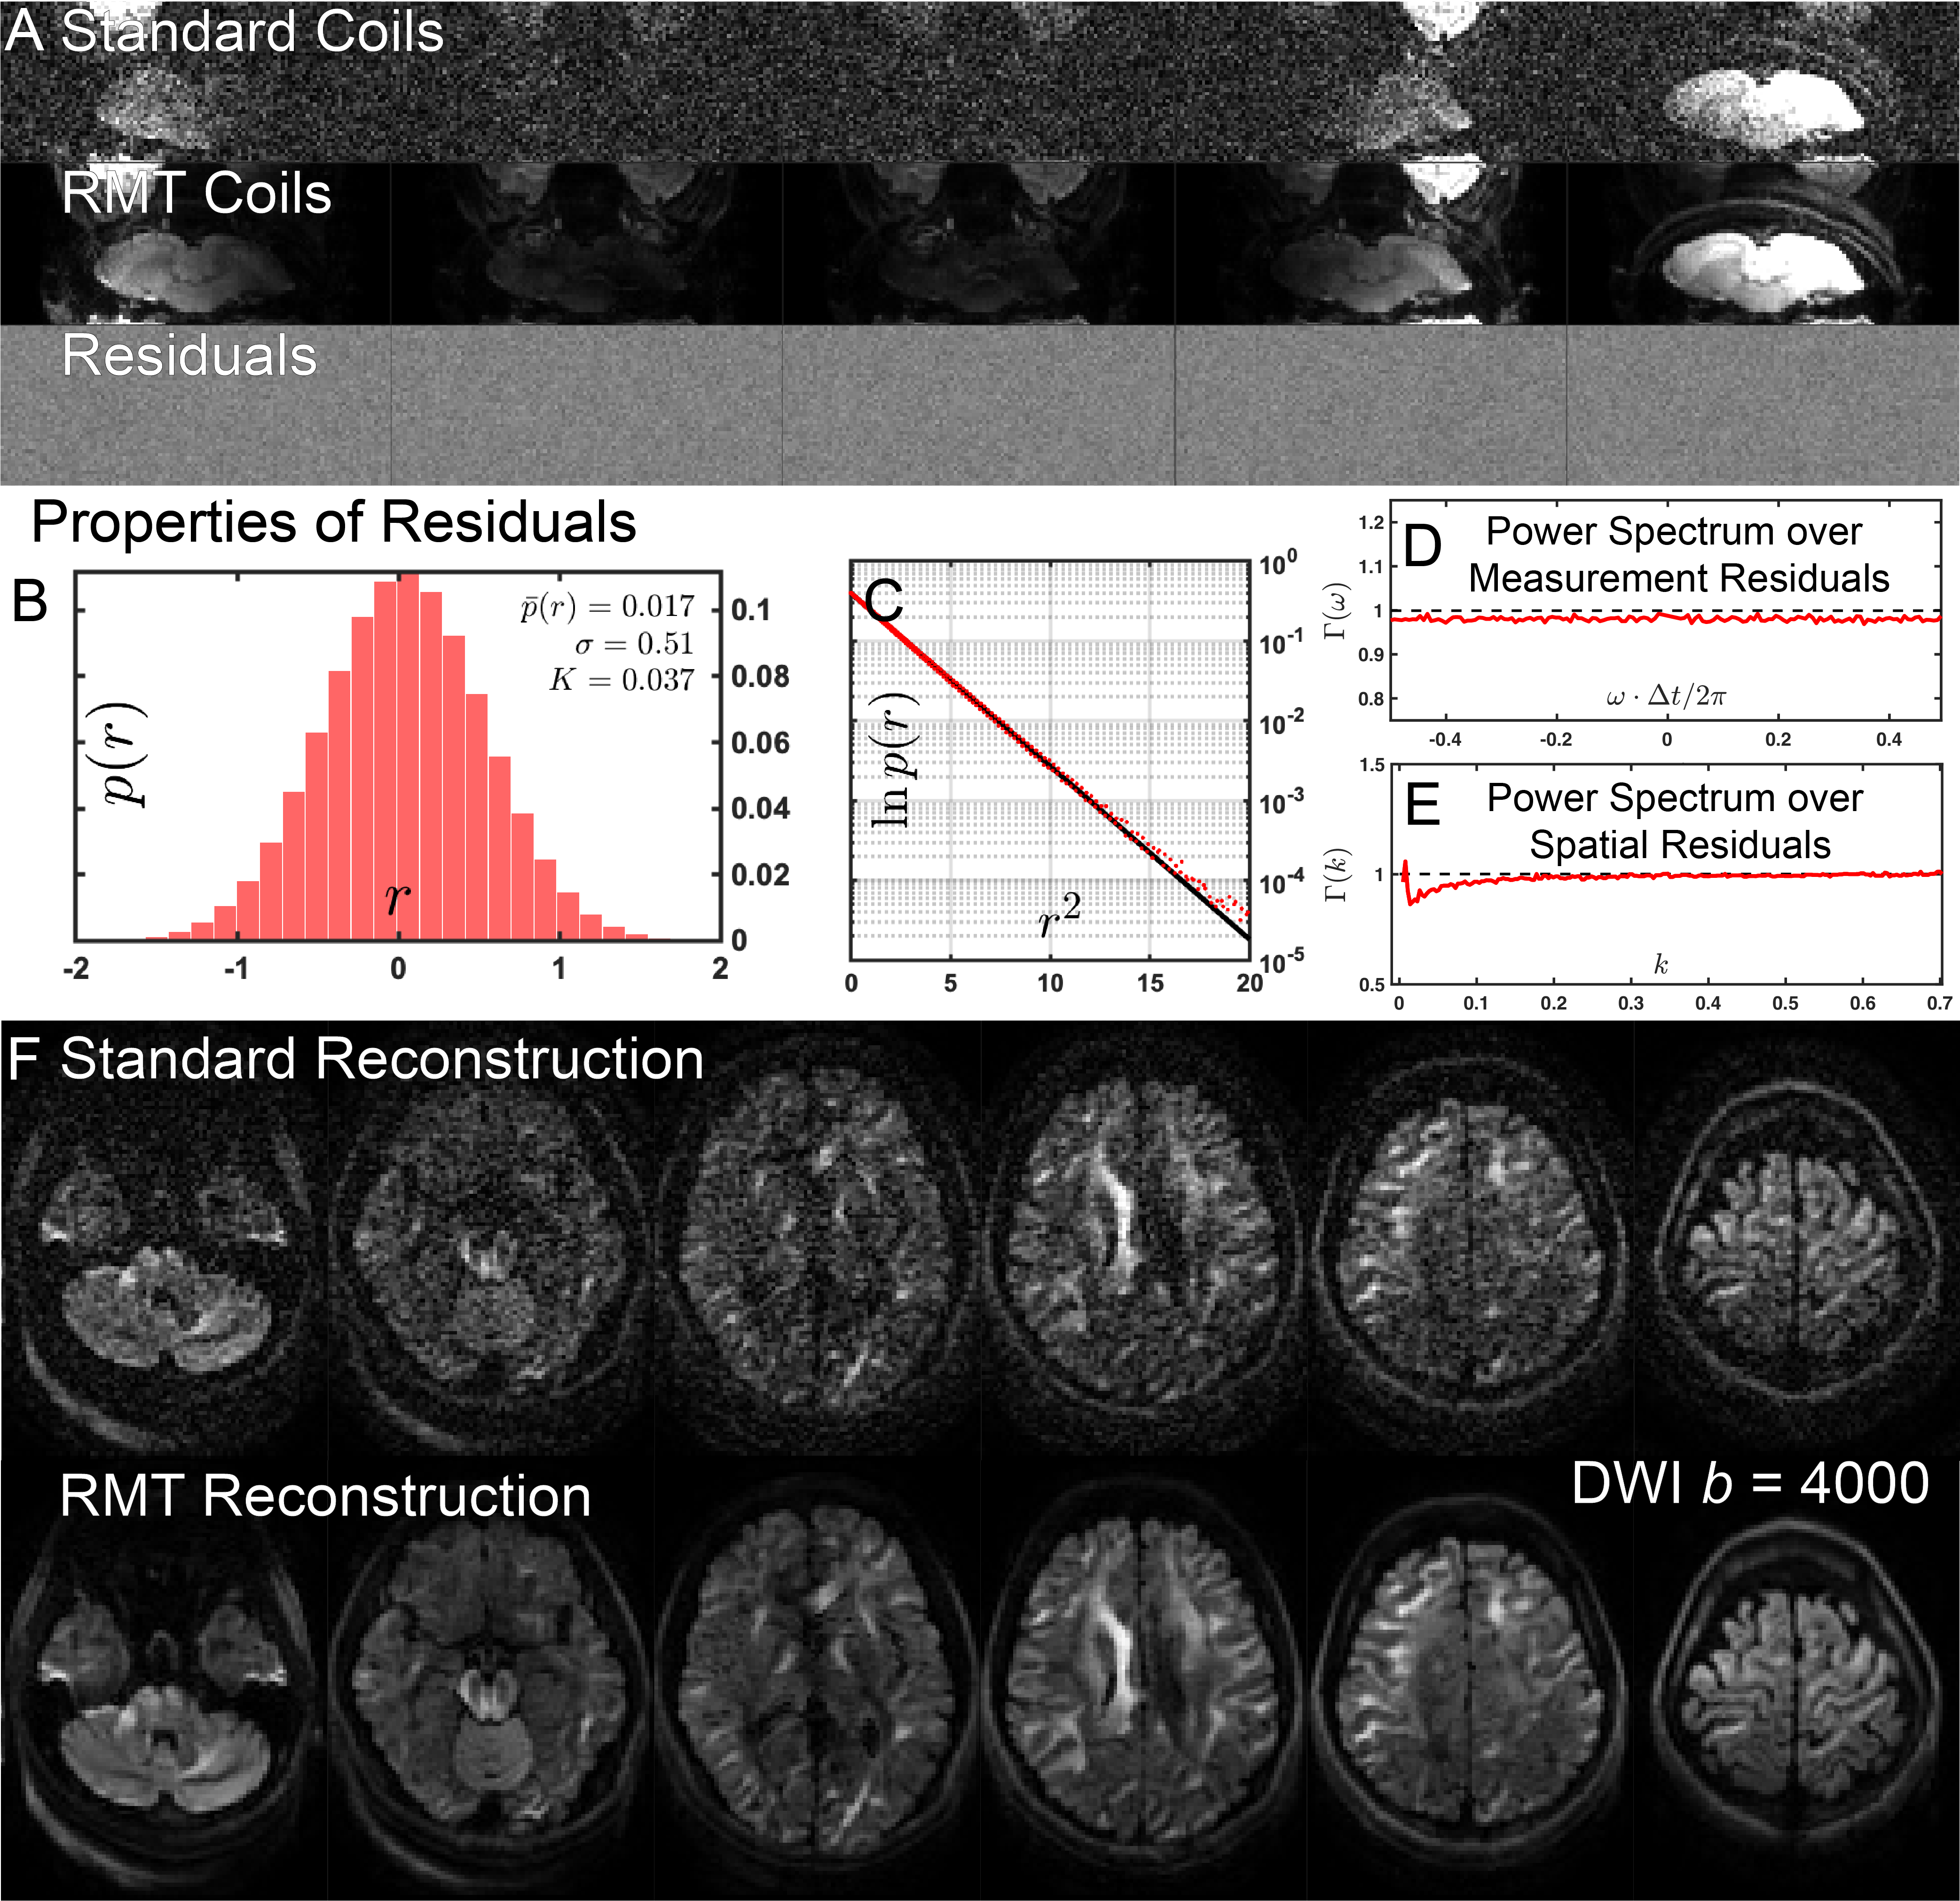
MRI: A female 29-y/o volunteer was imaged under an IRB-approved protocol with a MAGNUS gradient coil installed in a whole-body 3T system (GE SIGNA MR750) using a 32-channel head coil (NOVA Medical, Wilmington, MA, USA). The system was powered by a 1 MVA gradient driver (620 A, 1500 v). Pulsed gradient spin echo DWI EPI was acquired with 11 b=0 and $$$[30,50,60]$$$ non-collinear gradient directions at $$$b=[500,2000,4000]\,$$$s/mm$$$^2$$$. These $$$N_{Measurements}=151$$$ images were acquired with $$$1.5\times1.5\times1.5\,$$$mm$$$^3$$$ voxels over 49 slices, $$$T_R=$$$4000 ms, $$$T_E=$$$43.3 ms, bandwidth=4167 Hz/pixel, $$$R=2$$$, partial Fourier = 0.63, acquisition time = 10.1 min, EPI echo spacing = 464 $$$\mu$$$s.RECONSTRUCTION: RMT reconstruction, Fig.1, was applied to (1) decorrelate the coil noise and demodulate the phase11; (2) locally compress coil data into a virtual coil basis12, with spatially-varying $$$N_{VC}$$$ coils describing a given voxel on aliased images; (3) remove noise eigenvalues from a non-local spatial patch defined by the Marchenko-Pastur (MP) distribution13 determined from singular value decomposition of the local data matrix of $$$[N_{voxels}\cdot N_{VC}]\times[N_{Measurements}]$$$ around each voxel. DWI were reconstructed using GE Orchestra SDK tools including k-space filling approaches such as homodyne partial Fourier and ASSET.
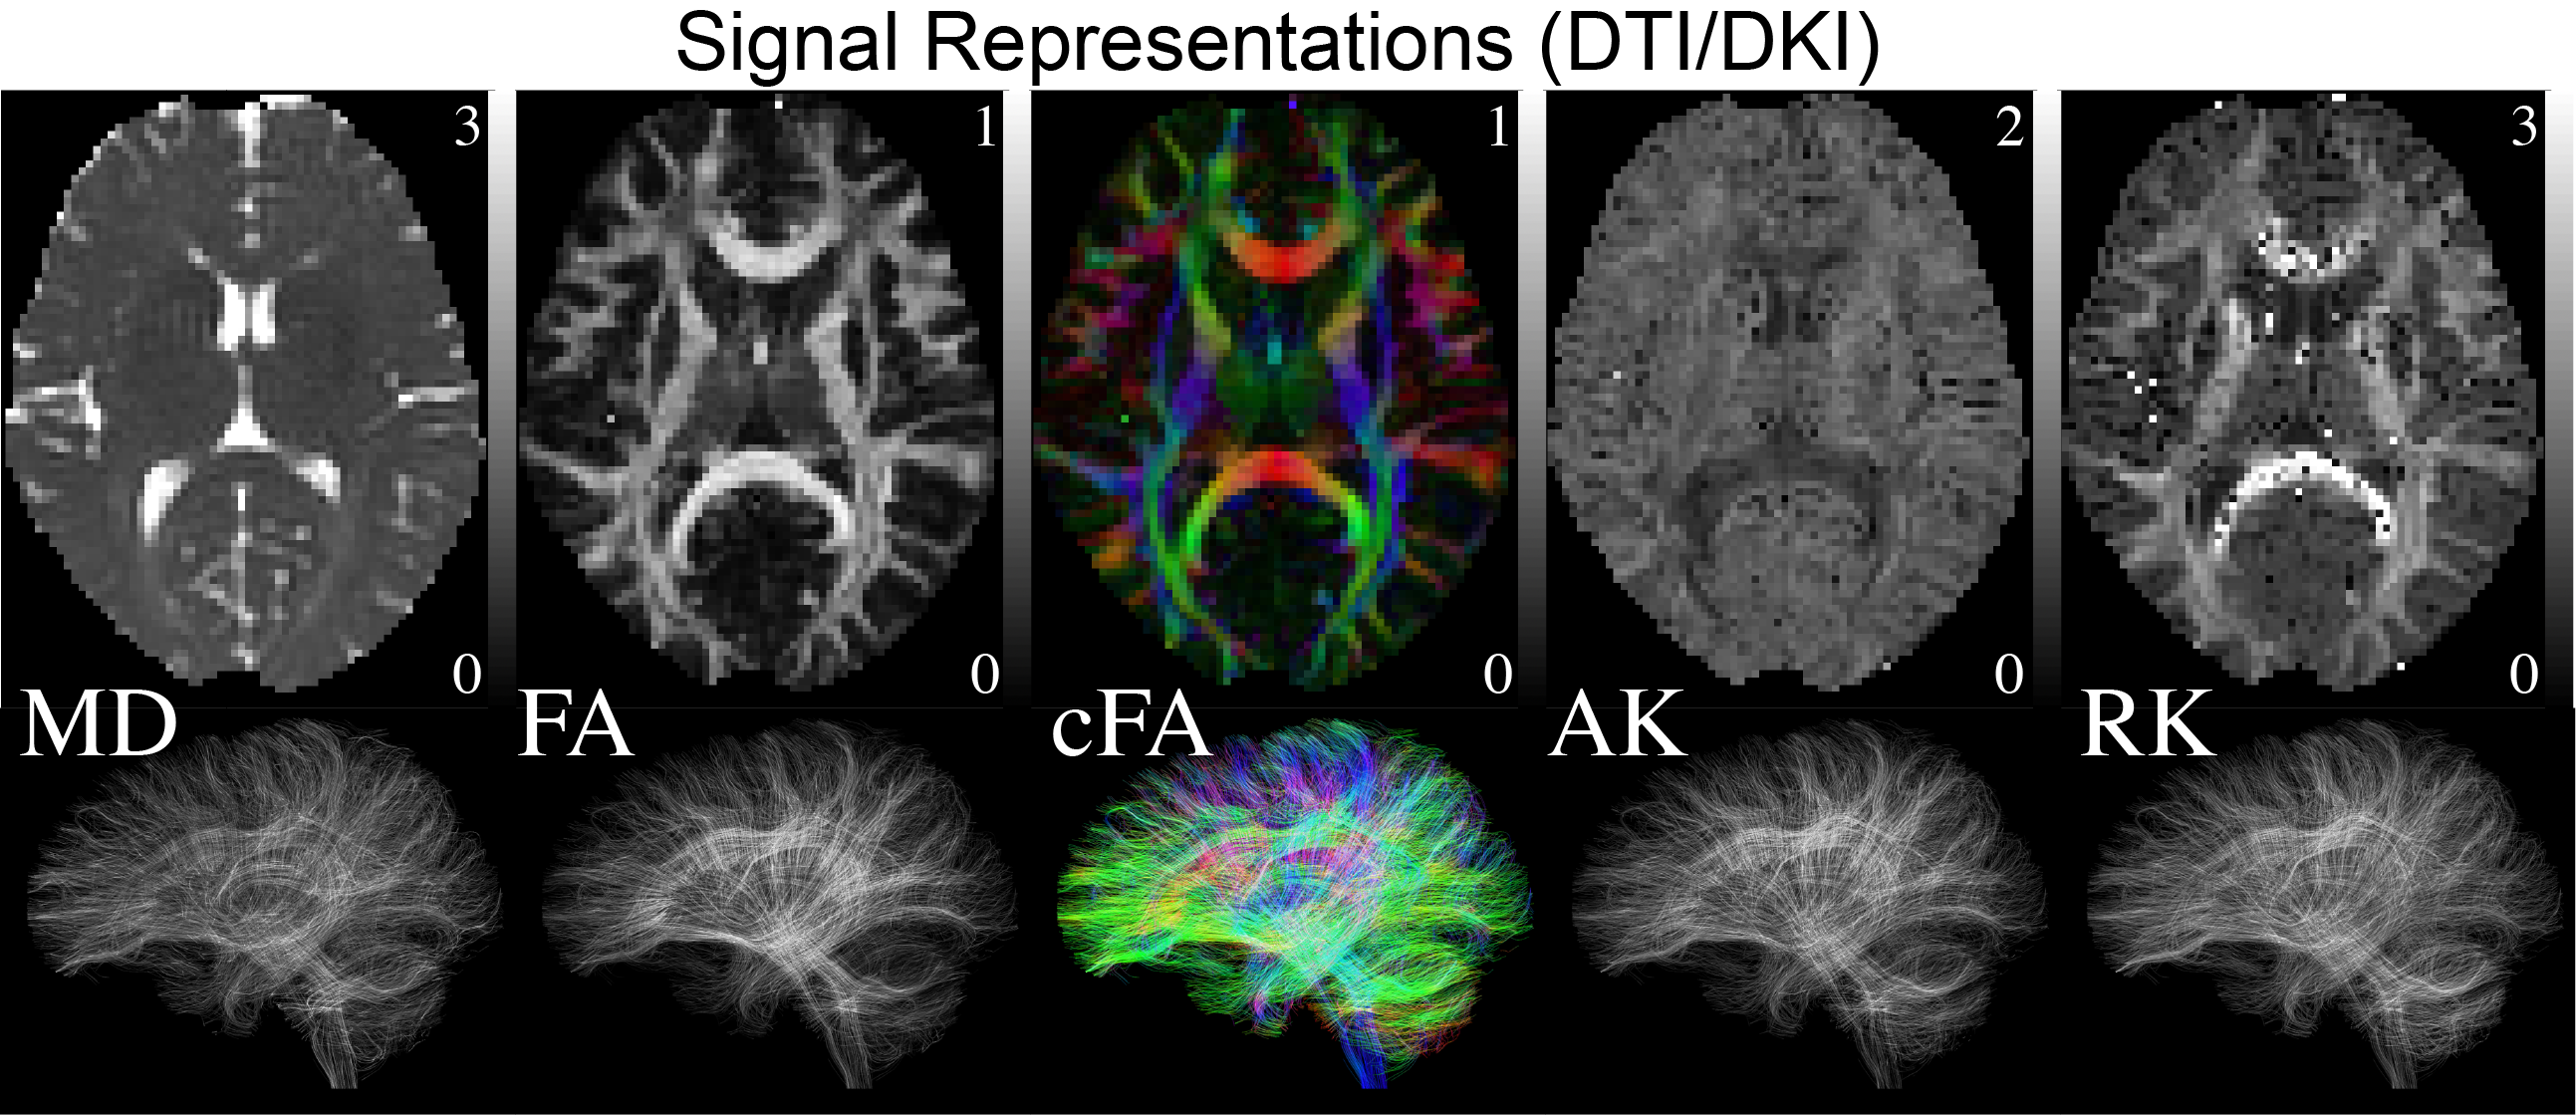
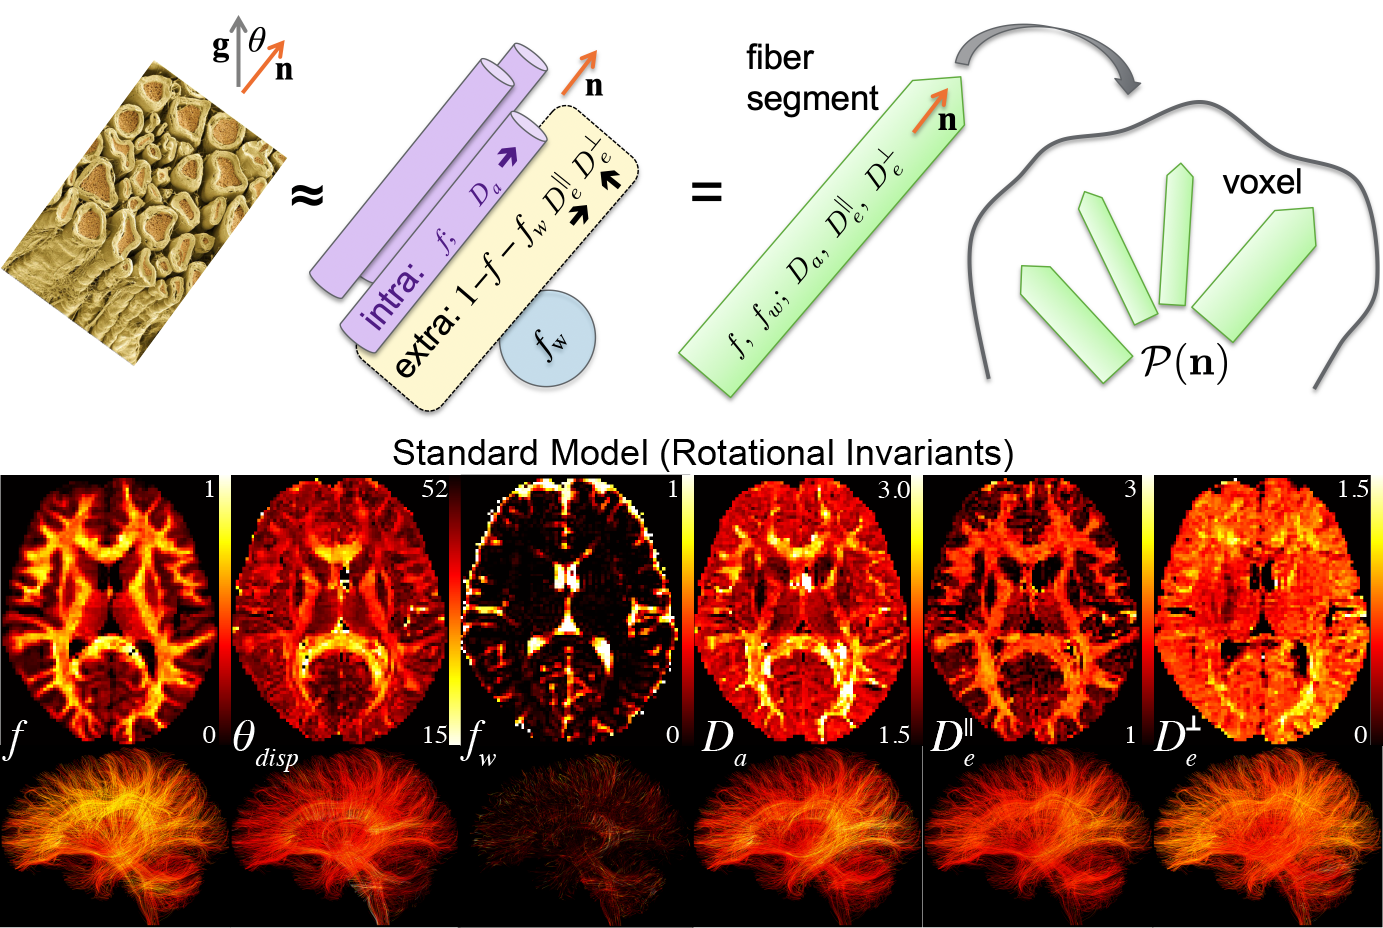
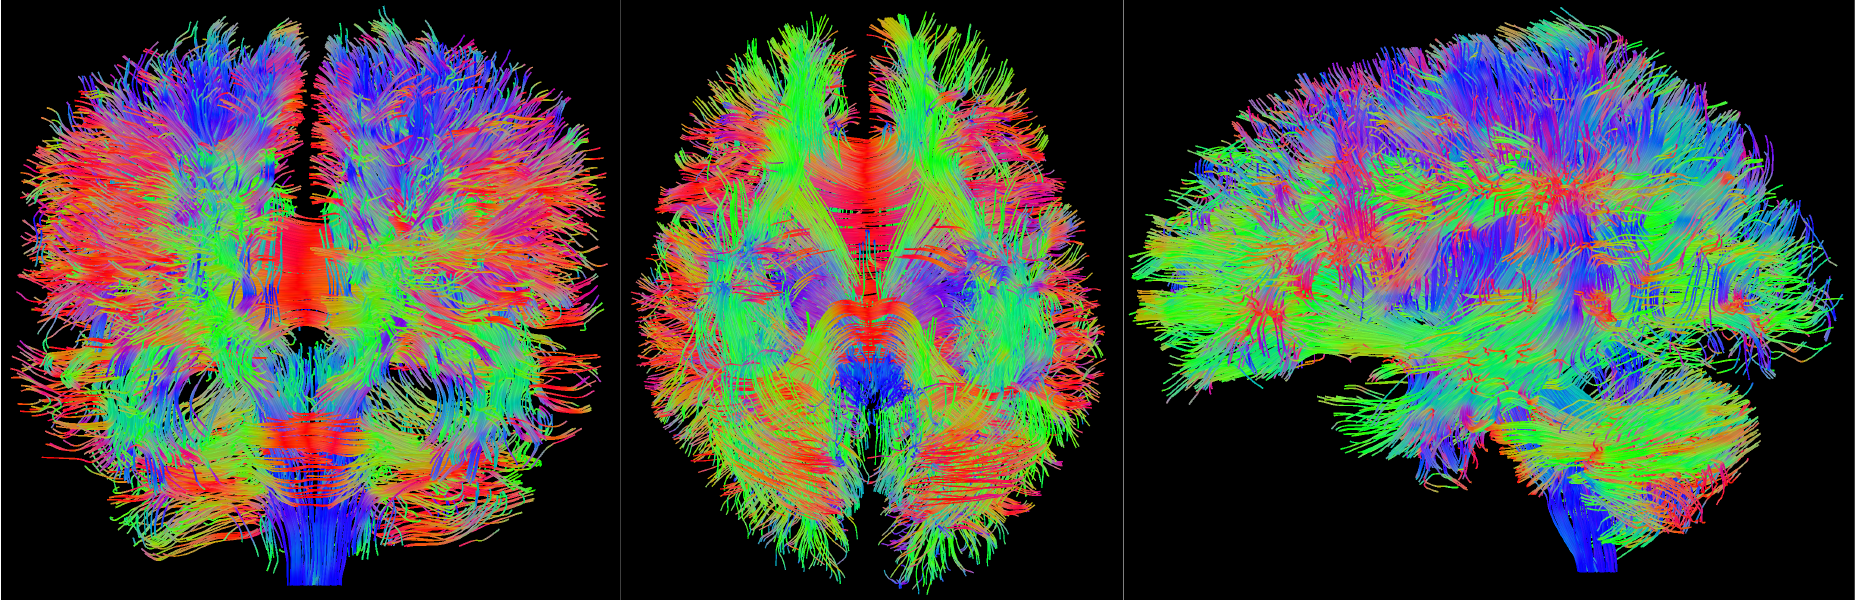
PROCESSING: No motion registration or Eddy current correction was performed. DTI/DKI maps were estimated using weighted linear least squares14 implemented in Matlab. 3-compartment Standard Model2,15,16 (SM) parameters (intra- and extra-neurite, and free water) were estimated using a supervised machine learning approach17 based on a cubic polynomial regression to map the acquired rotational invariants2,17 to the kernel parameters. Independent uniform priors were used $$$f\sim\mathcal{U}(0.05,0.95),$$$$$$\,D_a\sim\mathcal{U}(0.5,3),$$$$$$\,D_e^{||}\sim\mathcal{U}(0.5,3),$$$$$$\,\,D_e^{\perp}\sim\mathcal{U}(0.1,1.5),$$$$$$\,f_{w}\sim\mathcal{U}(0,1),\,p_2\sim\mathcal{U}(0,1)$$$, with $$$f+f_{w}\leq 1$$$. Streamline fiber tracts were generated and visualized, Figs.[2,3,5], with MRTRIX317 using ODFs generated from locally estimated SM fiber response2, Fig.4.
Results & Discussion
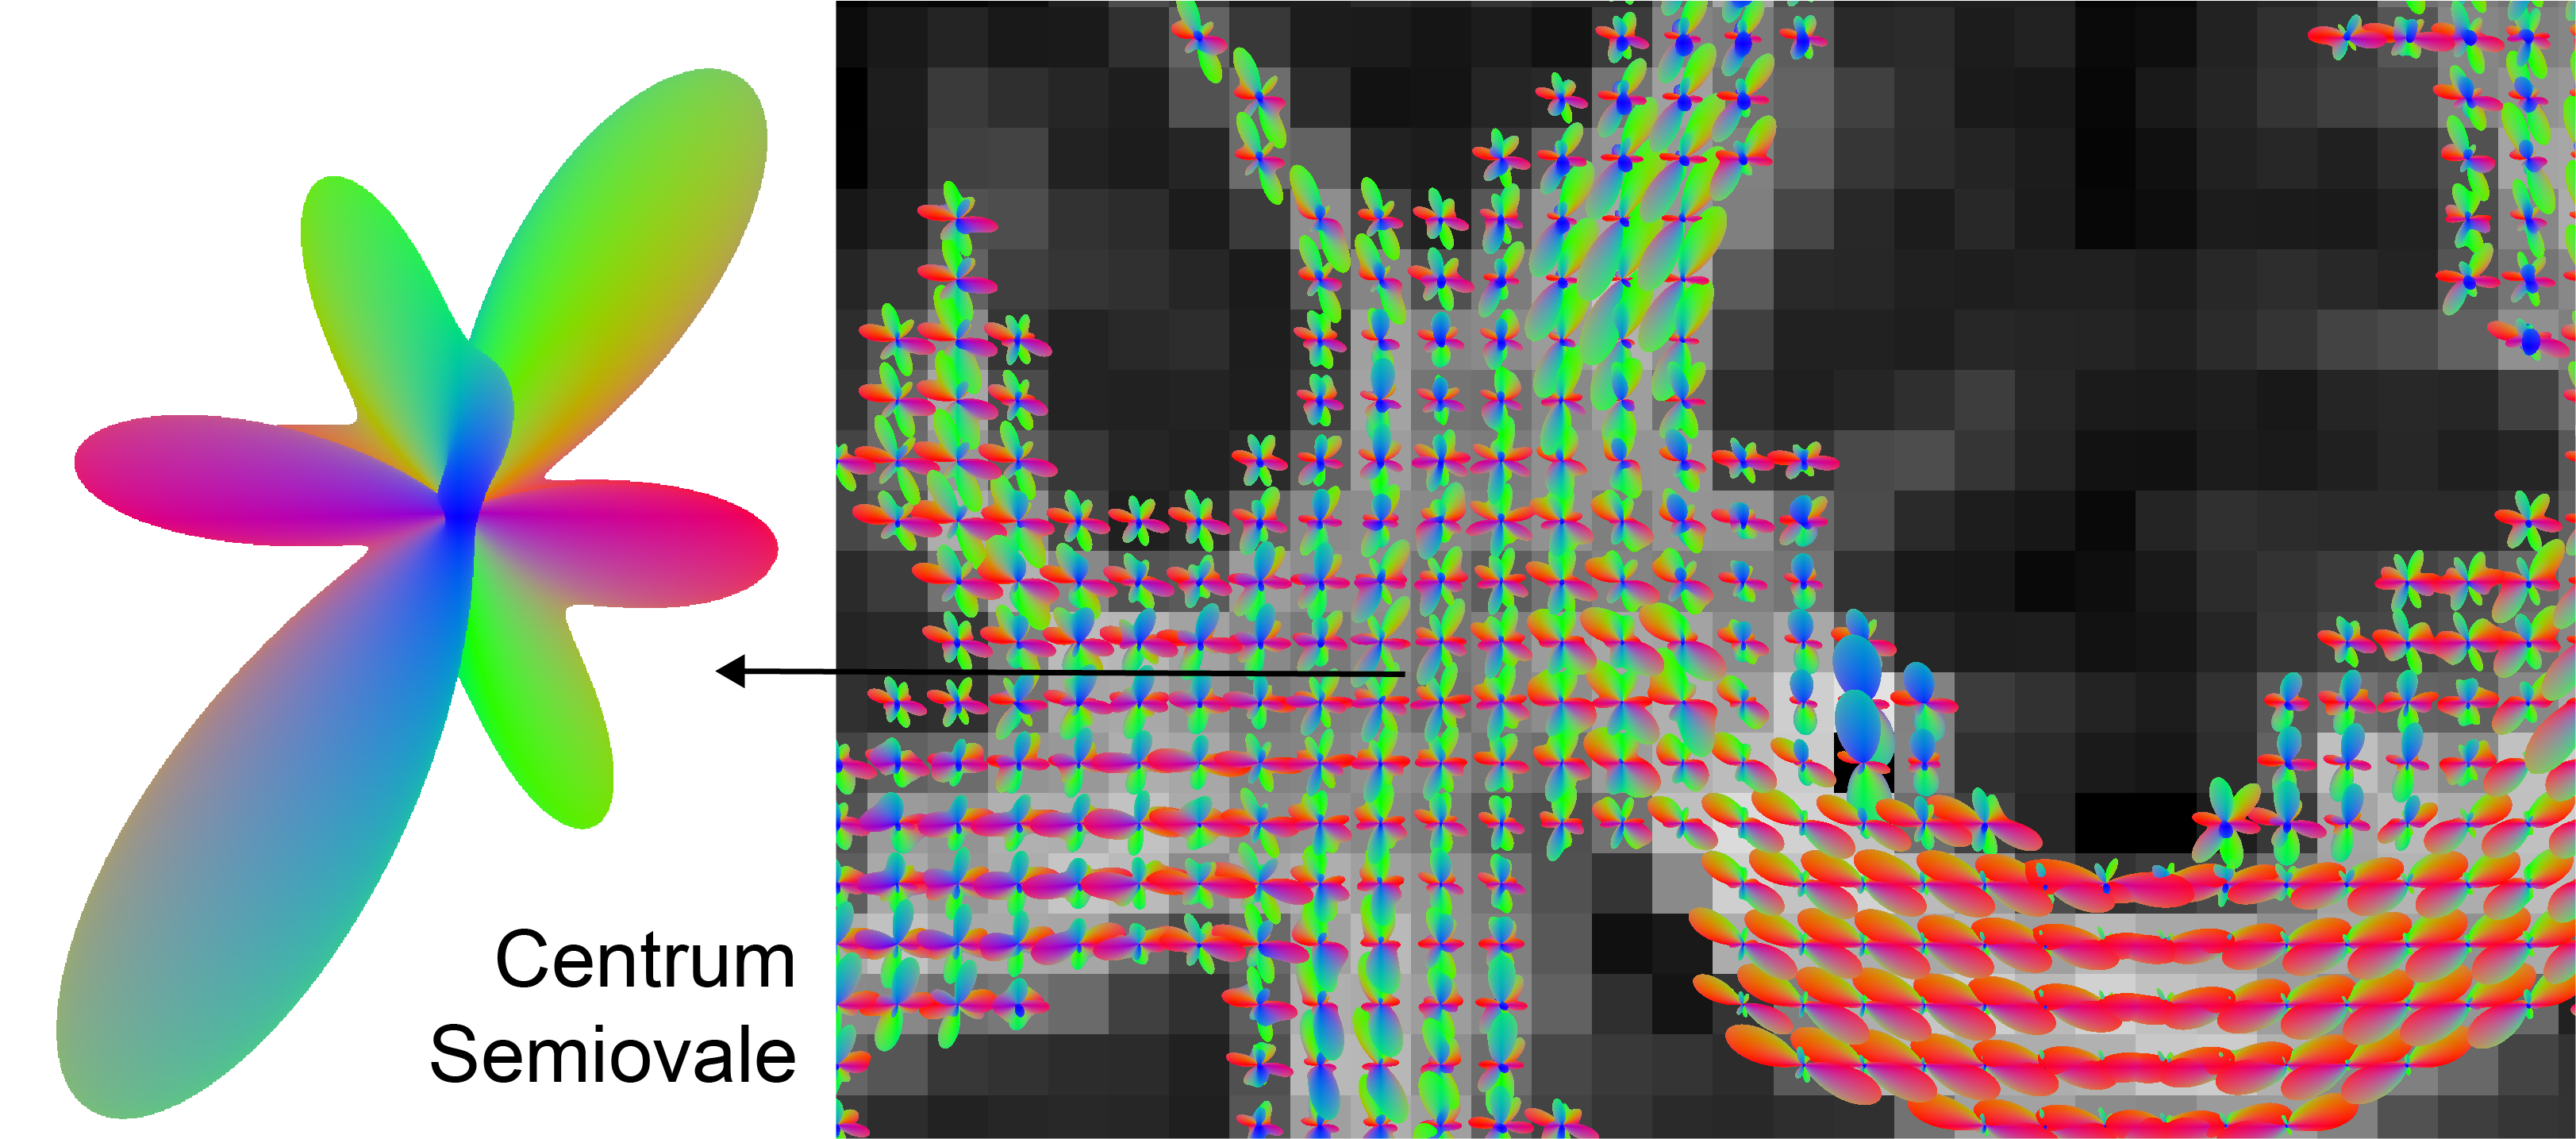
RMT processing (Fig.1) of MAGNUS DWI data yielded a 5$$$\times\,$$$improvement in SNR over a white matter ROI, thereby increasing the SNR at $$$b=0\,$$$s/mm$$$^2$$$ from 31.2 to 164.4. Moreover, the removed noise from the images maintains a Gaussian profile up to $$$4\sigma$$$ as visualized on log normalized probability distribution, $$$\ln p(r)$$$, Fig.1(C), where normalized residuals $$$r(x)=[S_\text{denoised}(x)-S_\text{noisy}(x)]/\sigma(x)$$$ are scaled by voxel-wise noise level $$$\sigma(x)$$$. We find that there is no smoothing over the q-space points dimension, as the power-spectrum $$$\Gamma(\omega)$$$ of the measurement residuals ($$$q$$$-space volumes treated as a time-series) remains flat over all frequencies, Fig.1(D). RMT does introduce a small low-spatial-frequency bias, as seen from residuals' power spectrum $$$\Gamma(k)$$$ plotted as function of the distance $$$k$$$ from the k-space center. This bias originates from the finite patch size, suggesting a subtle low pass filter effect over the images. This filtering effect is generally negligible, compared to further downstream smoothing due to k-space filling procedures. Fig.3 show that, even though only linear encoding data was used for SM parameter estimation, the high SNR at $$$b=4000\,$$$s/mm$$$^2$$$ helped provide sensitivity to distinct compartments, and thus enable multicompartmental parameter estimation in white matter (although we anticipate some dependence on the priors used). ODF deconvolution based on the local SM-based fiber response, Figs.[4,5], in principle should provide more accurate fiber orientations. Sufficient SNR yields precise ODF estimates (eg in centrum semiovale, Fig.4), and anatomically faithful tractograms (no tracts connecting hemispheres above corpus callosum, Fig.5).Acknowledgements
This work was supported by the NIH under awards number R01NS088040 (NINDS) and R01EB027075 (NIBIB), and by the Center of Advanced Imaging Innovation and Research (CAI$$$^2$$$R, www.cai2r.net), a NIBIB Biomedical Technology Resource Center: P41 EB017183.References
1. Jelescu et al. “Degeneracy in model parameter estimation for multi-compartmental diffusion in neuronal tissue,” NMR in Biomedicine29, 33–47(2016).
2. Novikov et al. “Rotationally-invariant mapping of scalar and orientational metrics of neuronal microstructure with diffusion MRI,” NeuroImage174,5518–538 (2018).
3. McKinnon et al. “Dependence on b-value of the direction-averaged diffusion-weighted imaging signal in brain,” Magnetic Resonance Imaging36,121–127 (2016).
4. Veraart et al. “NeuroImage On the scaling behavior of water10diffusion in human brain white matter,” NeuroImage185, 379–387 (2019).5. Veraart et al. “Noninvasive quantification of axon radii using diffusion mri,” eLife9, e49855 (2020).
6. Coelho et al. “Resolving degeneracy in diffusion MRI biophysical model parameter estimation using double diffusion encoding,”15Magnetic Resonance in Medicine82, 395–410 (2019).
7. Reisert et al. “A unique analytical solution of the white matter standard model using linear and planar encodings,” Magnetic Resonance in Medicine81, 3819–3825(2019).
8. Jezzard et al. “Characterization of and correction for eddy current artifacts in echo planar diffusion imaging,” Magnetic Resonance in Medicine39, 801–812 (1998).
9. Andersson et al. “How to correct susceptibility distortionsin spin-echo echo-planar images: application to diffusion tensor imaging,” NeuroImage20, 870 – 888(2003).
10. Foo et al. “Highly efficient head-only magnetic field insert gradient coil for achieving simultaneous high gradient amplitude and slew rateat 3.0t (magnus) for brain microstructure imaging,” Magnetic Resonance in Medicine83, 2356–2369(2020).
11. Lemberskiy et al. “Mri below the noise floor,” In Proceedings 28nd Scientific Meeting 0770, International Society for Magnetic Resonance in Medicine, Melbourne, Australia, 2020 (2020).
12. Lemberskiy et al. “Marchenko-Pastur Virtual Coil Compression (MP-VCC),” In Proceedings 29nd Scientific Meeting 0770, International Society for Magnetic Resonance in Medicine, Vancouver, Canada, 2021 (2021).
13. Veraart et al. “Denoising of diffusion mri using random matrix theory,” NeuroImage142, 394 – 406 (2016).
14. Veraart et al. “Weighted linear least squares estimation of diffusion mri parameters: Strengths, limitations, and pitfalls,” NeuroImage81, 335 – 346 (2013).
15. Novikov et al. “Quantifying brain microstructure with diffusion MRI: Theory and parameter estimation,” NMR in Biomedicine32, e3998 (2019).
16. Reisert et al. “Disentangling microfrom mesostructure by diffusion MRI: A Bayesian approach,” NeuroImage147, 964 – 975 (2017).
17. Tournier et al. “Mrtrix3: A fast, flexible and open software framework for medical image processing and visualisation,” NeuroImage202, 116137(2019).
Figures