3644
Multi-component diffusion technique acquisition protocol optimization for different microstructure models1NeuroImaging Unit, Scientific Institute IRCCS Eugenio Medea, Bosisio Parini, Italy, 2Neurology Department, UMC Utrecht, Utrecht, Netherlands, 3PROVIDI Lab, Image Sciences Institute UMC Utrecht, Utrecht, Netherlands, 4Radiology Unit, Fatebenefratelli Hospital, Milan, Italy
Synopsis
Complementary aspects of the tissue microstructure can be addressed using different models to quantify diffusion MRI. However, there is no consensus on a common acquisition scheme within a clinical feasible time to support the quantification of multiple models. We acquired a large dataset with multiple b-values and directions, and recursively subsampled it to identify the minimum acquisition scheme (MAS) for each model. Finally, we investigated the impact of the MAS on the parameter estimates in the main fiber bundles of the brain. This work supports the transition of advanced analyses to the clinical practice.
Introduction
Multi-shell Diffusion Weighted Imaging (DWI) has advanced our understanding of brain microstructure. Different models were proposed to analyse the DWI data, such as Diffusion Tensor Imaging (DTI)1, Free Water Elimination (FWE)2, IntraVoxel Incoherent Motion (IVIM)3, Diffusion Kurtosis Imaging (DKI)4 and Neurite Orientation Dispersion and Density Imaging (NODDI)5. Each model focuses on a different mathematical and/or physiological contribution to the DWI signal, thus a different acquisition strategy, in terms of number of shells and their b-value, is usually proposed. However, a flexible acquisition strategy, allowing the quantification of multiple DWI models, can be useful to exploit the model complementarity in both clinical and research acquisitions. Here, a Minimum Acquisition Scheme (MAS) for each model is identified and its impact on the quantified parameters is investigated.Materials and methods
Dataset: 5 healthy subjects (M/F: 2/3; age: 32.1±7.6 yo) were enrolled in the study.MRI protocol: each subject underwent a 3T MRI scan session including T1-weighted (TE=3.7 ms, TR=8.1 ms, flip angle=8°, voxel size 1x1x1 mm3) and T2-weighted (TE=330 ms, TR=2500 ms, flip angle=90°, voxel size 1x1x1 mm3) sequences, a DWI sequence (TE=70 ms; TR=9600 ms; 184 Volumes, voxel size 2.5x2.5x2.5 mm3, 12 shells (Table 1)) and a reversed phase encoding direction DWI sequence for distortion corrections (8 b0 volumes and 16 volumes with b=1000 s/mm2).
Data preprocessing: data underwent a standard preprocessing pipeline using Tortoise V3.1.26,7 including motion, eddy current and EPI distortion corrections. DrTamas8 (Tortoise) was used to compute the non-linear transformation between the subject DWI data and the HCP-DWI atlas space included in Tortoise.
Minimum protocol identification: the MAS of each model was defined as the minimum amount of shells allowing the model quantification while minimizing the model parameters estimate error. An iterative procedure was implemented: at each iteration the shell with the lowest impact on the parameter estimate error was identified and removed. The error associated with each shell was computed by averaging the Z-score of the difference between the parametric map predicted without the investigated shell (candidate map) and the reference map computed with all the suitable data (Table 1). Noticeably, the b=0 s/mm2 shell was fixed for each model (i.e. it could not be removed from the MAS). The error Z-score is determined only in white matter voxels as $$Z=\frac{X - μ}{σ}$$where $$$X$$$ is the voxel value in the candidate map, $$$μ$$$ is the voxel value in the reference map and $$$σ$$$ is the standard deviation computed in the reference map white matter.
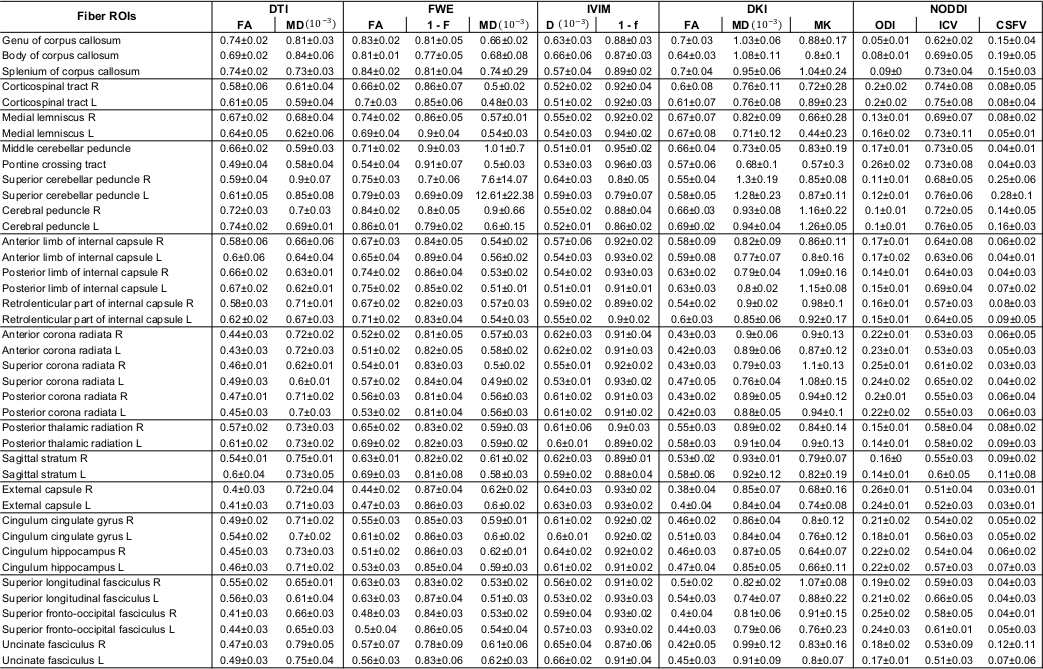
The MAS of each model was computed individually for each subject, then the population model MAS was derived by selecting the most frequently selected shells.The MAS reliability was assessed performing a Region Of Interest (ROI) analysis based on 41 ROIs included in the DWI atlas.
The reference map average, the MAS map average and the percentage error between them were calculated for each model parameter in the different ROIs.
Results
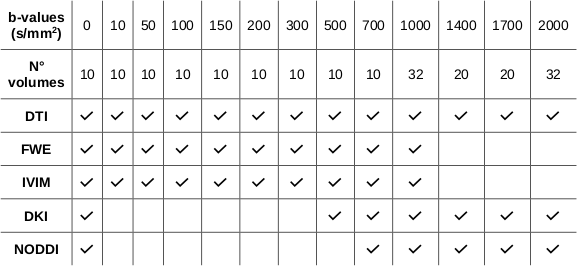
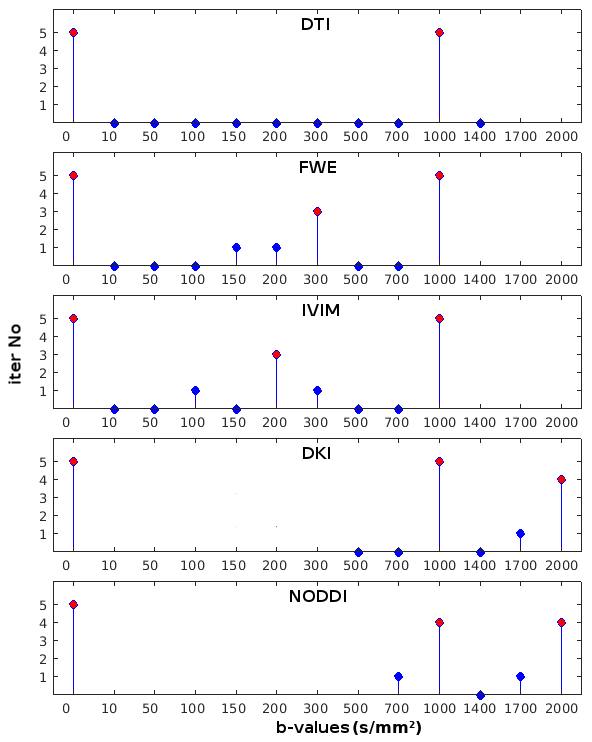
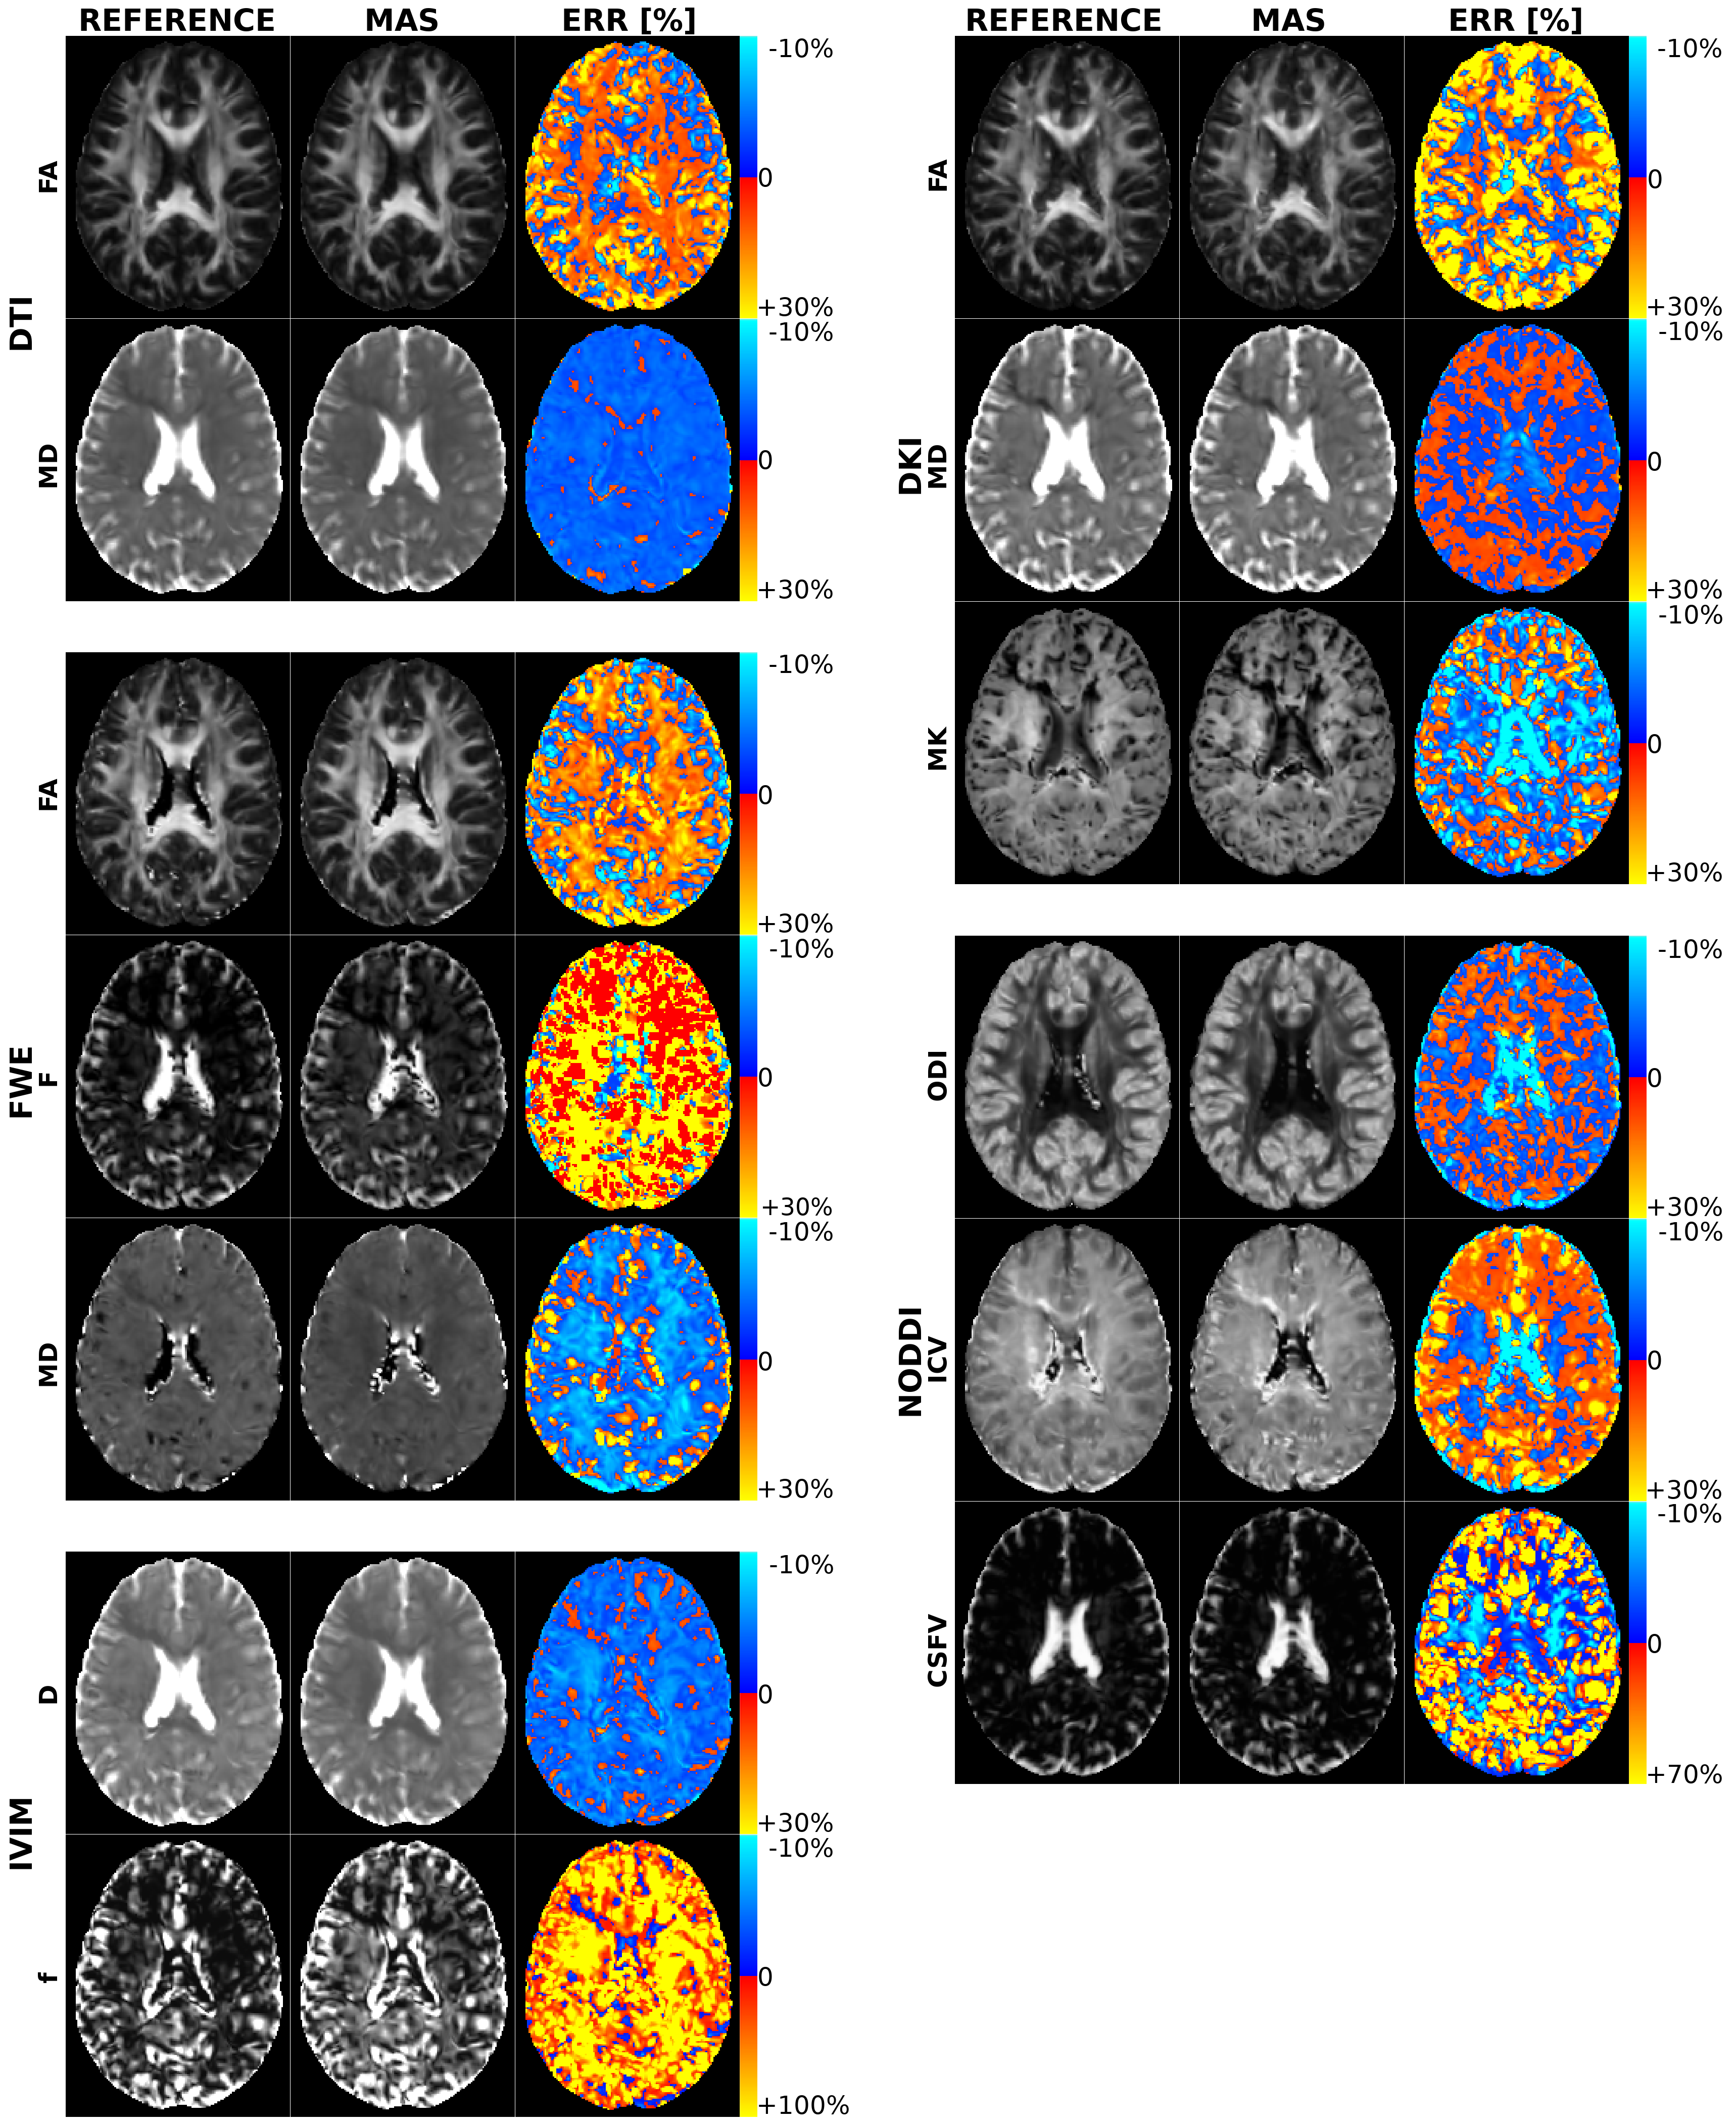
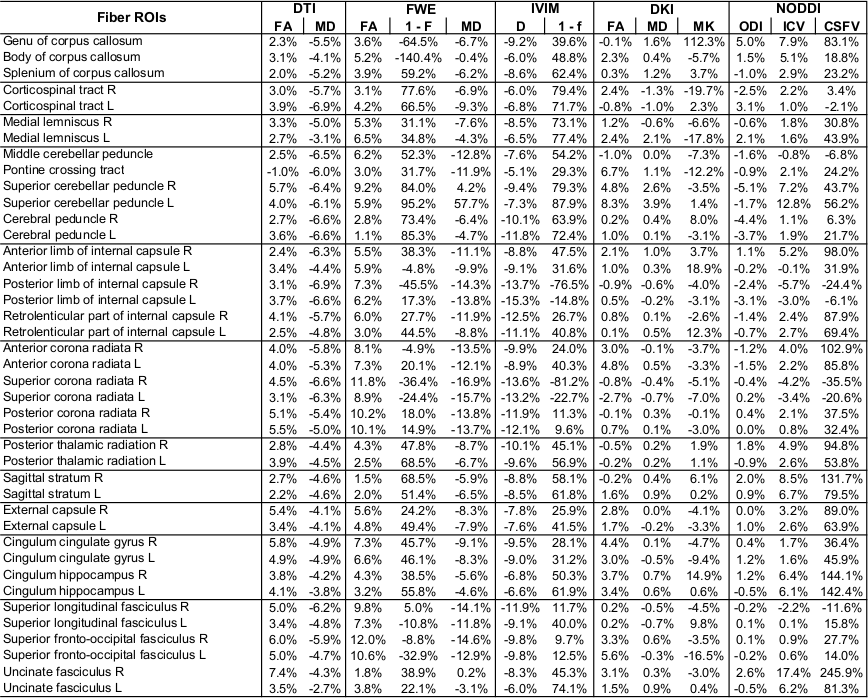
Figure 1 shows the number of times that each shell was included in the MAS for each model. Red circles were used to mark the final MAS configuration, which included b=1000 s/mm2 in all models, b=2000 s/mm2 for the DKI and NODDI models, b=300 s/mm2 for the FWE model and b=200 s/mm2 for the IVIM model. Figure 2 reports the main parametric maps obtained for each model for a representative subject when adopting the whole acquisition scheme, the MAS and their error maps.Table 2 reports the population mean and standard deviation computed in each ROI for each model main parameters using the MAS data, while Table 3 shows the percentage error with respect to the reference maps. The MAS approach allows to predict the most important parametric maps with a small estimate error (e.g. FA map average error in the ROIs is 3.7% for the DTI model, 5.8% for the FWE model, 1.7% for the DKI model). Nonetheless, some parameters (e.g. F map in the FWE model), showed very high percentage errors and are not reliable. High percentage errors are generally associated with parameters modeling the volume of small compartments, such as the free water volume F in the FWE model and the CSF volume in the NODDI model.
Discussion and conclusion
The MAS for each model was successfully identified. When the model is quantified using the proper MAS data, the percentage error in the parameter estimates with respect to the reference values is usually comparable with the population physiological variability. Some parameters showed very high percentage errors when quantified using the MAS data, owing to the extremely small nominal value computed with the whole dataset, such as F map in the FWE model. Defining the MAS of each model sets a step forward toward the flexibility of the DWI acquisition protocols supporting the quantitative analysis in a clinical feasible time, thus strengthening the transition of the advanced analyses to the clinical practice.Future works will investigate the MAS associated with multiple models and the impact of the number of directions acquired in each shell.
Acknowledgements
This project was supported by the Italian Ministry of Health funds, grant #RCR-2019-23669117_002.References
1. Basser P. J., Mattiello J., & LeBihan D. (1994). MR diffusion tensor spectroscopy and imaging. Biophysical journal, 66(1), 259-267.
2. Pasternak O., Sochen N., Gur Y., Intrator N., & Assaf Y. (2009). Free water elimination and mapping from diffusion MRI. Magnetic Resonance in Medicine: An Official Journal of the International Society for Magnetic Resonance in Medicine, 62(3), 717-730.
3. Le Bihan D., Breton E., Lallemand D., Aubin M. L., Vignaud J., & Laval-Jeantet M. (1988). Separation of diffusion and perfusion in intravoxel incoherent motion MR imaging. Radiology, 168(2), 497-505.
4. Jensen J. H., Helpern J. A., Ramani A., Lu H., & Kaczynski K. (2005). Diffusional kurtosis imaging: the quantification of non‐gaussian water diffusion by means of magnetic resonance imaging. Magnetic Resonance in Medicine: An Official Journal of the International Society for Magnetic Resonance in Medicine, 53(6), 1432-1440.
5. Zhang H., Schneider T., Wheeler-Kingshott C. A., & Alexander D. C. (2012). NODDI: practical in vivo neurite orientation dispersion and density imaging of the human brain. Neuroimage, 61(4), 1000-1016.
6. Pierpaoli C., Walker L., Irfanoglu M. O., Barnett A., Basser P., Chang L. C., Koay C., Pajevic S., Rohde G., Sarlls J. & Wu M. (2010, May). TORTOISE: an integrated software package for processing of diffusion MRI data. In ISMRM 18th annual meeting (Vol. 1597).
7. Irfanoglu M. O., Nayak A., Jenkins J., & Pierpaoli C. (2017). TORTOISE v3: Improvements and new features of the NIH diffusion MRI processing pipeline. In ISMRM Annual Meeting. Hawaii, USA.
8. Irfanoglu M. O., Nayak A., Jenkins J., Hutchinson E. B., Sadeghi N., Thomas C. P., & Pierpaoli C. (2016). DR-TAMAS: diffeomorphic registration for tensor accurate alignment of anatomical structures. Neuroimage, 132, 439-454.
Figures