3643
Towards a computational framework for task-driven experimental design
Sean C Epstein1, Timothy J.P. Bray2, Margaret A. Hall-Craggs2, and Hui Zhang1
1Department of Computer Science & Centre for Medical Image Computing, University College London, London, United Kingdom, 2Centre for Medical Imaging, University College London, London, United Kingdom
1Department of Computer Science & Centre for Medical Image Computing, University College London, London, United Kingdom, 2Centre for Medical Imaging, University College London, London, United Kingdom
Synopsis
We present a novel computational method for quantitative assessment of experimental design choices for diffusion-weighted imaging (DWI). This approach is motivated by the observation that real-world tasks (e.g. clinical classification) are assessed by metrics (e.g. AUC) that depend non-trivially on the accuracy and precision of DWI-derived parameters. The proposed method enables, for the first time, the assessment of such metrics in the course of computational experimental design. Evaluation with clinical datasets demonstrates its ability to accurately predict real-world task performance for a range of experimental designs. Illustrative use cases are presented to demonstrate its advantages over existing computational approaches.
INTRODUCTION
Computational experimental design (CED) is used to identify optimal diffusion-weighted imaging (DWI) acquisitions for quantifying tissue microstructure1–5. It is the in-silico process by which experimental design choices are proposed, quantitatively assessed, and optimised. Assessment is central to this process and, in current practice, involves evaluating an experiment’s ability to faithfully recover microstructural parameters of interest1–5. Such assessment may be ill-suited to contexts, such as clinical classification, where outcome does not depend on parameter accuracy or precision alone, since current assessment metrics do not evaluate task performance. This work proposes a novel assessment methodology for CED that addresses this shortcoming. We simulate complete DWI experiments, explicitly linking experimental design choices to task performance. Our methodology is (1) validated against two clinical datasets, and (2) shown to outperform existing CED assessment for even simple clinical classification tasks. The proposed pipeline, which can be straightforwardly incorporated into current CED practice, can also be naturally extended beyond experimental assessment; it constitutes the first step towards a unifying task-driven CED framework.THEORY
Given a set of experimental design choices, the proposed pipeline predicts performance using a task-appropriate quantitative summary metric. For classification tasks, as presented below, the relevant metrics are receiver operating characteristic (ROC) curves and their area under the curve (AUC). The pipeline’s structure is shown in Figure 1; it takes three inputs: (I1) a quantitative task, (I2) information about associated tissue microstructure(s), and (I3) candidate experimental design choices. These inputs are combined to synthesise (P1) and sample (P2) noisy DWI data, estimate DWI model parameters (P3), and evaluate task performance (P4). Given a wide range of competing candidate experimental designs, the pipeline can predict the combination of DWI model, acquisition scheme, and parameter-estimation method that maximises task performance.METHODS
Two experiments were performed: (E1) a validation of our pipeline’s ability to accurately predict real-world task performance, and (E2) a demonstration of the benefits offered by these accurate predictions. Both experiments were based around spondyloarthritis (SpA), an inflammatory disease affecting bone marrow around the sacroiliac joints. Spondyloarthritis was chosen because (i) it is assessed with DWI (ii) there is an established literature providing the inputs required by the proposed pipeline.E1: validation
We identified two clinical datasets for which classification task performance was either published or could be computed: (D1) an in-house 28-patient dataset6 split across two SpA subtypes and analysed for one task, and (D2) an external 41-patient dataset7 split across three SpA subtypes, which was not available for analysis but which reported ROC/AUC for three tasks.
All tasks involved classifying mean ROI parameter estimates as belonging to one of two SpA subtypes. For each dataset, our pipeline mirrored real-world experimental design choices (Table 1) and predicted task-specific ROC/AUC values.
Our in-silico predictions were validated across multiple microstructure models (dataset D1) and multiple model parameters (dataset D2). This was done in two ways: (C1) by simulating large patient populations (1000 x clinical dataset size), and (C2) by matching real-world study size through repeated sub-sampling of the (C1) simulated data.
E2: benefits over current practice
Two illustrative classification tasks were chosen to demonstrate the advantages our pipeline offers over current CED assessment. Pipeline settings are shown in Table 1: for clarity, tissue parameters were chosen such that only one parameter varied between sub-types per task. Classification performance was assessed for different (a) models and (b) fitting methods. Note that any situation where the optimal choice of model or fitting method is found to be task-specific represents a failure of current task-agnostic CED practice.
RESULTS & DISCUSSION
Figure 2 compares our Task 1-3 predictions to groundtruth clinical ROC curves, and shows that our pipeline accurately predicts (a) the qualitative form of the ROC curves, (b) the relative performance of different experimental settings, and (c) the absolute performance (AUC) of each experimental design. These findings are replicated for Task 4 in Figure 3. Together, they show not only that our method accurately informs optimal task-specific design choices, but also that it may be able to quantitatively assess and adjust such choices (e.g. acquisition time) to achieve target, clinically-required task performance.Figure 4 shows the advantages our pipeline offers over existing CED assessment. It demonstrates that, within a single disease, different classification tasks may be best served by different (a) models and (b) model fitting methods: for Task 5, the optimal model is IVIM, whereas for Task 6 it is ADC; within IVIM, the optimal fitting method varies between Tasks 5 and 6. Such granular, task-specific assessment, naturally built into our pipeline, is inaccessible within current CED practice.
CONCLUSIONS
We propose a novel computational method for assessing DWI experimental designs, and validate its ability to accurately predict DWI task performance associated with specific experimental designs.Our pipeline can simply replace the assessment stage in current CED practice. However, it naturally lends itself to being incorporated into an overarching task-driven CED framework: combining the proposal of candidate experimental designs with experimental optimisation, using the presented work as an accurate, task-specific optimisation metric.
Acknowledgements
This work is supported by the EPSRC-funded UCL Centre for Doctoral Training in Medical Imaging (EP/L016478/1). TJPB is supported by an NIHR Clinical Lectureship.References
- Lampinen B, Szczepankiewicz F, van Westen D, et al. Optimal experimental design for filter exchange imaging: Apparent exchange rate measurements in the healthy brain and in intracranial tumors. Magn Reson Med. 2017;77(3):1104-1114. doi:10.1002/mrm.26195
- Alexander DC. A general framework for experiment design in diffusion MRI and its application in measuring direct tissue-microstructure features. Magn Reson Med. 2008;60(2):439-448. doi:10.1002/mrm.21646
- Slator PJ, Hutter J, Ianus A, et al. A Framework for Calculating Time-Efficient Diffusion MRI Protocols for Anisotropic IVIM and An Application in the Placenta. In: Springer, Cham; 2019:251-263. doi:10.1007/978-3-030-05831-9_20
- Lemke A, Stieltjes B, Schad LR, Laun FB. Toward an optimal distribution of b values for intravoxel incoherent motion imaging. Magn Reson Imaging. 2011;29(6):766-776. doi:10.1016/J.MRI.2011.03.004
- Jalnefjord O, Montelius M, Starck G, Ljungberg M. Optimization of b-value schemes for estimation of the diffusion coefficient and the perfusion fraction with segmented intravoxel incoherent motion model fitting. Magn Reson Med. 2019;82(4):1541-1552. doi:10.1002/mrm.27826
- Bray TJP, Bainbridge A, Sakai N, Hall-Craggs MA, Zhang H. An Information-based Comparison of Diffusion Attenuation Models in Normal and Inflamed Bone Marrow. NMR Biomed. 2020. doi:10.1002/nbm.4390
- Zhao Y, Li S, Liu Z, et al. Detection of Active Sacroiliitis with Ankylosing Spondylitis through Intravoxel Incoherent Motion Diffusion-Weighted MR Imaging. Eur Radiol. 2015;25(9):2754-2763. doi:10.1007/s00330-015-3634-2
Figures
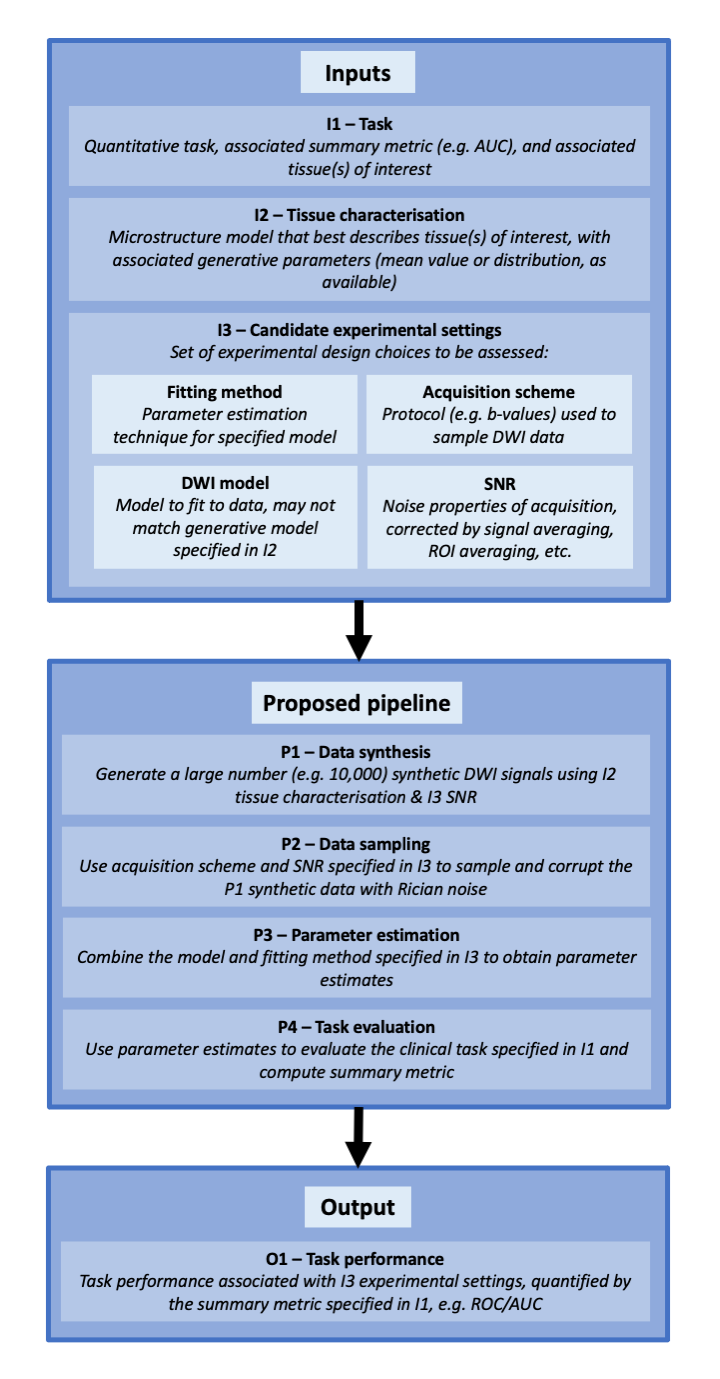
Figure 1 – Graphical overview of proposed CED assessment pipeline
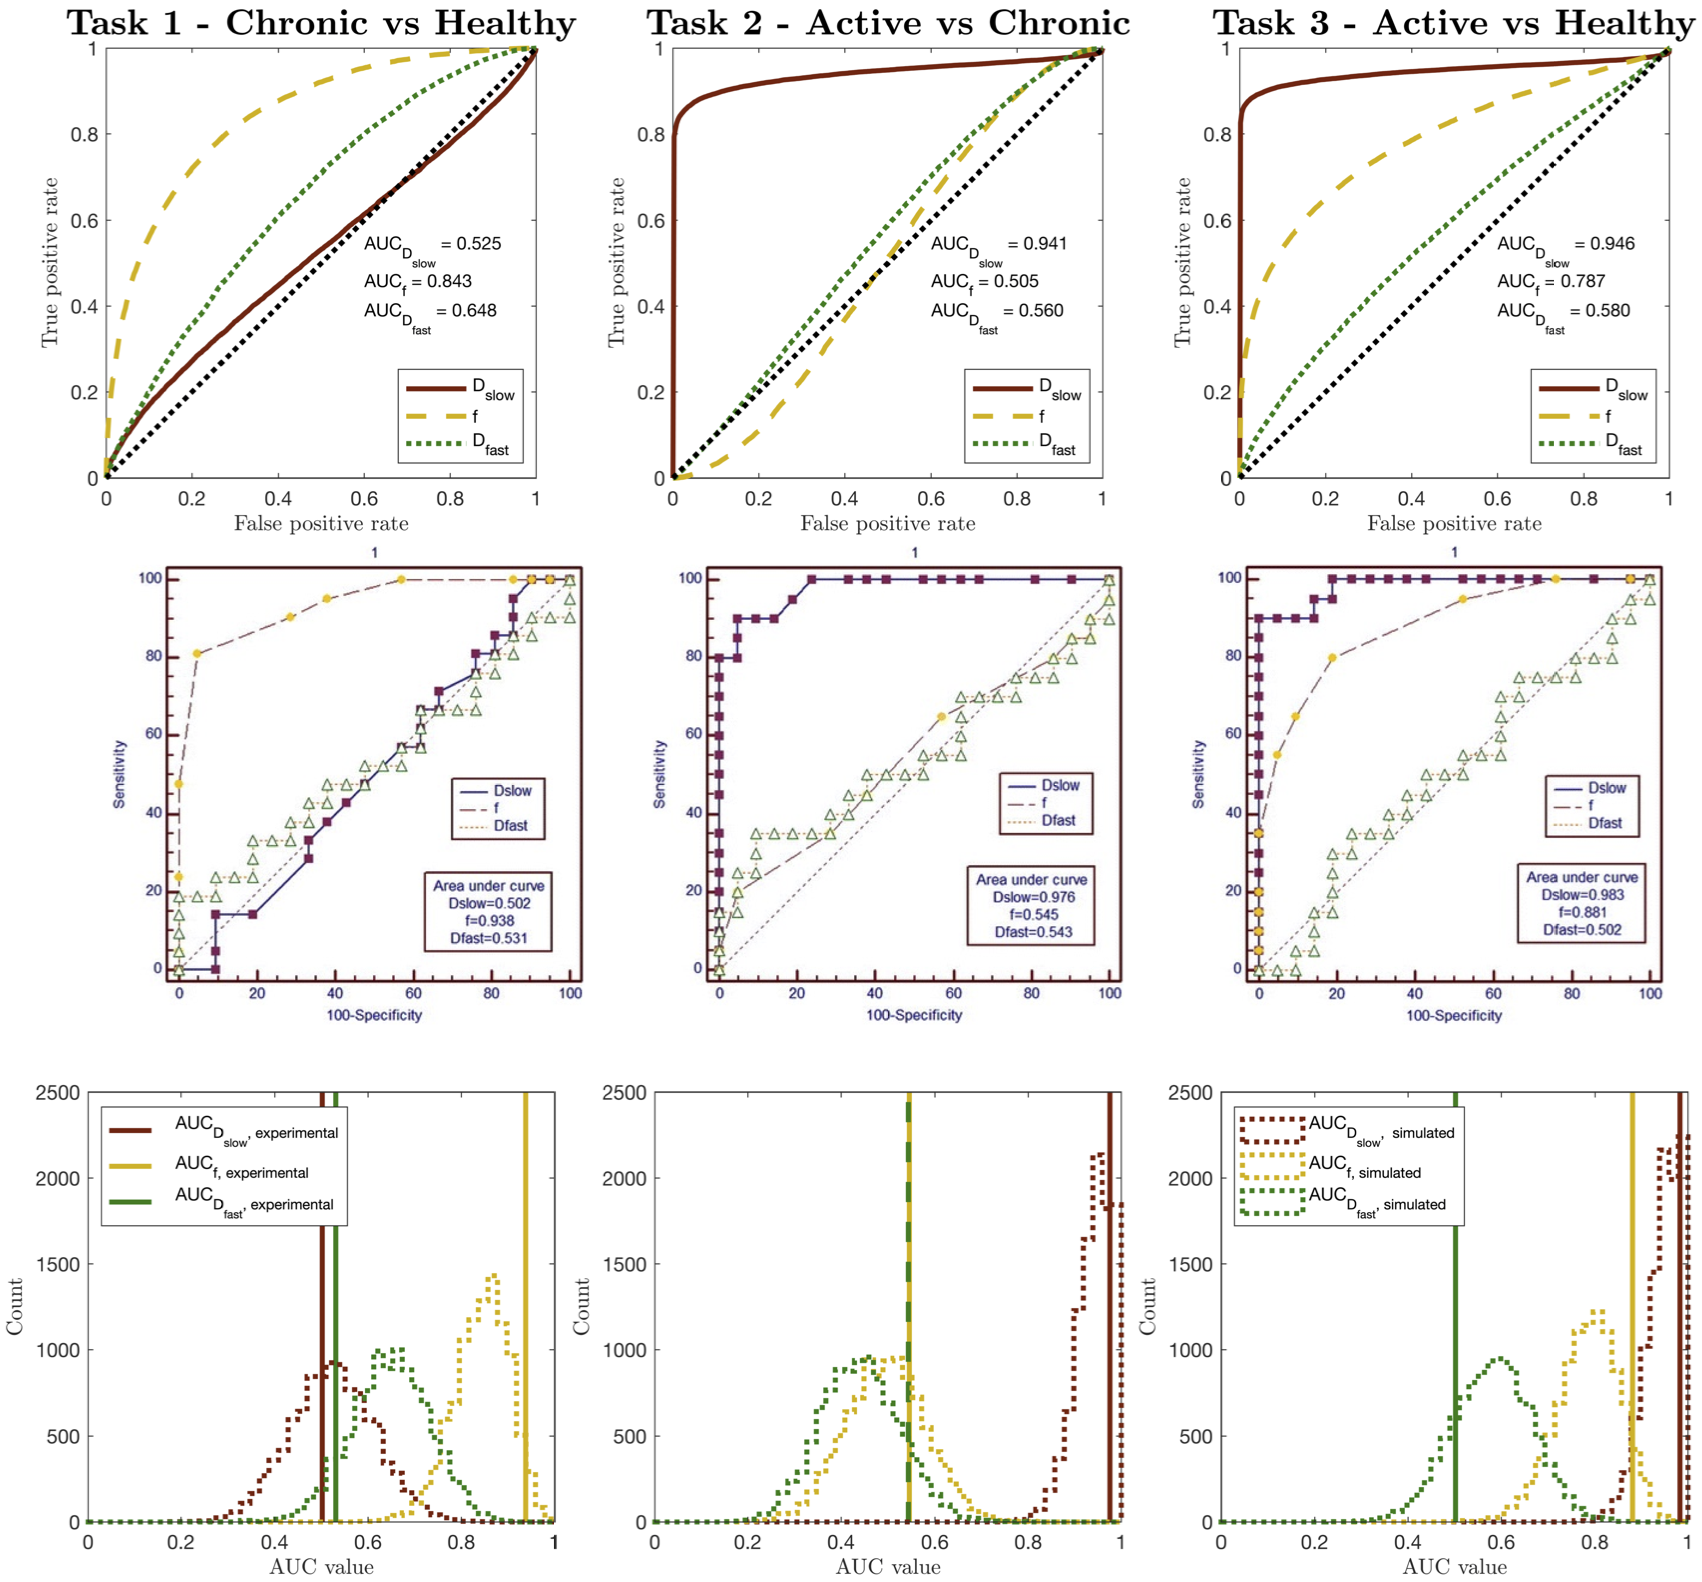
Figure 2 – Simulated (top row) vs. clinical (middle row) ROC curves for Zhao’s dataset7, for Tasks 1-3. The bottom row compares clinical AUC values to the distribution of simulated AUC values obtained by sub-sampling the pipeline dataset to match Zhao’s sample sizes. All ROC curves are qualitatively similar; the relative performance (AUC values) of different IVIM parameters are equal; all AUC values are in numerical agreement once clinical sample size is considered
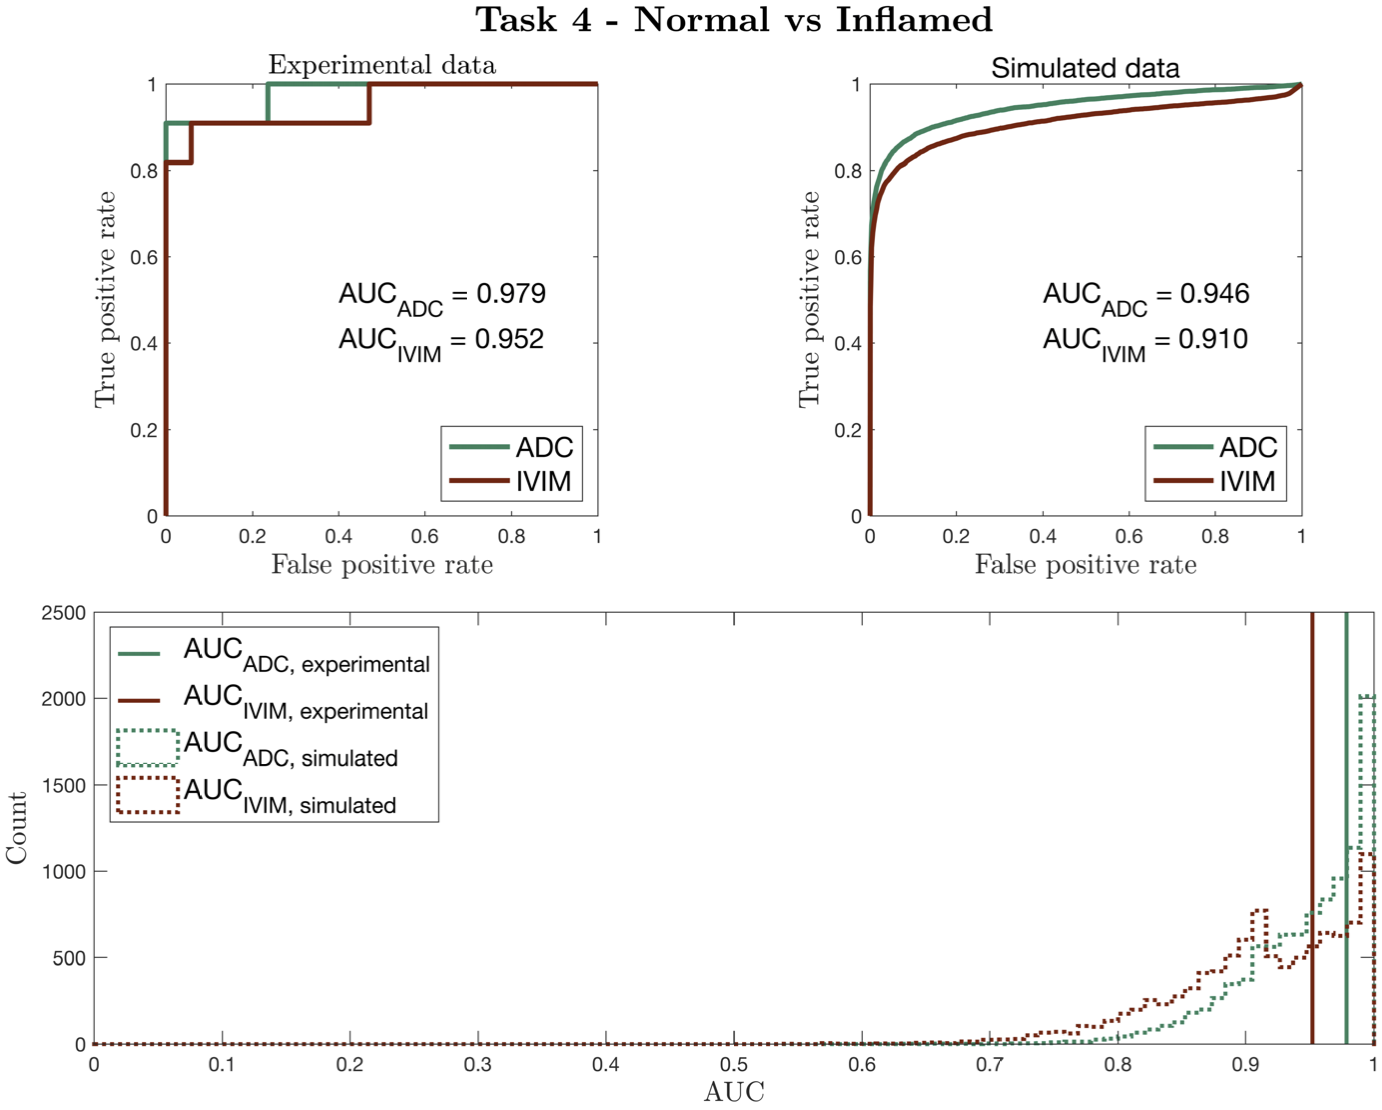
Figure 3 – Simulated vs clinical ROC curves (top row) for Task 4, using Bray’s dataset6. The bottom row compares clinical AUC values to the distribution of simulated AUC values obtained by sub-sampling the pipeline dataset to match Bray’s sample sizes. As in Figure 2, ROC curves are qualitatively similar; the relative performance (AUC values) of DWI models are equal; all AUC values are in numerical agreement once clinical sample size is considered
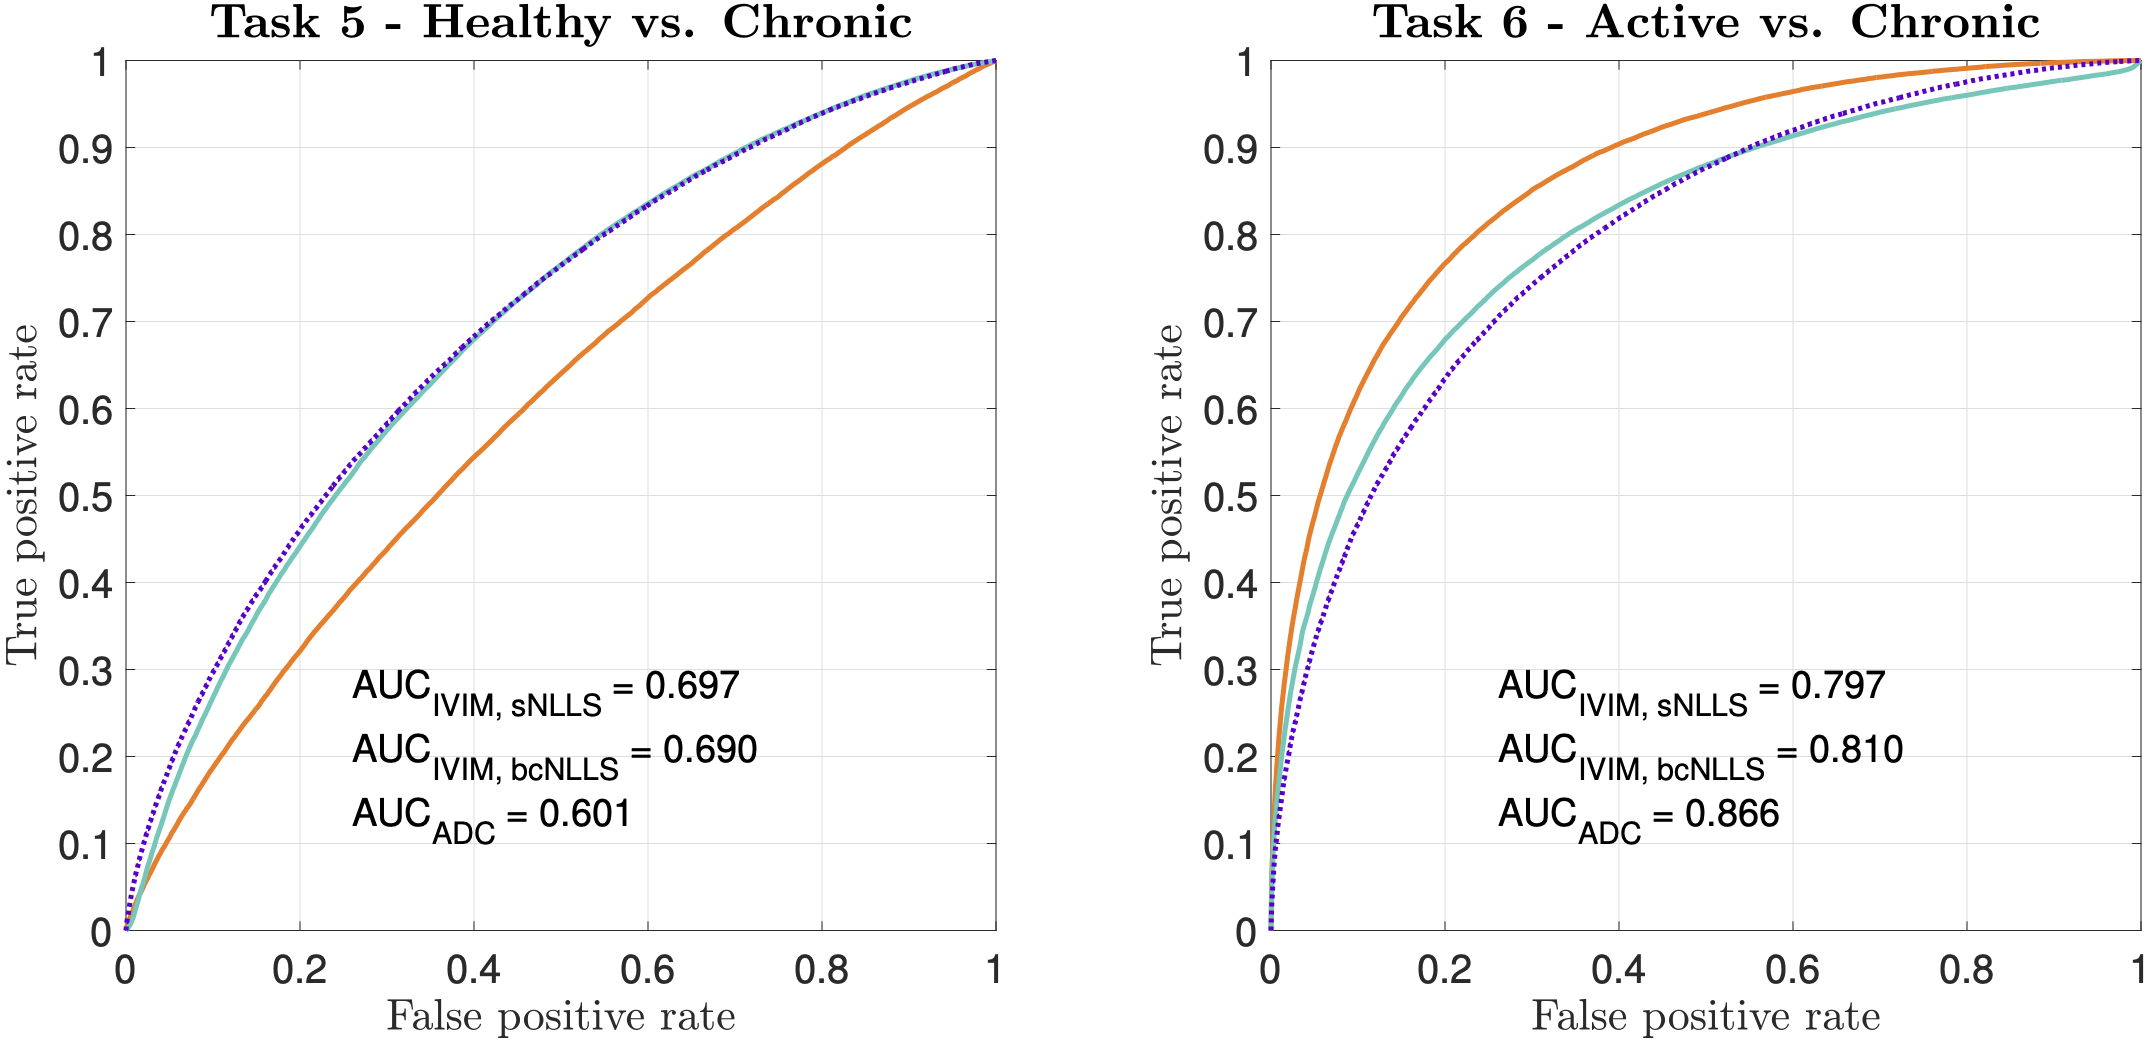
Figure 4 – ROC curves and associated AUC values for two toy classification tasks (Table 2). Despite IVIM being the generative model for both tasks, it is outperformed by ADC in Task 6. Within IVIM, sNLLS outperforms bcNLLS in Task 5; the opposite is true in Task 6
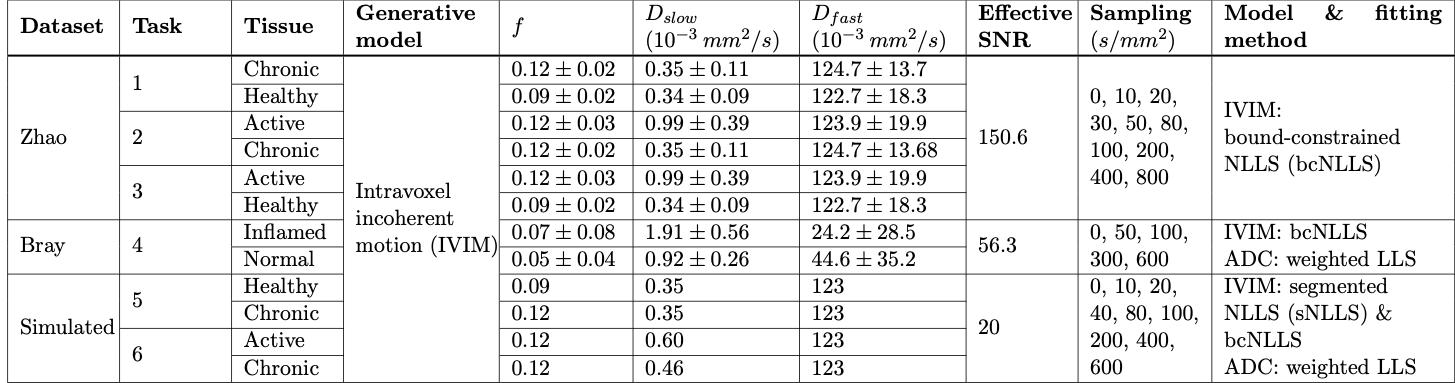
Table 1 – Computational pipeline settings for E1 & E2. Synthetic signals were generated using parameters drawn from normal distributions taken from Zhao7 or Bray6 (E1) or single values (E2). Effective SNR for E1 was calculated from Bray’s S(b=0) images, and, for Tasks 1-3, adjusted by mean ROI size and acquisition differences (TE, voxel size, number of repetitions, etc.) between Bray and Zhao’s experiments. In Tasks 4-6, ADC model was estimated from IVIM-synthesised data