3641
When Averaging Only Gets You So Far: Repulsion and Peanut Squashing in Diffusion Tensor MRI1Radyr Comprehensive School, Cardiff, United Kingdom, 2CUBRIC, School of Psychology, Cardiff, United Kingdom
Synopsis
This work asks a very simple but important question: To what extent can we recover lost SNR by signal averaging in a standard diffusion tensor MRI experiment? Based on the theory that if SNR of a signal is reduced by a factor (1/m), then m2 signal averages will recover that SNR, the diffusion MRI literature often assumes that averaging is the 'magic bullet'. Here, using Monte Carlo simulations, we show that this only true to a certain extent and, despite averaging, low SNR data results in biased DTI estimates.
INTRODUCTION
This work asks a very simple but important question: To what extent can we recover lost SNR by signal averaging in a standard diffusion tensor MRI experiment? The most frequent scenario when SNR is reduced is when increasing spatial resolution. Reducing voxel-size by a factor m reduces the SNR by 1/m. Based on the theory that if SNR of a signal is reduced by a factor (1/m), then m2 signal averages will recover that SNR, the diffusion MRI literature often assumes that averaging is the 'magic bullet'. Here, using Monte Carlo simulations, we show that this only true to a certain extent and, despite averaging, low SNR data results in biased DTI estimates.METHODS
Signal GenerationDiffusion-weighted MRI experiments were simulated as follows:
- Axially-symmetric tensors were simulated with mean diffusivity (MDtrue)= 0.7x10⁻³ mm2/s, and fractional anisotropy, FAtrue, in the range [0:1.0] with 0.1 step-size;
- The ‘base-31’ set of sampling measurements comprised one b=0 s/mm2 image and 30 isotropically-sampled measurements at b = 1000 s/mm2 (Icosahedral30);
- As our ‘reference’, we assume SNR=48, and
1 repetition of the ‘base-31’ acquisition;
- We consider SNRs between 3 and 48. For an m-fold reduction in SNR (compared to SNR=48), the complete set of base-31-measurements was repeated N = m2 times. Thus, the combinations of [SNR,N] simulated were: [48,1]; [24, 4]; [16, 9]; [12, 16]; [8, 36]; [6, 64]; [4, 144] and [3, 196].
- Rician noise was added to the noise-free signals, to give the required SNRs in the b=0 s/mm2 signal.
- For each FAtrue, SNR and N, the tensor was estimated from the noisy signals using ordinary least squares fitting, and the estimated eigenvalues, L1est, L2est, L3est, fractional anisotropy (FAest), mean diffusivity (MDest) and radial diffusivity (RDest) recovered.
This whole procedure was repeated 1000 times to generate a mean and standard deviation of each parameter for every [FAtrue, SNR, N] triplet. To check whether averaging was able to recover the same parameters as the ‘reference’ statistically we used a paired t-test to compare the distributions of 1000 parameters between all possible [SNR,N] couples.
RESULTS AND DISCUSSION
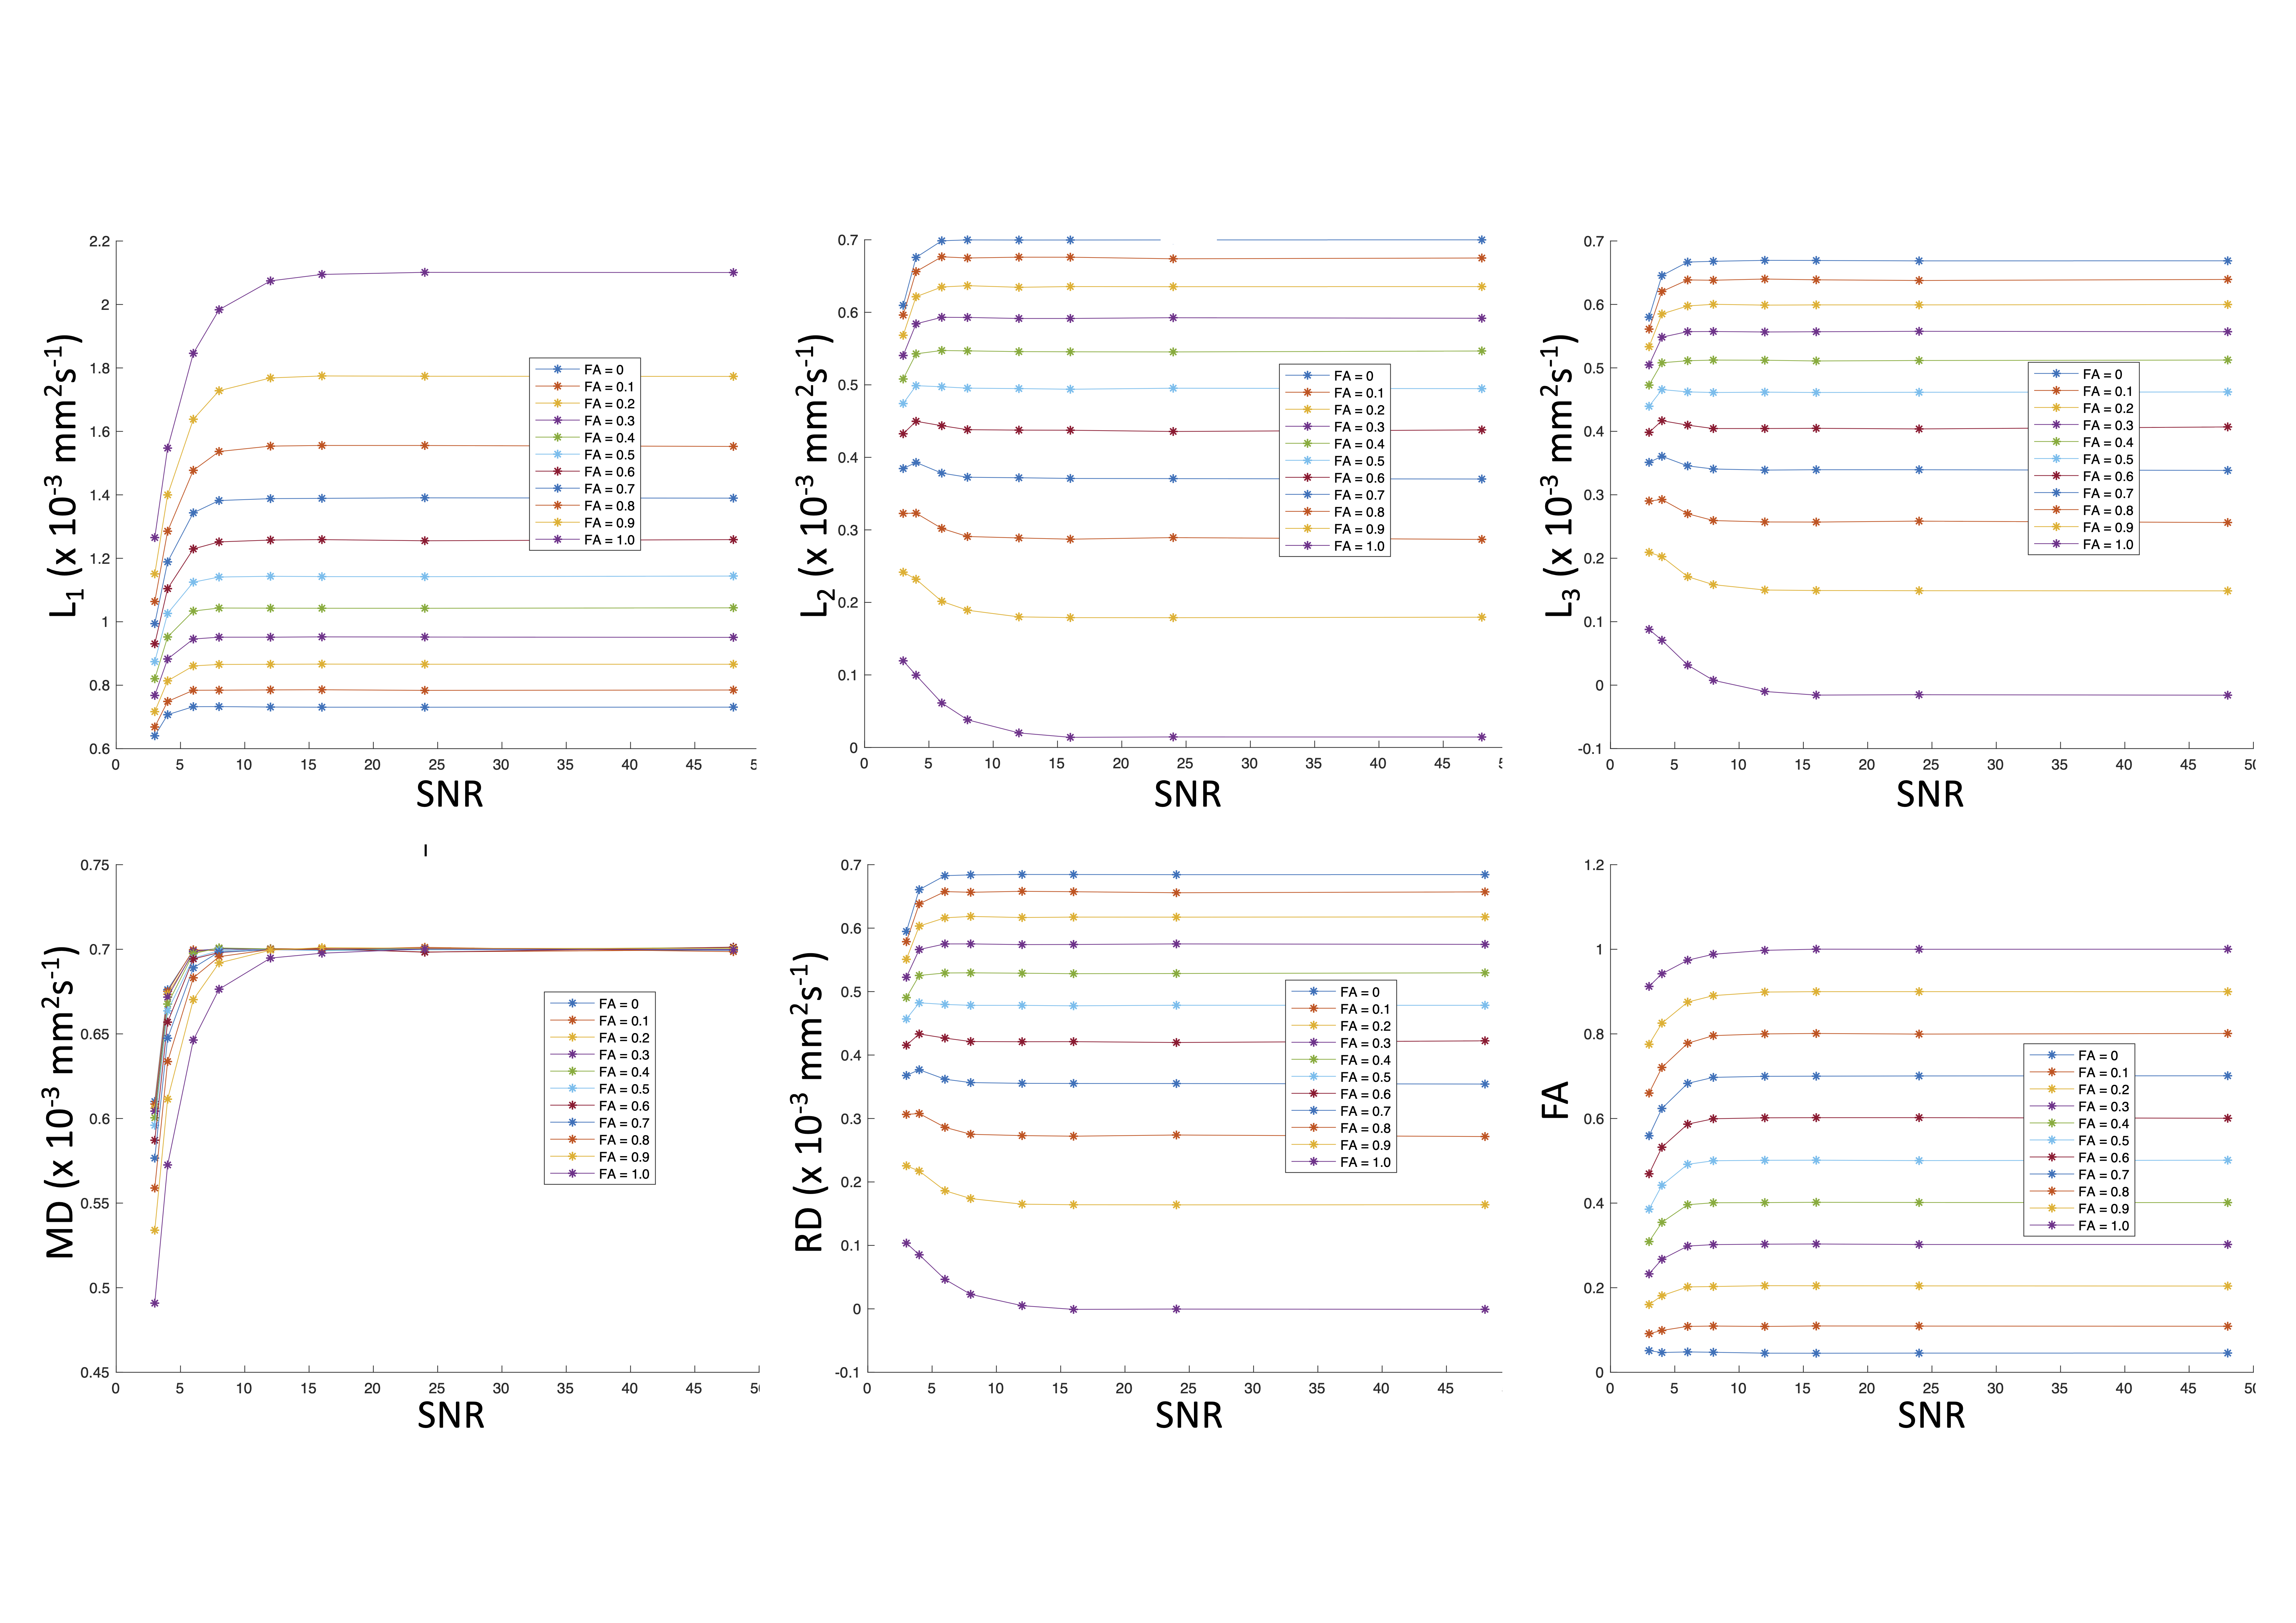
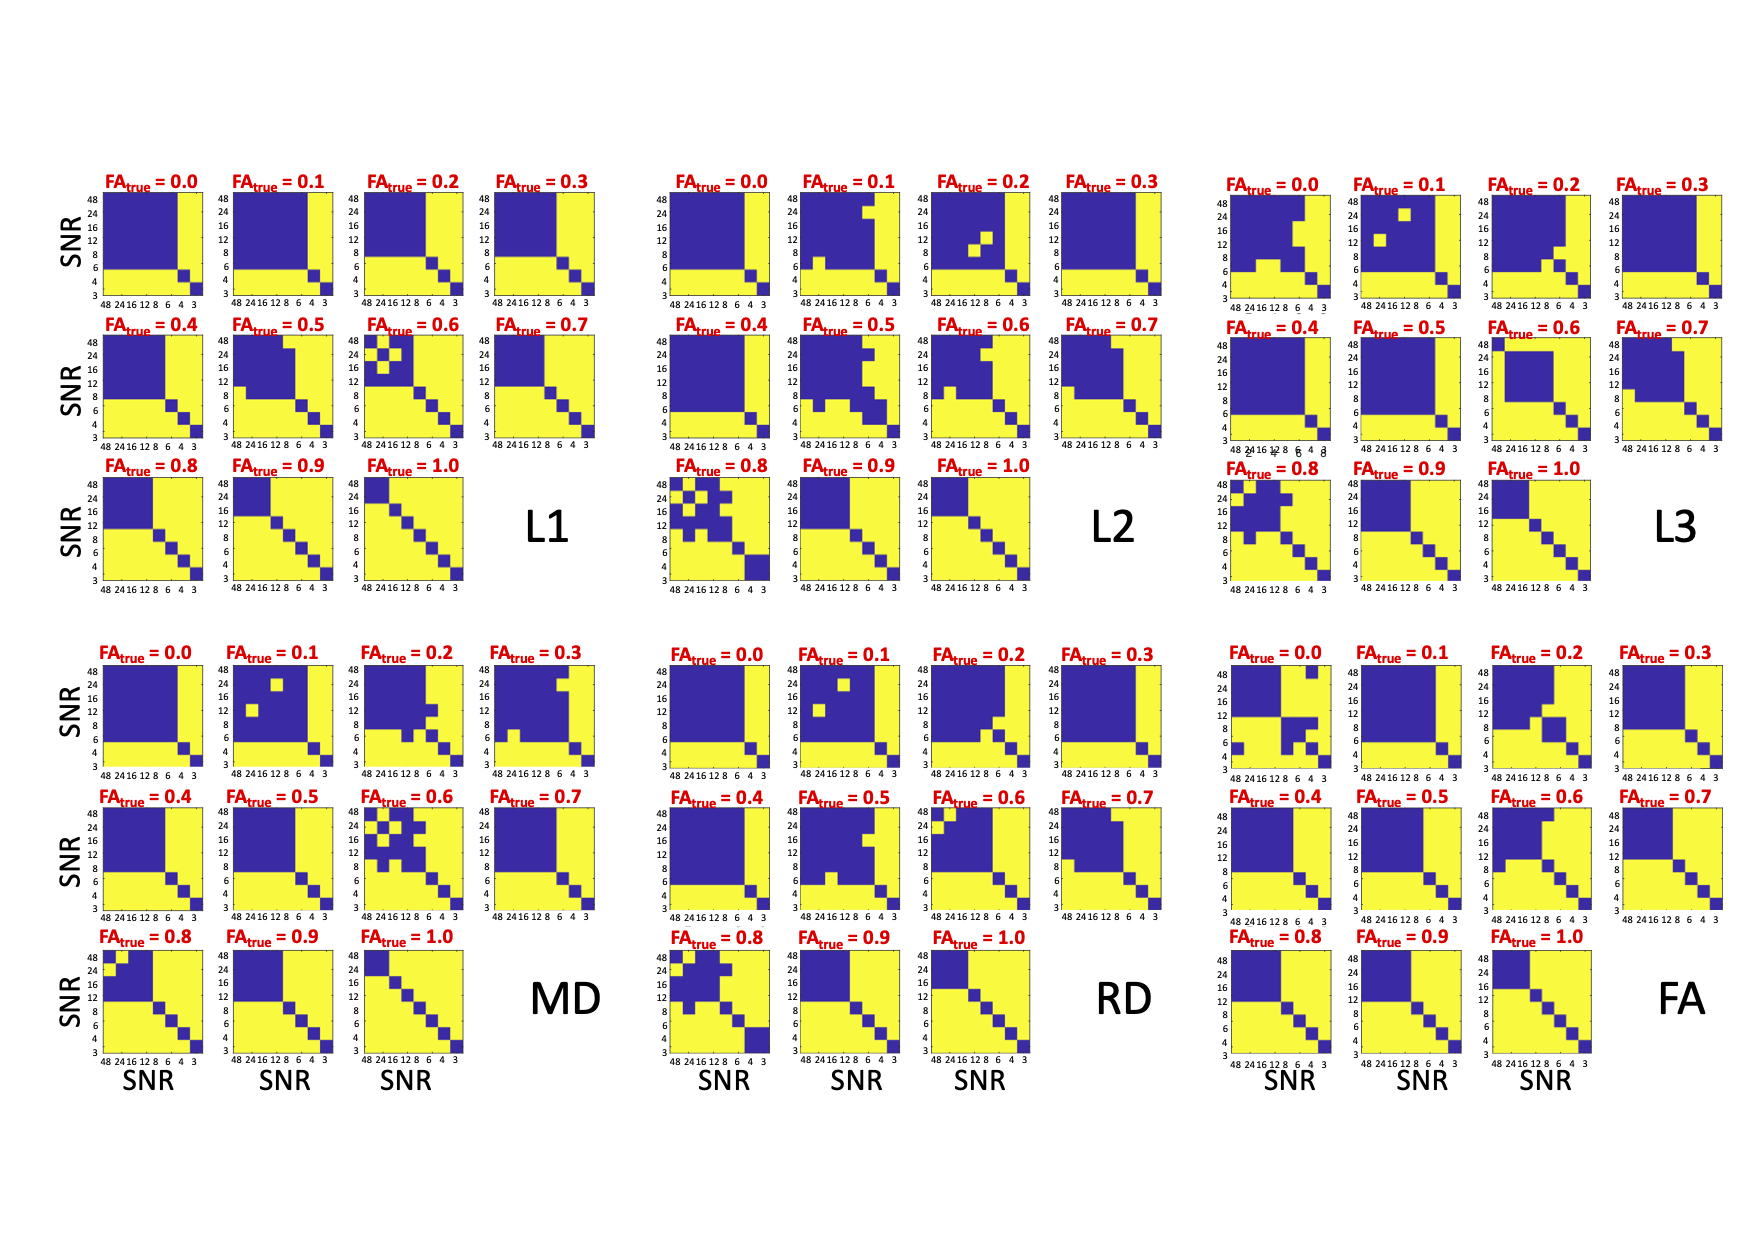
Figure 1 shows the main result for the 6 different parameters estimated from the diffusion tensor. Across all metrics, and across all FAtrue , the profiles are relatively flat between SNR=16:48, suggesting a 3-fold reduction in SNR could be ameliorated by averaging 9 times. However, below this SNR, the recovered metrics start to deviate rapidly from the 'reference' (i.e., [SNR, N] = [48, 1]). Moreover, the extent to which this deviation occurs depends both on the metric and FAtrue.Figure 2 shows the result of t-tests comparing the distribution of 1000 Monte Carlo samples for different [SNR, N] couples and for different FAtrue values. This allows us to move beyond 'eye-balling' differences in in Figure 1, to establish whether the different [SNR, N] couples yield statistically significantly different means, and provide a deeper insight. It appears that one can actually tolerate further reductions in SNR than the impression given by Figure 1. For example, the mean eigenvalues are not statistically different for reductions in SNR down to 6 (for low FAtrue values) but, and this is true across all metrics, as FAtrue increases, SNR reductions are less well tolerated (despite the increase in total number of measurements), with the lowest tolerable SNR being 24 for L1 and MD, and 16 for the other metrics.
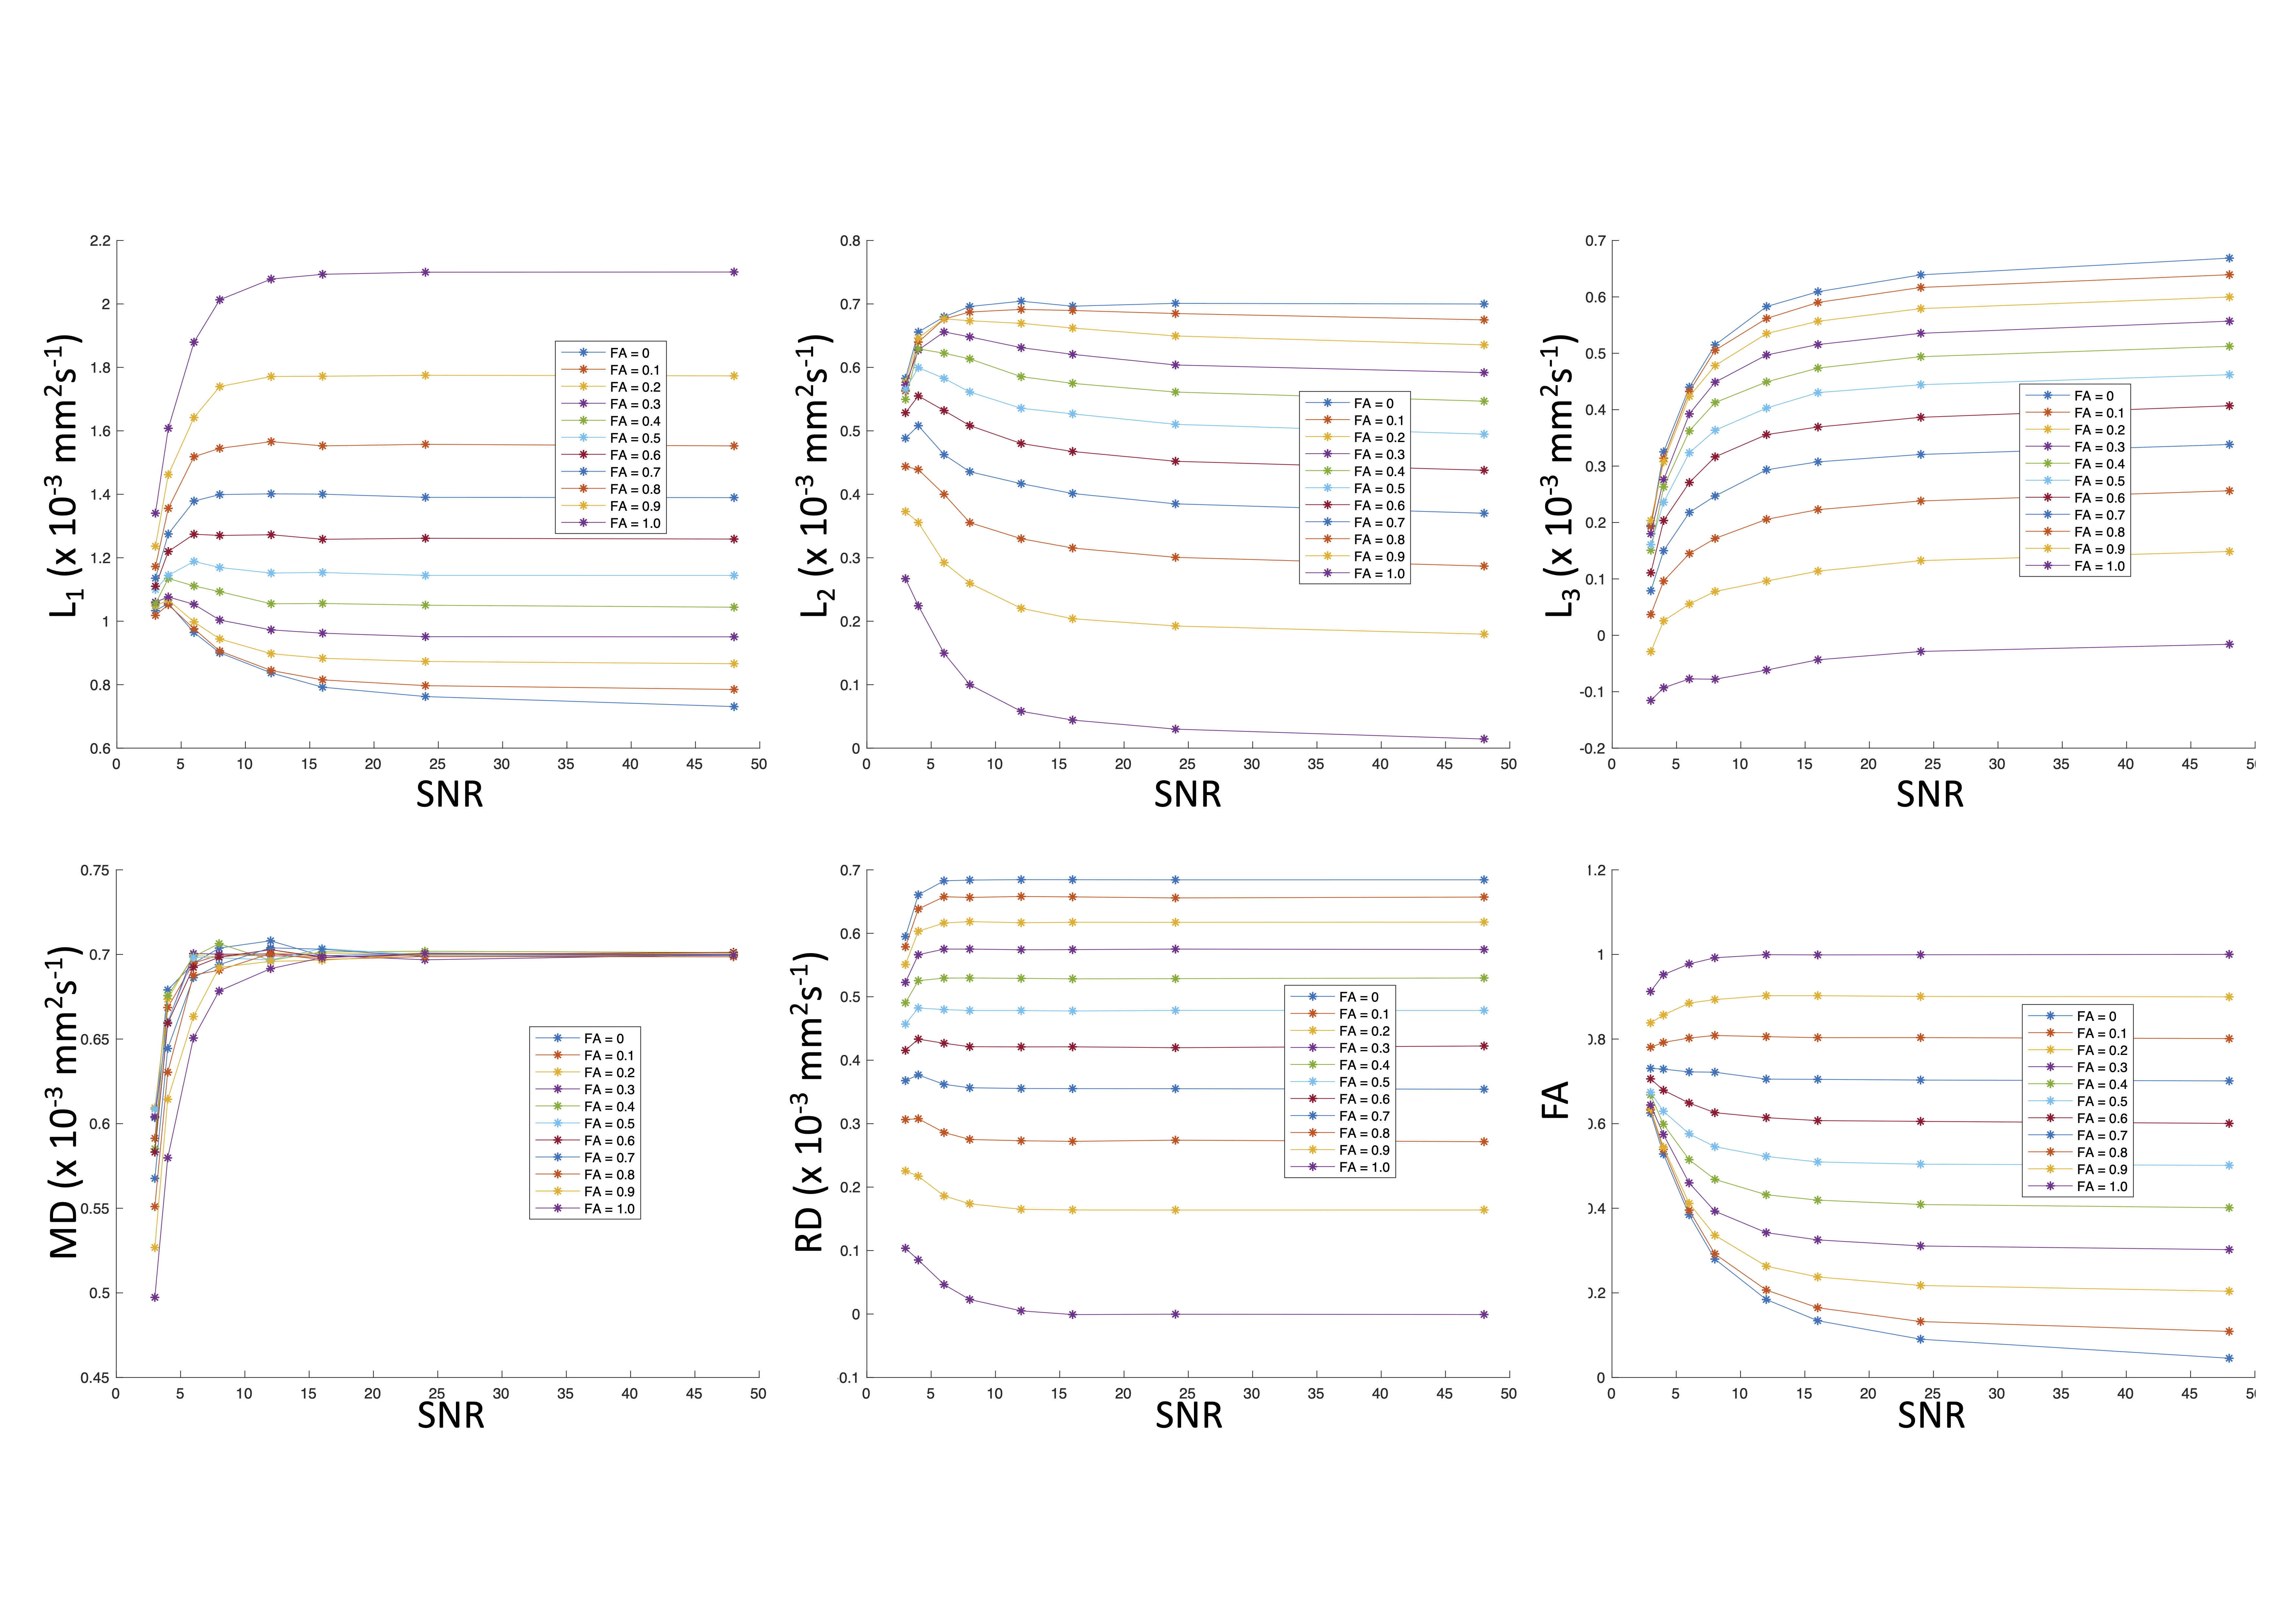
Figure 3 provides the explanation for the heterogeneity in the results seen here. First, the eigenvalue repulsion first reported by Pierpaoli et al.1 is responsible for the pattern seen at low FAtrue values. As seen in Figure 2, generally, in isotropic and low anisotropic media, a reduction in SNR is well tolerated (i.e. metrics are not significantly different from the [48,1] couple) down to about 8 or 6 for all metrics (apart from FA). This is in line with the top row of Figure 3, which replicates Pierpaoli's observation of eigenvalue repulsion and sorting bias, i.e., that the 'largest' eigenvalue is over-estimated for low FAtrue, the 'intermediate' eigenvalue is fairly flat, while the 'smallest' eigenvalue is progressively under-estimated as SNR is reduced.
Second, we see again in Figure 2 that as FAtrue increases, there is less tolerance of a reduction in SNR (the area of blue reduces for all metrics). Here, another previously-reported phenomenon is at play - the 'squashed peanut'2 for a fixed mean diffusivity, as FAtrue increases, the largest eigenvalue also increases bringing us closer to the rectified noise floor, leading to an under-estimate of diffusivity (top-left, Figure 3). Thus, two different mechanisms are at play and explain the failure of signal-averaging to recover the same DT-MRI metrics seen at higher SNRs.
CONCLUSION
Using extensive Monte Carlo simulations we have addressed a simple question, i.e., to what extent can shortcomings in SNR be addressed by averaging in DT-MRI experiments? We show the limits over which averaging can recover statistically identical metrics, and how this varies according to metric and anisotropy. Moreover, our simulations show how, and why, the averaging process breaks down. We hope this work will be useful to the researcher under pressure to "Just increase the averages, and you'll be okay" (!)Acknowledgements
We would like to the thank the Wellcome Trust for an Investigator Award and Strategic Award that supported this work.References
[1] Pierpaoli C, Basser PJ. (1996). Toward a quantitative assessment of diffusion anisotropy. Magn Reson Med . 36:893-906.
[2] Jones DK, Basser PJ. (2004).
"Squashing peanuts and smashing pumpkins": how noise distorts diffusion-weighted MR data.
Magn Reson Med
. 52:979-993
Figures