3640
A tale of two frequencies: optimizing oscillating gradients for frequency dependent differential kurtosis mapping1Department of Medical Biophysics, Western University, London, ON, Canada, 2Centre for Functional and Metabolic Mapping, Western University, London, ON, Canada, 3Robarts Research Institute, Western University, London, ON, Canada
Synopsis
Frequency dependent diffusion kurtosis has historically been difficult to measure with oscillating gradient spin echo (OGSE) sequences and even more so without the use of gradient insert coils. Here we present a new OGSE gradient waveform and determine the optimal frequency to observe kurtosis differences between PGSE and OGSE acquisitions using a conventional gradient system. Using this method we present in vivo differential kurtosis maps based on the frequency dependence.
Introduction
In recent years oscillating gradient spin-echo (OGSE) sequences have facilitated investigations of the spectral and temporal dependence of diffusion parameters in the human brain [1, 2]. The realization of shorter effective diffusion times with increasing oscillation frequency provides an efficient technique for the investigation of restricted diffusion [3]. Consequently, measurement and modeling of the frequency dependence of diffusion metrics can thereby provide insight into the microstructural characteristics of both diseased and healthy tissue [4]. While the frequency dependence of the apparent diffusion coefficient (ADC) has been investigated in the human brain [2], the dependence of diffusion kurtosis remains relatively unexplored. The rapid reduction in b-value with increasing frequency has historically made kurtosis difficult to measure at high frequencies while the prolonged echo times associated with lower frequencies (that can achieve necessary b-values) results in diminished image quality. Recent work has demonstrated a decrease in mean kurtosis with increasing oscillation frequency [5]; however this work relied on a high-performance gradient insert coil capable of 200 mT/m gradient amplitudes and slew rates up to 500 T/m/s [6]. Therefore, in this work we present an optimized oscillating gradient method for conventional gradient systems to measure frequency dependent kurtosis by optimizing the acquisition of in vivo differential kurtosis maps.Methods
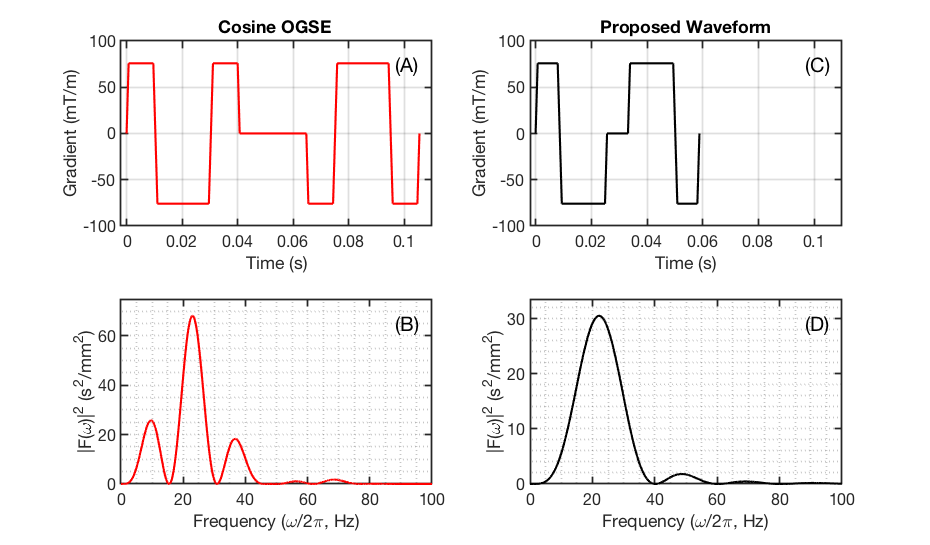
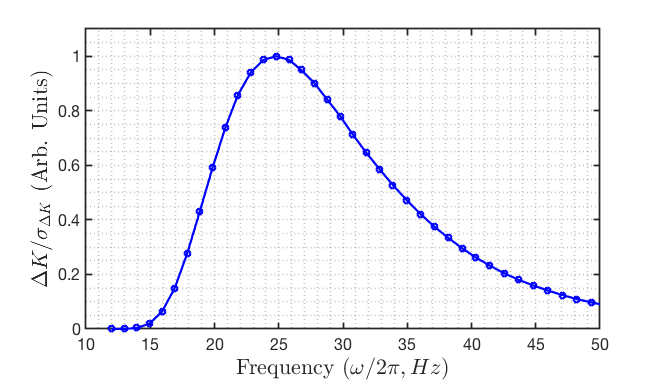
In order to reduce the echo time (TE) associated with OGSE acquisitions at low frequencies, a novel gradient waveform was developed by reducing the number of lobes of a conventional cosine OGSE sequence and minimizing the required time for the refocusing RF pulse (see Figures 1A & 1C). To ensure there is zero DC spectral component, the duration of the first lobe is tuned such that the integral of the zeroth moment of the gradient vanishes.Optimal scan parameters for observing the difference in kurtosis ΔK, between PGSE (f = 0 Hz) and OGSE (f > 0 Hz) acquisitions were identified by maximizing the following expression for the signal-to-noise ratio (SNR) of the difference in kurtosis: $$\frac{\Delta K}{\sigma_{\Delta K}}=\frac{\Delta K}{6}\cdot SNR_{0}\cdot {b^2D^2}\cdot\sqrt{N_{A}}\left(e^{-bD+b^2 D^2 K_{0}/6}\cdot e^{\frac{-TE}{T_{2}}}\right)\left(1+{e^{b^2D^2\Delta K/3}}\right)^{-\frac{1}{2}}$$Here $$$\sigma_{ΔK}$$$ denotes the variance of ΔK, $$$SNR_{0}$$$ denotes the SNR for a proton density image, $$$T_2$$$ is the transverse relaxation time, $$$TE$$$ is the echo time, $$$D$$$ the diffusivity, $$$b$$$ the b-value, $$$N_{A}$$$ the number of acquisitions and $$$K_{0}$$$ the PGSE kurtosis. This expression was derived from noise variance propagation using methodology similar to OGSE ADC optimization performed by Arbabi et al. [2] and was evaluated numerically to establish the optimal oscillation frequency based on possible b-value and echo time combinations.
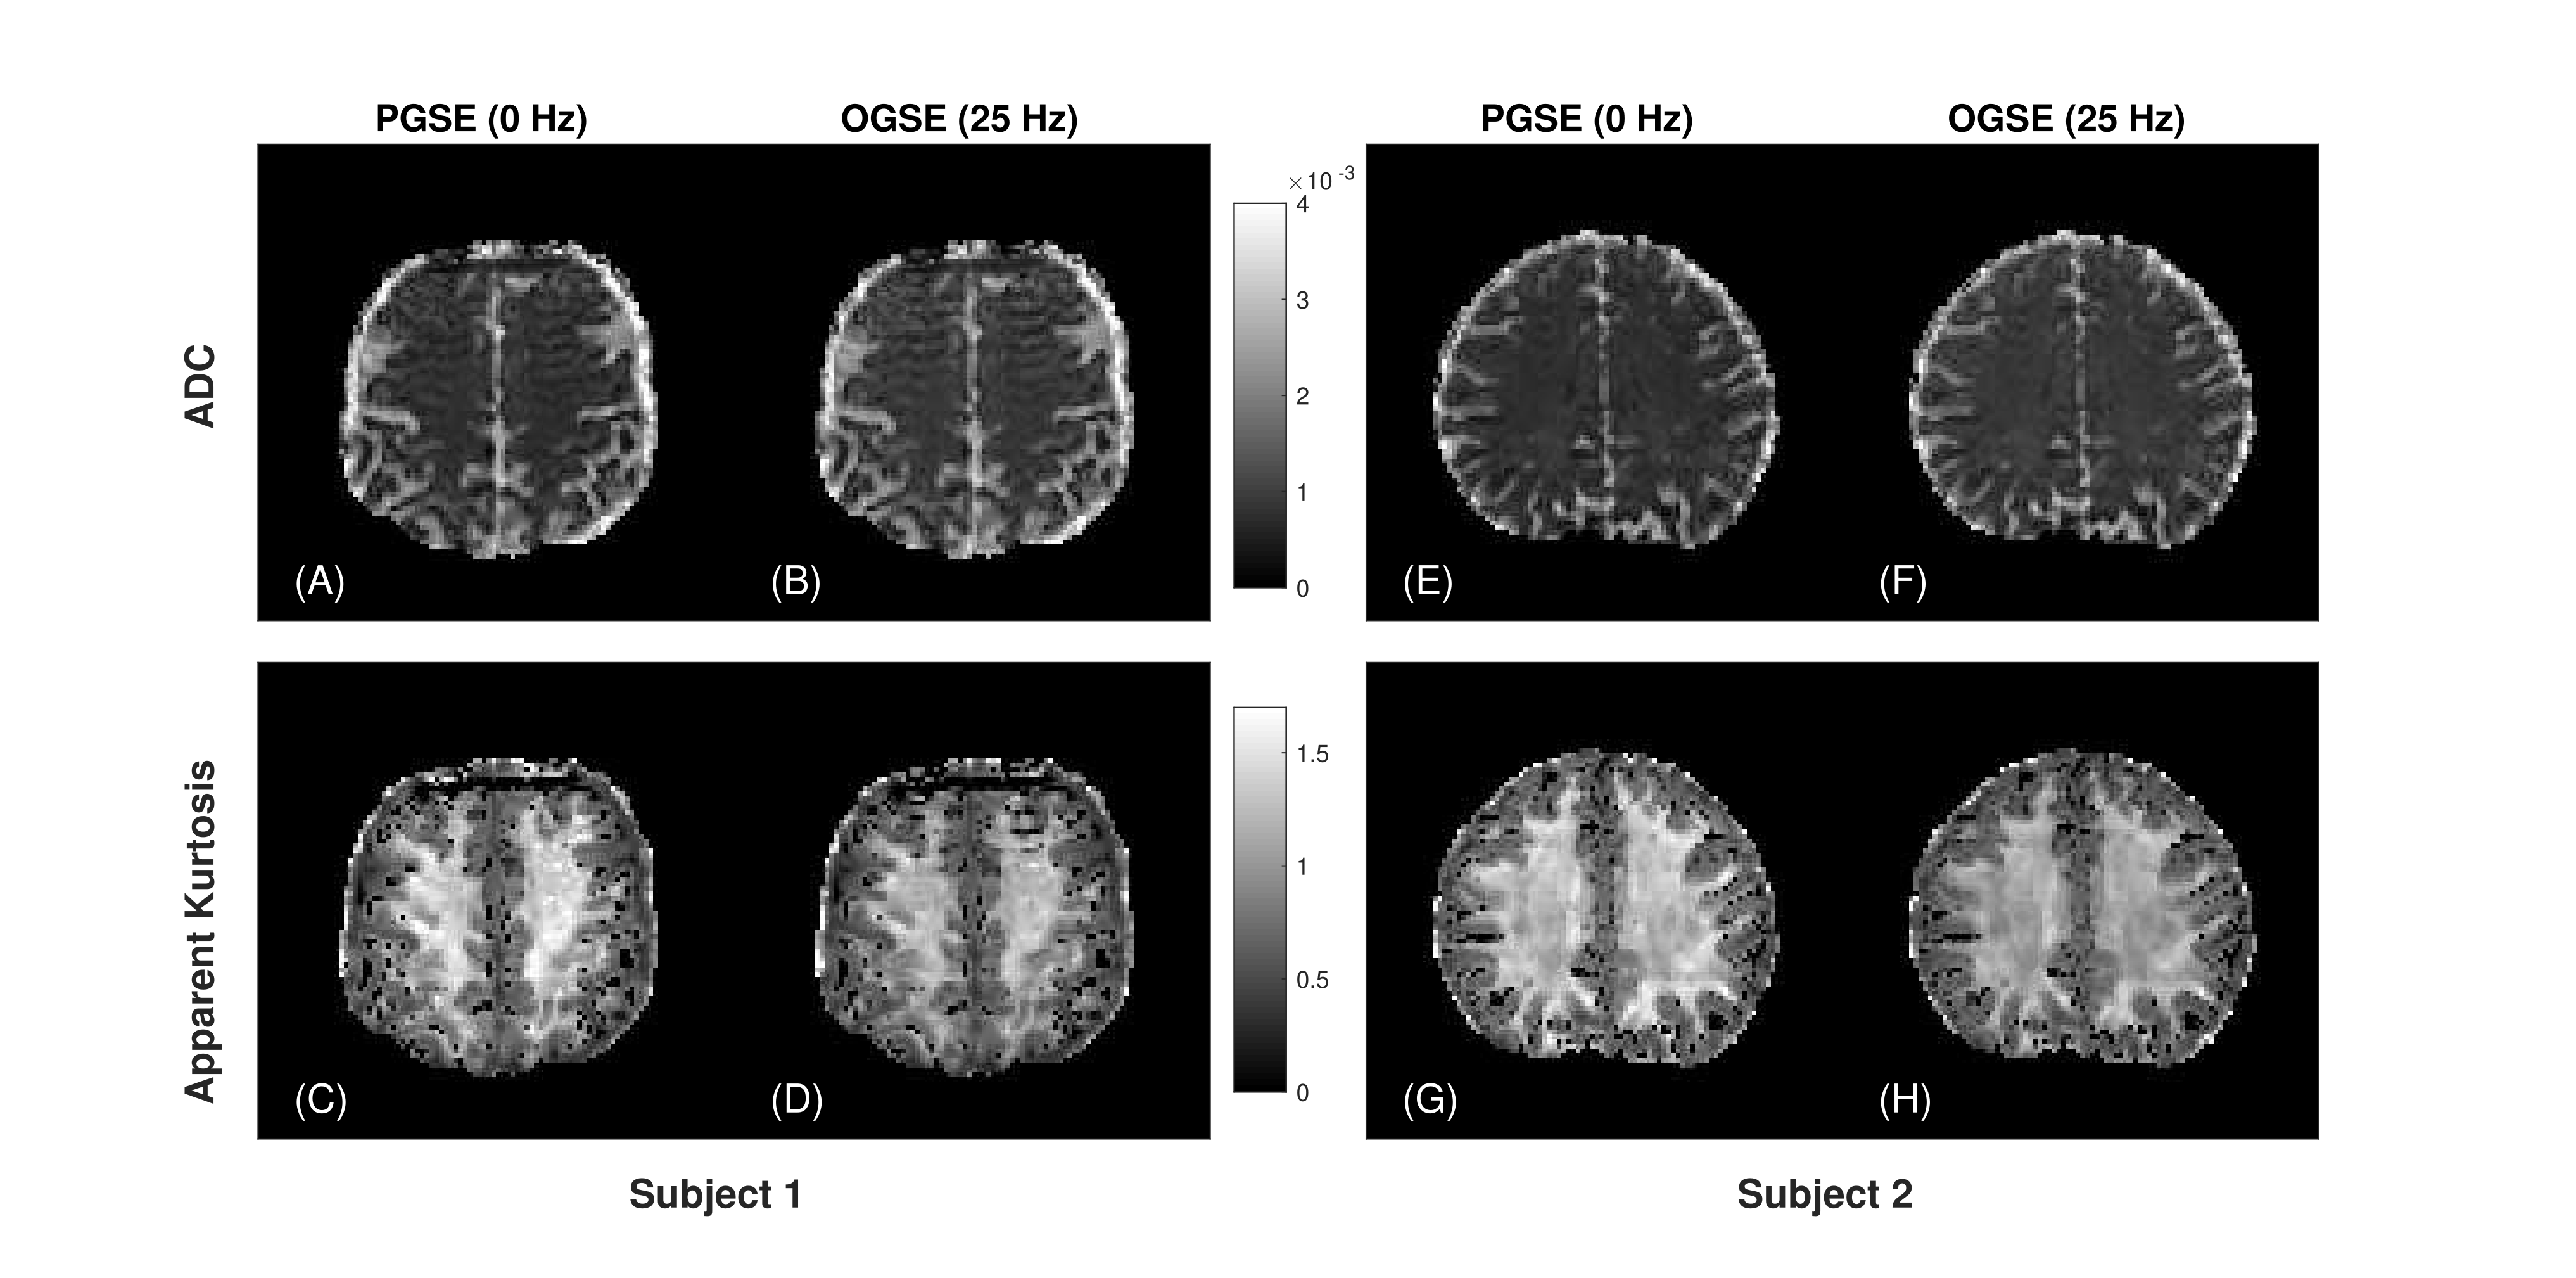
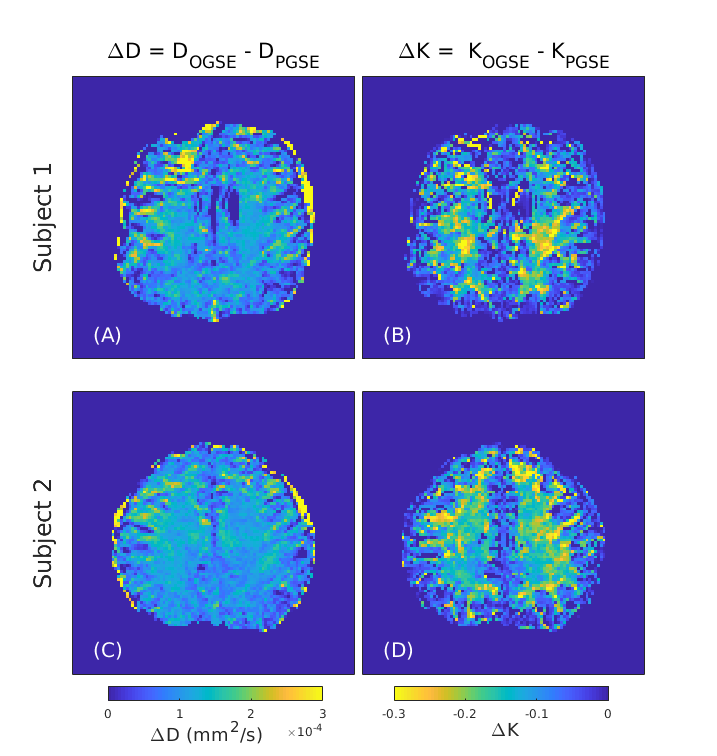
Based on the results of the optimization (Figure 2), diffusion weighted images were acquired with 25 Hz OGSE and standard PGSE in two healthy male volunteers using single shot EPI readout on a head-only 7T system (max gradient amplitude: 80 mT/m, max slew rate: 333 T/m/s – diffusion slew rate limited to 125 T/m/s). The optimal scan consisted of the following parameters: 4-direction tetrahedral diffusion scheme, TE/TR = 86/5000 ms, FOV = 200 x 200 mm, matrix size = 100 x 100, b-value = 0, 1000, 2000 s/mm2 and 8 averages with 2 mm isotropic resolution - total scan time 11.5 min. Images were corrected for eddy current distortions using a clip-on field monitoring camera (Skope, Zurich Switzerland) while Gibbs ringing removal was applied using MRtrix3. Similar to previous tetrahedral diffusion kurtosis analyses [7], data was directionally averaged for each shell and fitted on a voxel-wise basis to a kurtosis signal model to produce apparent kurtosis maps. Differential kurtosis maps are prepared by taking the difference of apparent kurtosis values between the PGSE and OGSE acquisitions.
Results
A comparison between nominal cosine modulated (N = 2) OGSE and our proposed shortened waveform is shown in Figure 1. A reduction in total gradient duration is achieved without loss of spectral selectivity (see Figures 1B and 1D). Frequency optimization results presented in Figure 2 demonstrate maximum SNR of the difference in kurtosis is achieved for 25 Hz oscillation frequency. Average ADC and kurtosis maps of a representative slice from the PGSE and optimized OGSE acquisitions are shown for both subjects in Figure 3. Differential kurtosis and diffusion dispersion maps are presented in Figure 4.Discussion
We observe a noticeable decrease in apparent kurtosis between PGSE and OGSE diffusion encodings. Such a decrease is anticipated since diffusion of the spins appears increasingly Gaussian as the effective diffusion time is reduced [8]. Our optimized ΔK maps provide convenient visualization of these differences for the first time without the necessity of high-performance gradient insert coils or advanced gradient systems.Additionally, the diffusion encoding waveform presented here is capable of significantly reducing the long TE typically associated with low frequency OGSE. This advancement may permit more robust estimations of the frequency dependence of diffusion metrics in future works by expanding the range of frequencies available for a given TE. Together, we anticipate these findings to constitute a useful tool that may enable further exploration of heterogeneity in healthy and diseased tissue through the frequency regulated apparent kurtosis.
Conclusion
We’ve presented the acquisition of differential kurtosis maps using OGSE and PGSE diffusion encoding. Our protocol is capable of demonstrating kurtosis frequency dependence without the aid of a gradient insert coil.Acknowledgements
This work was supported by the Canada First Research Excellence Fund to BrainsCAN and the Natural Sciences and Engineering Research Council of Canada.
References
1. Van AT, Holdsworth SJ, Bammer R. In vivo investigation of restricted diffusion in the human brain with optimized oscillating diffusion gradient encoding. Magn Reson Med. 2014; 71: 83-94.
2. Arbabi A, Kai J, Khan AR, Baron CA. Diffusion dispersion imaging: Mapping oscillating gradient spin‐echo frequency dependence in the human brain. Magn Reson Med. 2020; 83: 2207– 2218.
3. Schachter M, Does MD, Anderson AW, Gore JC. Measurements of restricted diffusion using an oscillating gradient spin-echo sequence. J Magn Reson. 2000; 147(2):232-7.
4. Novikov DS, Fieremans E, Jespersen SN, Kiselev VG. Quantifying brain microstructure with diffusion MRI: Theory and parameter estimation. NMR in Biomedicine. 2019; 32:e3998.
5. Yang GK, Tan EK, Fiveland E, Foo T, McNab J. Proc. Intl. Soc. Mag. Reson. Med. (2020) #0962
6. Tan ET, Shih RY, Mitra J, et al. Oscillating diffusion‐encoding with a high gradient‐amplitude and high slew‐rate head‐only gradient for human brain imaging. Magn Reson Med. 2020; 84: 950– 965
7. Aggarwal M, Smith MD, Calabresi PA. Diffusion‐time dependence of diffusional kurtosis in the mouse brain. Magn Reson Med. 2020; 84: 1564– 1578.
8. Jensen JH, Helpern JA, Ramani A, Lu H and Kaczynski K. Diffusional kurtosis imaging: The quantification of non‐gaussian water diffusion by means of magnetic resonance imaging. Magn Reson Med. 2005; 53: 1432-1440.
Figures