3638
Validation of between-bundle differences and within-bundle continuity of microstructural indices in ex vivo human brain tissue1Radiology, Athinoula A. Martinos Center for Biomedical Imaging, Massachusetts General Hospital and Harvard Medical School, Charlestown, MA, United States, 2Department of Radiology, University Hospital Bonn, Bonn, Germany, Bonn, Germany
Synopsis
We take advantage of the high spatial resolution that is feasible ex vivo on a preclinical 9.4T system to investigate between-bundle differences and within-bundle continuity of microstructural indices. In a human brain sample that has also undergone optical imaging to obtain direct measurements of axonal orientations, we identify regions occupied by motor fibers or association fibers. We collect diffusion-weighted images with two diffusion times and eight q-shells and use them to estimate the parallel and perpendicular diffusion coefficient in each fiber bundle. We show that the diffusion coefficients vary smoothly along each bundle, and have different profiles between bundles.
Introduction
The use of diffusion MRI (dMRI) microstructural indices to resolve crossing fiber bundles1,2 relies on the assumptions that: (i) microstructural features vary smoothly along each bundle, (ii) these features differ between bundles, and (iii) the differences can be detected in dMRI signals. Modeling the decay of the diffusion signal perpendicular to the fiber axis at high q-values can provide microstructural information that reveals differences between tracts in vivo3. However, at the spatial resolutions that are feasible in vivo, measuring microstructural differences between bundles is complicated by the fact that the dMRI signal in each voxel typically contains contributions from multiple bundles. Here, we image human brain tissue at 9.4T, at a spatial resolution that enables separation of neighboring bundles. We show preliminary evidence of within-bundle continuity and between-bundle differences in microstructural measures from the cortico-spinal tract (CST) and the superior longitudinal fasciculus (SLF-I).Methods
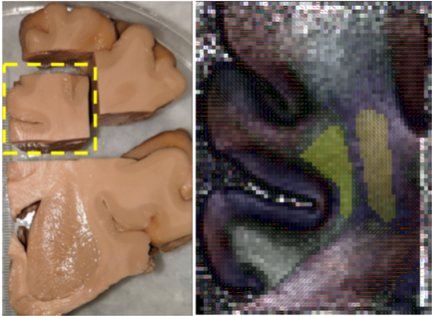
A 2x2x2.5 cm block from a fixed human hemisphere (Figure 1) was imaged in a 9.4T Bruker system with |G|=480 mT/m, using diffusion-weighted spin-echo 3D EPI (TE/TR = 72.3/750 ms, 0.34 mm isotropic resolution) with a multi-diffusion time, multi-shell q-space sampling scheme3,4 consisting of 8 shells (12 directions with b=1000,2000 s/mm2; 32 directions with b=5000,8000,15000,30000 s/mm2; 64 directions with b=50000,63000 s/mm2). Each shell was acquired at two diffusion times, Δ=30 and 50 ms, with δ=15ms. After denoising5 and eddy-current correction6, the data were analyzed as described in 3,4. Generalized q-sampling imaging7 was performed on the data from the shortest Δ to recover the principal fiber orientation in each voxel. The average signal perpendicular and parallel to this orientation were calculated for each q-shell8.The sample contained CST and SLF-I fibers. We used optical imaging to obtain ground-truth measurements of axonal orientation9 and drew regions of interest (ROIs) overlapping with one of the two tracts only (Figure 1). The CST ROI spanned 28 axial slices, and the SLF-I ROI spanned 25 coronal slices. The mean parallel and perpendicular signals from each q-shell and Δ were calculated across slices of the ROIs. Mono- and bi-exponential decay curves were fit to the signal to estimate the diffusion coefficients:
$$ S/S_{0}={f_{1}}*exp(-b*D_{1}) $$
$$ S/S_{0}={f_{1}}*exp(-b*D_{1})+{f_{2}}*exp(-b*D_{2})$$
where S/S0 the normalized diffusion signal, b the b-value, and fi, Di the volume fraction and diffusion coefficient, respectively, of the i-th compartment, i=1,2.
Results
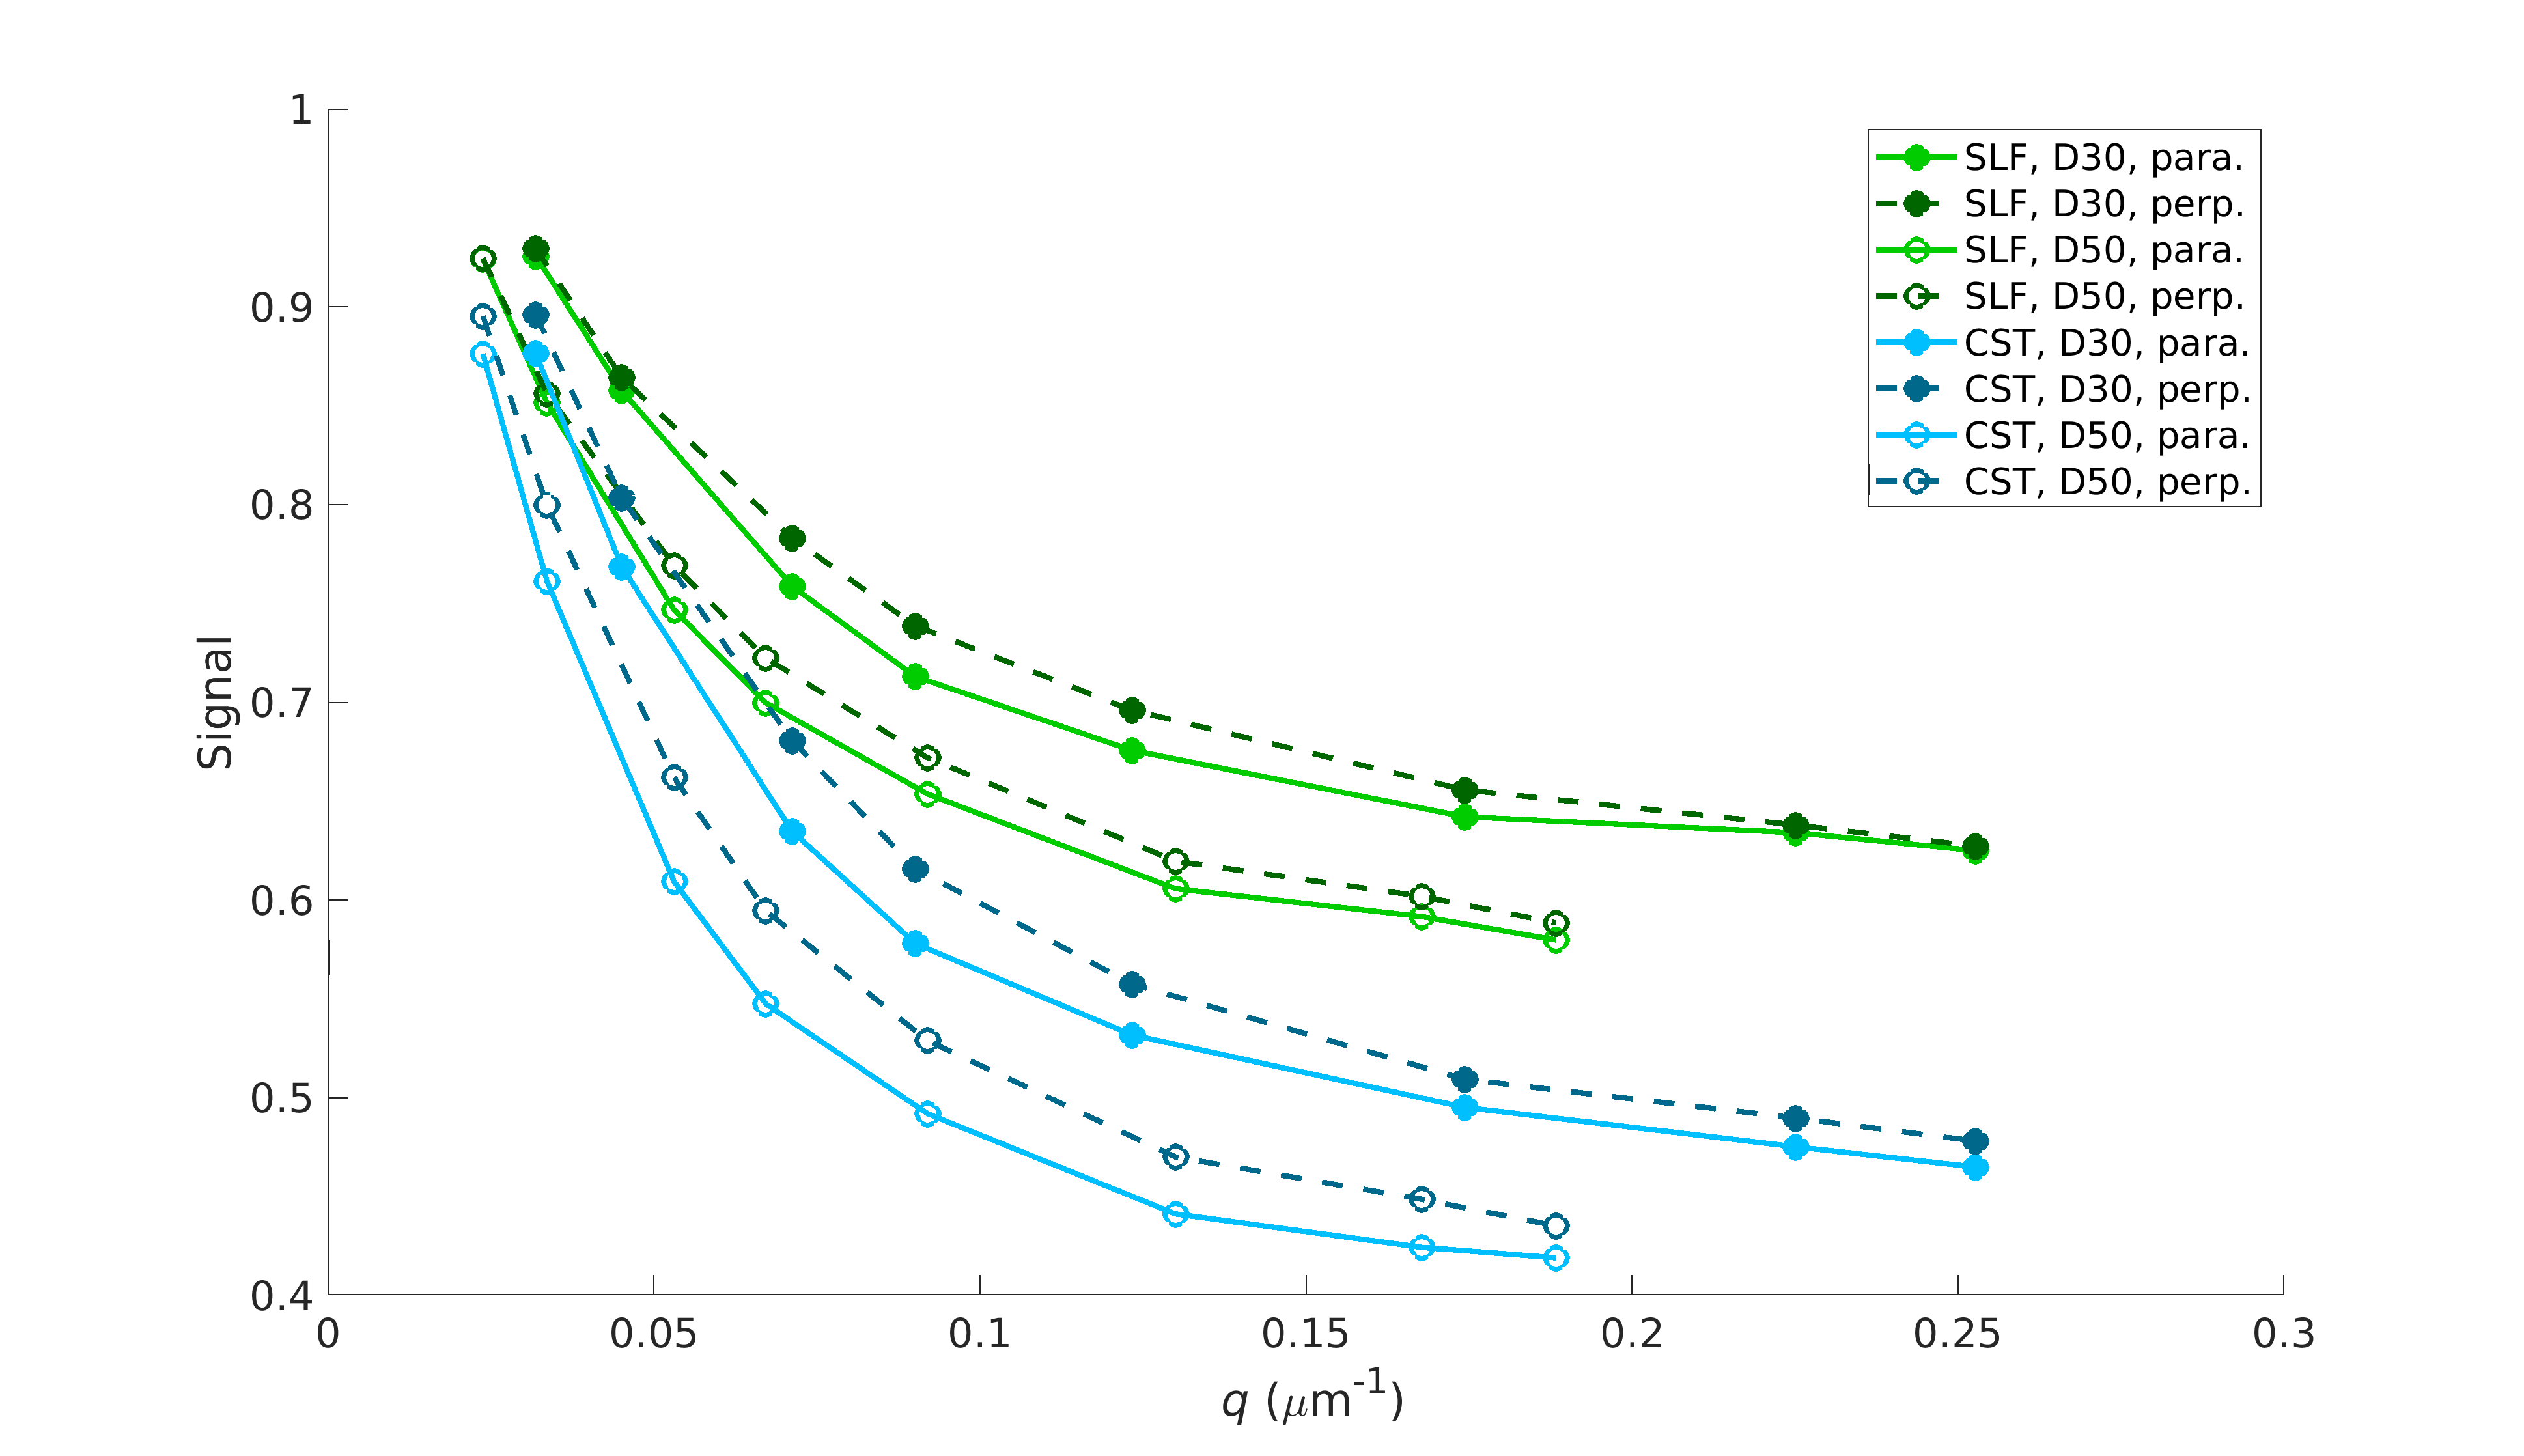
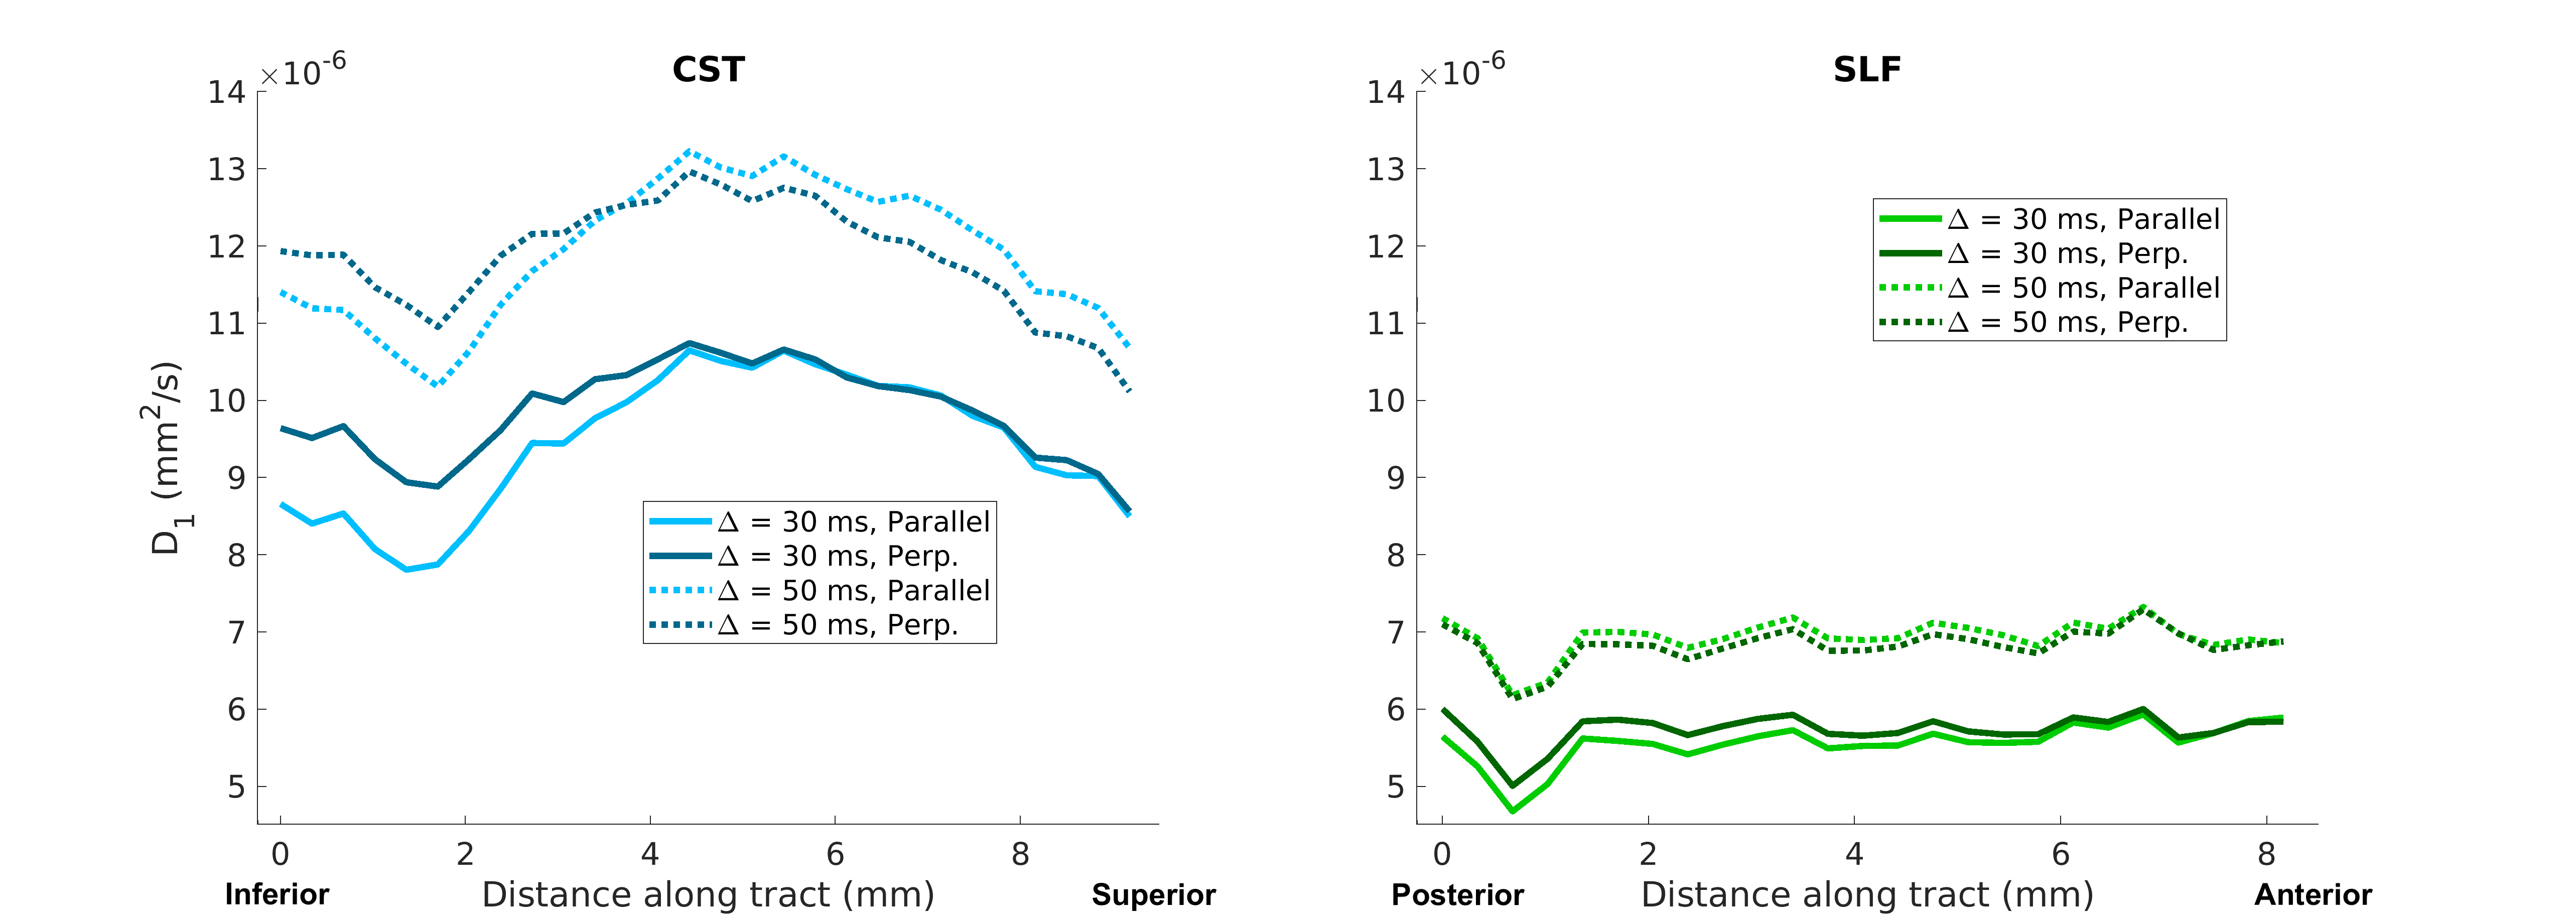
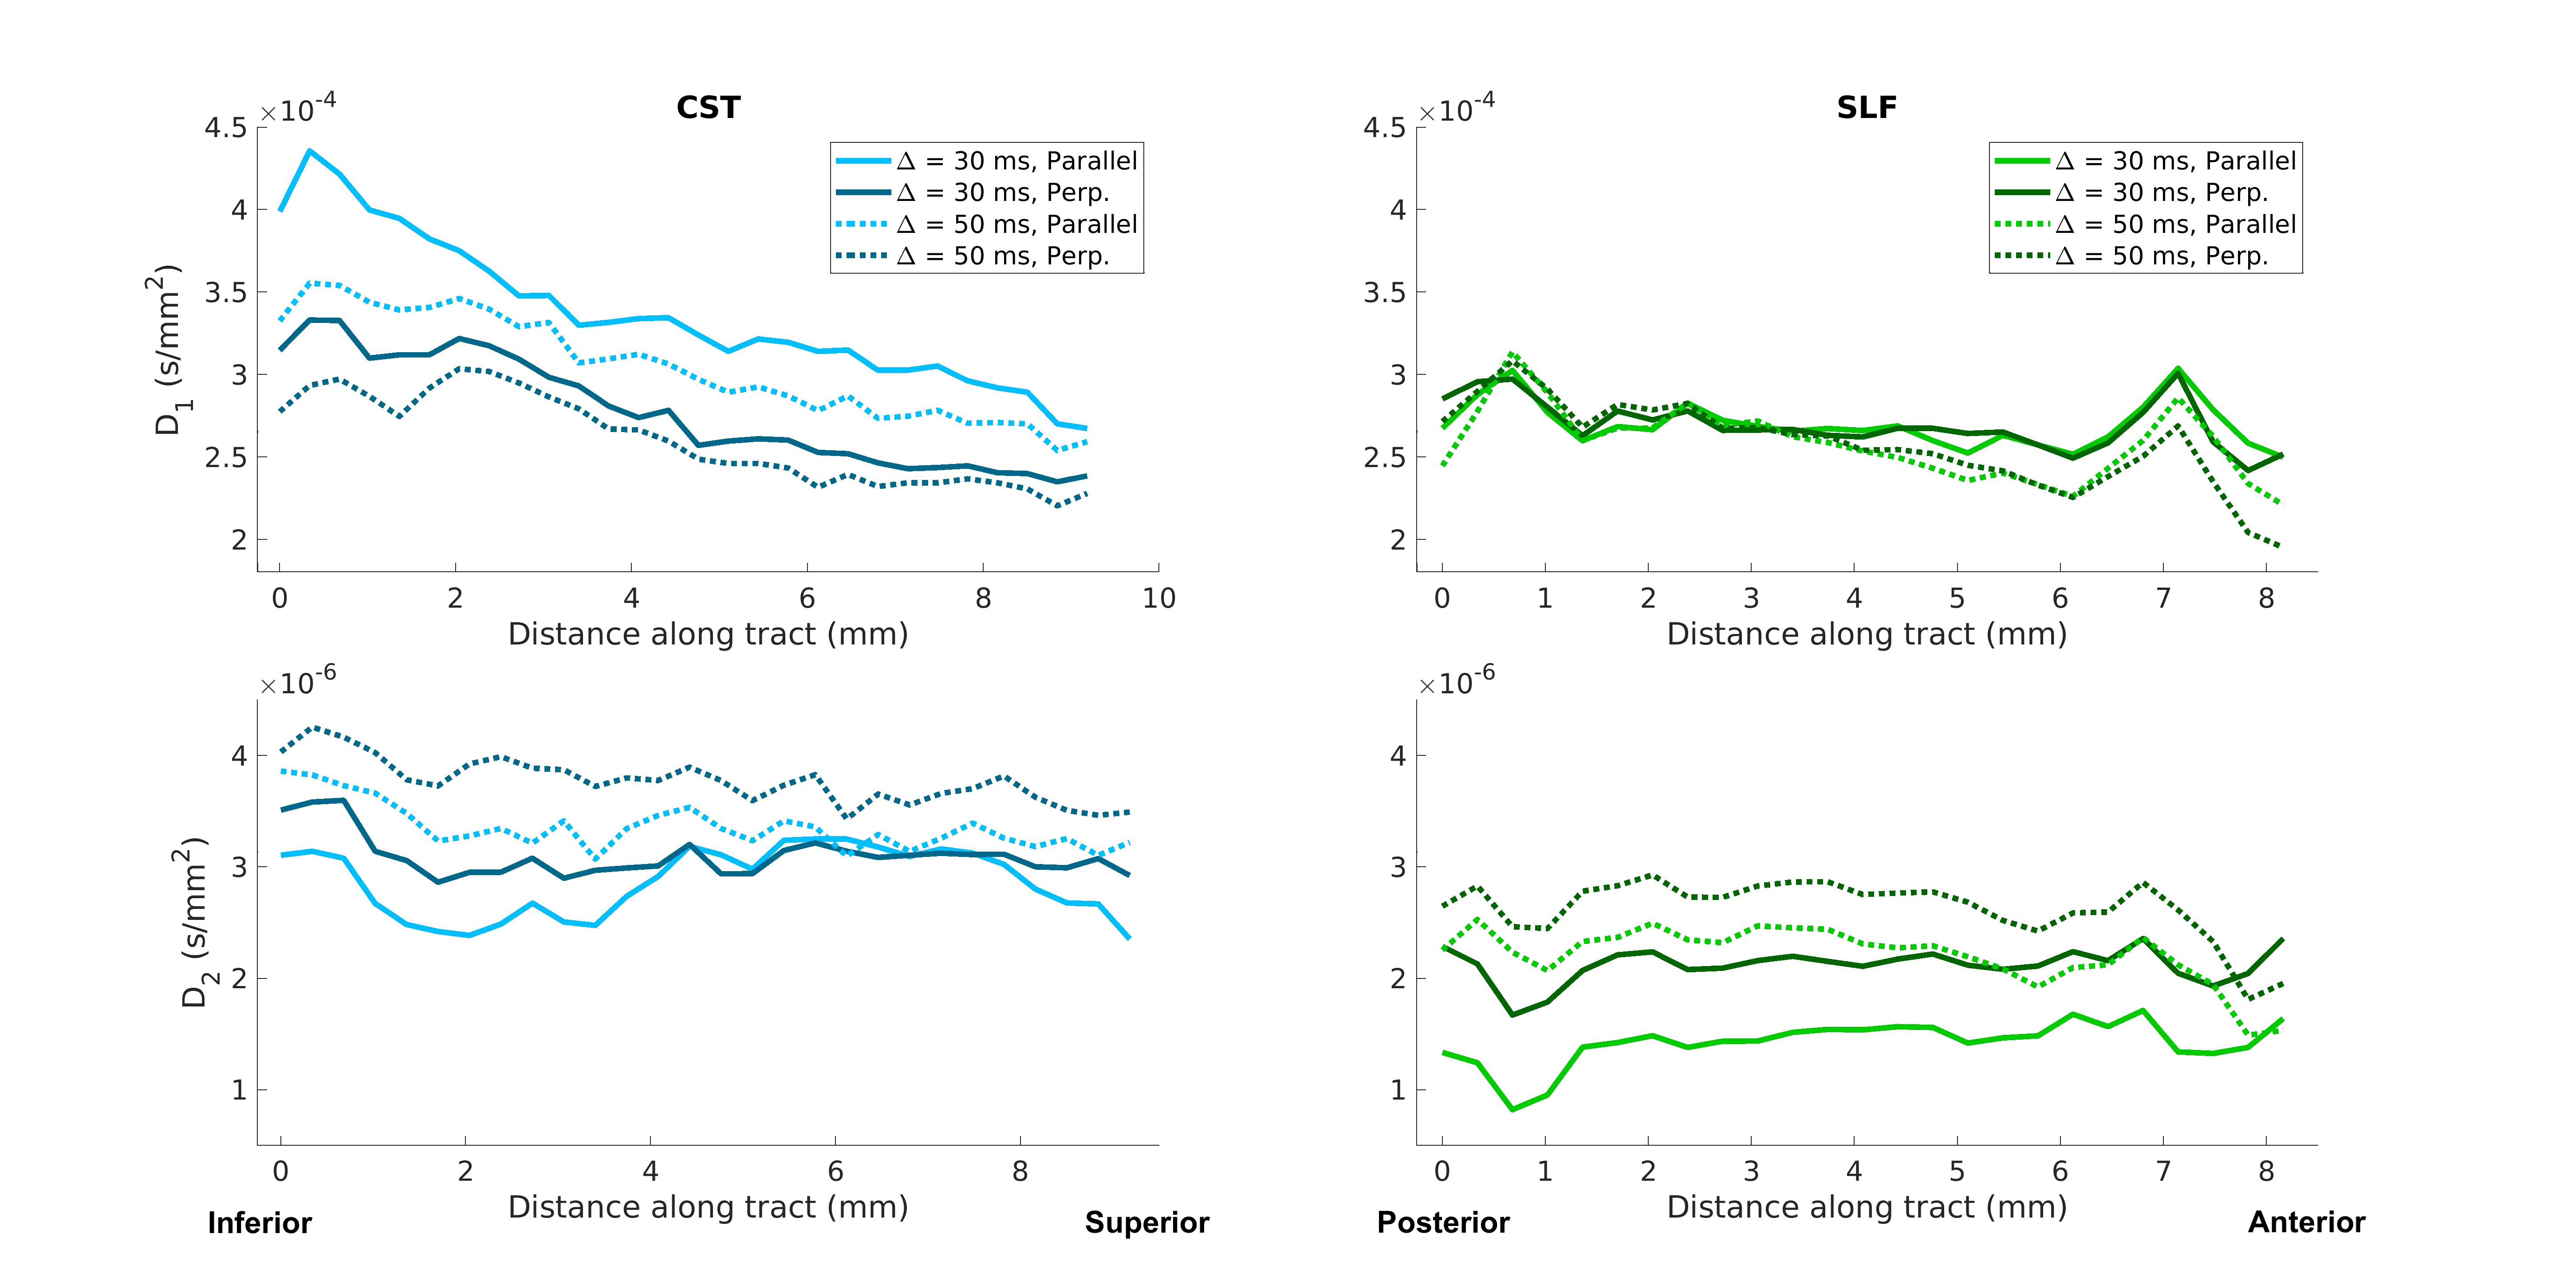
Figure 2 shows the average parallel (solid lines) and perpendicular (dotted lines) signal decay curves in the CST (blue) and SLF (green), for Δ=30 ms (filled markers) and Δ=50 ms (open markers). Standard error bars were too small to be visible in the plots.In an effort to characterize and explore the continuity of diffusive behavior parallel and perpendicular to the fiber bundles, along-tract diffusivity profiles for the CST and SLF were generated by fitting exponential functions to the average signals parallel and perpendicular signals from each axial slice in the CST ROI and each coronal slice in the SLF ROI. Figure 3 shows plots of the estimated diffusion coefficients as a function of slice, for the mono-exponential fit. Figure 4 shows the same for the bi-exponential fit, which includes a faster-diffusing component (top) and a slower-diffusing component (bottom).
Discussion
Our results show distinct differences in the perpendicular and parallel signal decay curves from the SLF and CST ROIs (Figure 2). Differences were more pronounced at higher q-values, with the perpendicular signal in the CST attenuating faster. These findings are consistent with trends observed in apparent axon diameter fitted from in vivo human diffusion MRI data acquired on a 3T Connectom scanner, where larger fiber diameters were observed in the CST compared to the SLF3. Of note, the parallel signal decay closely mirrored the perpendicular signal decay in both the CST and SLF, suggesting the presence of restriction along the length of the fibers. This behavior differs from in vivo measurements, in which the diffusion along the fibers is more Gaussian and mono-exponential in behavior.Both parallel and perpendicular diffusivities varied smoothly along each bundle and differed between bundles (Figures 3-4). In Figure 4, the diffusivity of the first compartment changed along the CST, and its difference from diffusivity in the SLF was greater in the inferior than the superior part of the CST ROI. The diffusivity of the second compartment was consistently different between the two bundles. We observed similar trends at both diffusion times.
Conclusions
The diffusion coefficients varied smoothly along each bundle and differed between bundles. These differences could be measured reliably when the voxel size was small enough to allow separation of the bundles. We compared the CST and SLF, which are known to have different microstructural features, such as myelin content and axon diameters, hence they represent a best-case scenario. Further work is needed to establish whether we can detect differences between other pairs of bundles, e.g., association pathways that intersect one another.Acknowledgements
No acknowledgement found.References
1. Girard, Gabriel, et al. "AxTract: microstructure-driven tractography based on the ensemble average propagator." International Conference on Information Processing in Medical Imaging. Springer, Cham, 2015.
2. Daducci, Alessandro, et al. "Microstructure informed tractography: pitfalls and open challenges." Frontiers in neuroscience 10 (2016): 247.
3. Huang, Susie Y., et al. "High-gradient diffusion MRI reveals distinct estimates of axon diameter index within different white matter tracts in the in vivo human brain." Brain Structure and Function 225.4 (2020): 1277-1291.
4. Fan, Qiuyun et al. “Validation of diffusion MRI estimates of compartment size and volume fraction in a biomimetic brain phantom using a human MRI scanner with 300 mT/m maximum gradient strength.” NeuroImage vol. 182 (2018): 469-478. doi:10.1016/j.neuroimage.2018.01.004
5. Veraart, J., Novikov, D.S., Christiaens, D., Ades-Aron, B., Sijbers, J. and Fieremans, E., 2016. Denoising of diffusion MRI using random matrix theory. Neuroimage, 142, pp.394-406.
6. Andersson JLR, Sotiropoulos SN. An integrated approach to correction for off-resonance effects and subject movement in diffusion MR imaging. Neuroimage. 2016 Jan 15;125:1063-1078.
7. Yeh, Fang-Cheng, Van Jay Wedeen, and Wen-Yih Isaac Tseng. "Generalized q-sampling imaging." IEEE transactions on medical imaging 29.9 (2010): 1626-1635.
8. Tuch, D.S. (2004), Q‐ball imaging. Magn. Reson. Med., 52: 1358-1372.
9. Jones R, Grisot G, Augustinack J, Magnain C, Boas DA, Fischl B, Wang H, Yendiki A. Insight into the fundamental trade-offs of diffusion MRI from polarization-sensitive optical coherence tomography in ex vivo human brain. Neuroimage. 2020 Jul 1;214:116704.
Figures