3634
A Framework to extract and visualize the myofiber helix angle locally and globally from the cardiac diffusion tensor images1DelBeat Inc., Berkeley, CA, United States, 2University of California San Francisco, San Francisco, CA, United States, 3Massachusetts General Hospital, Boston, MA, United States, 4Harvard Medical School, Boston, MA, United States
Synopsis
The DTI measurement contains measurement noise dominantly exaggerated at the myocardium boarders. Accurate fiber orientation will improve the accuracy of mathematical modeling. It may shed light on the short-term and long-term effects of scar tissue on the myofiber's morphology locally and globally. We have developed a filter based on the three measured DTI quantities of helix angle, fractional anisotropy, and mean diffusivity. This filter's result enabled us to automatically segment the myocardium's primary structural part and remove the trabeculae and papillary muscles. Hence, found a linear correlation between the fiber helix angle and the ventricle wall thickness.
Introduction
Myofiber organized morphology in the mammalian heart wall plays a significant role in cardiac functionality and efficiency [1]. Myocardium infarcted (MI) scared myofiber, and insufficient blood supply to the myocytes of the MI region in time turns them into a dead pool of randomly distributed collagen and elastin; hence, it disrupts the myofiber organization [2]. Diffusion tensor imaging (DTI) is the primary tool to study the myofiber organizations [3]. Nonetheless, there is limited consensus on how to characterize the fibers in healthy and diseased myofibers. We have learned that in a healthy heart, myofibers follow helical patterns, with the helix angle varies rapidly transmurally. For example, the helix angle in healthy swine subjects is from -60 degrees to +60 degrees at subepicardial and subendocardial surfaces, respectively. While such a two-value description of the myofiber pattern along with other rule-based mapping techniques [4, 5] are valuable, detailed ex vivo DTI reports suggest a more rigorous framework is required to interrogate a few thousand measurement points captured in the DTI images. Such a framework will (1) improve the fidelity of mechanical and electrophysiological mathematical models, (2) determine the best spatial function that describes the helical angle transmural variation, (3) find the abnormal (unorganized) region(s) of the myocardium, and (4) determine the left ventricle regions with relatively uniform fiber concentration, an essential input for predictive mathematical models. In this study, we demonstrate the capabilities of our recently developed framework addressing these four characteristics. We concluded that the myofiber helix angle is correlated with the ventricle wall thickness. However, contrary to many rule-based models [4, 5], we found the helix angles at the ventricle edges vary somewhat randomly. We also found that the MI size significantly affected the degree of randomness.Method
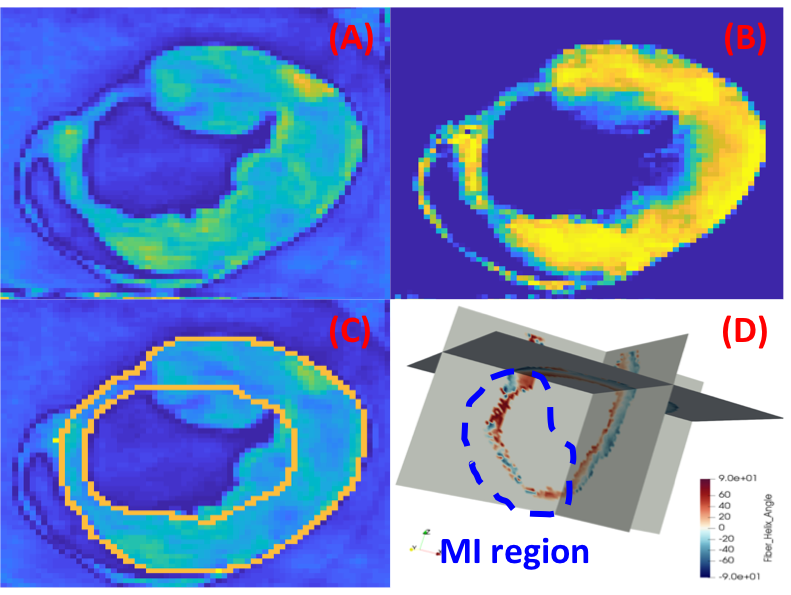
Freshly explanted hearts were subjected to an accelerated 3D submillimeter ex vivo DT-MRI acquisition for biventricular myofiber orientations. All imaging was done on a 3T Prisma MRI scanner (Siemens Healthcare). DT-MRI were performed using a multi-shot 3D diffusion prepared bSSFP sequence with $$$b_value=1000s/mm^2 $$$along 24 directions and one $$$b_value=0s/mm^2 $$$ reference, $$$TE_{prep}/TR=40 ms / 1500ms$$$ and $$$0.8x0.8x0.8 mm$$$ spatial resolution (scan time: 1.5hrs). Diffusion tensors were reconstructed from the diffusion-weighted images using linear log regression and custom Python routines based on DIPY libraries (www.dipy.org).Post-processing the acquired ex vivo DTI images yields the three scaler quantities of (a) helix angle, $$$h_a$$$, (b) fractional anisotropy, $$$F_a$$$, and (c) mean diffusivity, $$$\mu_D$$$. The images of the measured myofiber helix angles indicate specific organized patterns transmurally. However, such patterns disappear at the edge of the ventricle wall, particularly at the endocardium's trabeculae and papillary muscle regions. Consequently, accurate ventricle edge detection is essential before a rigorous characterization of the helix angle patterns. Taking advantage of distinct normalized measured scalar values of $$$h_a$$$, $$$F_a$$$, and $$$\mu_D$$$ at the edge compared with the mid-wall of the left ventricle (LV), we examined a few combinations of these three scalar values. The following equation in its normalized format highlighted the primary structural skeleton distinctively, which allowed us to use our in-house automatic segmentation tool to demarcate the LV wall.
$$Mask_1=μ_D (1-F_a )^{h_a}$$
$$Mask=1-Mask_1^{exp( {\frac{-1}{{Mask_1}^2} )} } $$
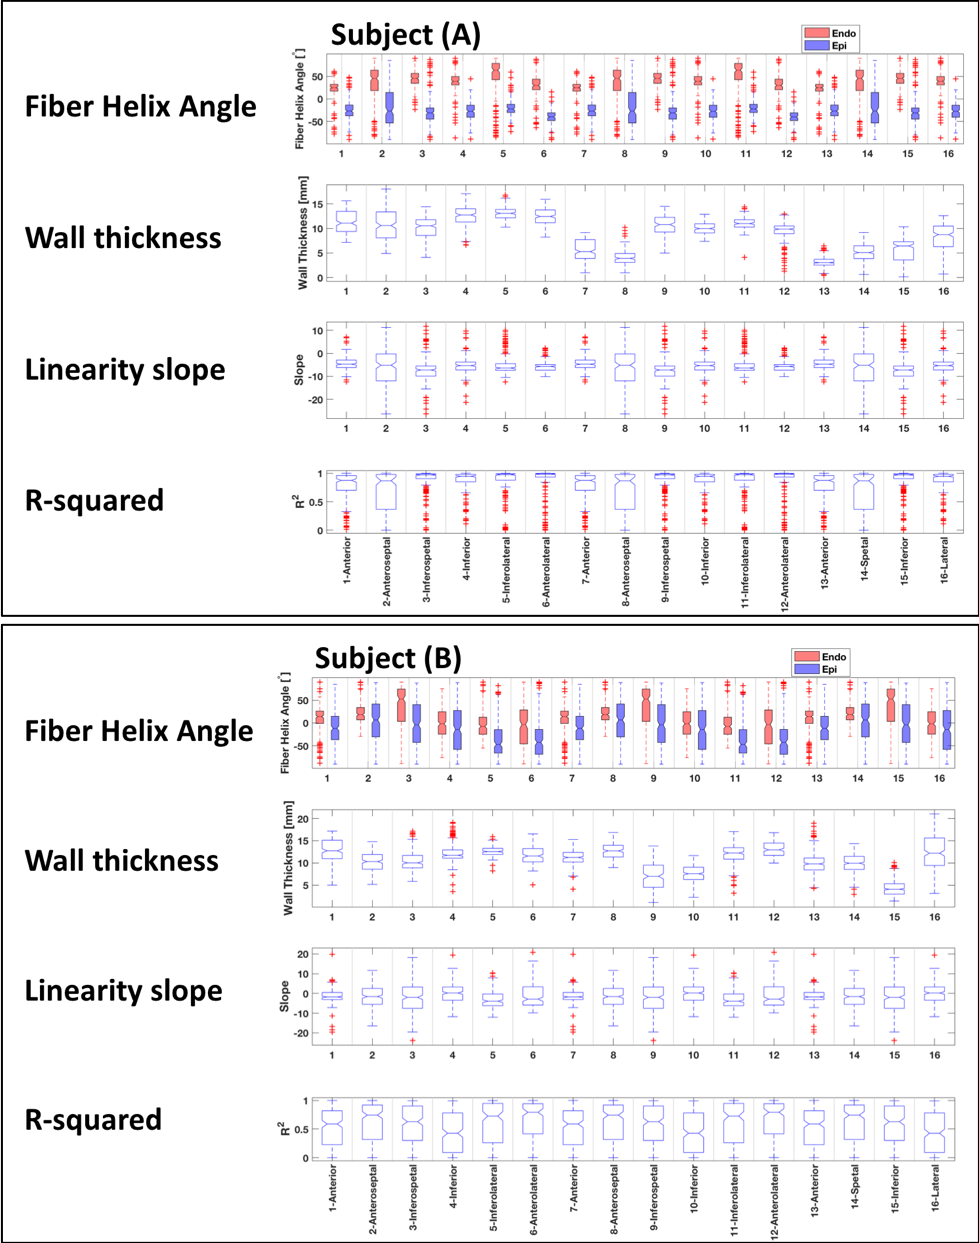
Further statistical algorithms were used to determine the outlier pixels of the measured helix angles. We examined the linearity of the helix angle as a function of the wall thickness at 360 radial rays at each short-axis image. We applied the developed method to five swine subjects ($$$n=5$$$) with different MI sizes, which were sacrificed after two months from their induced apical-septal MI.
Results
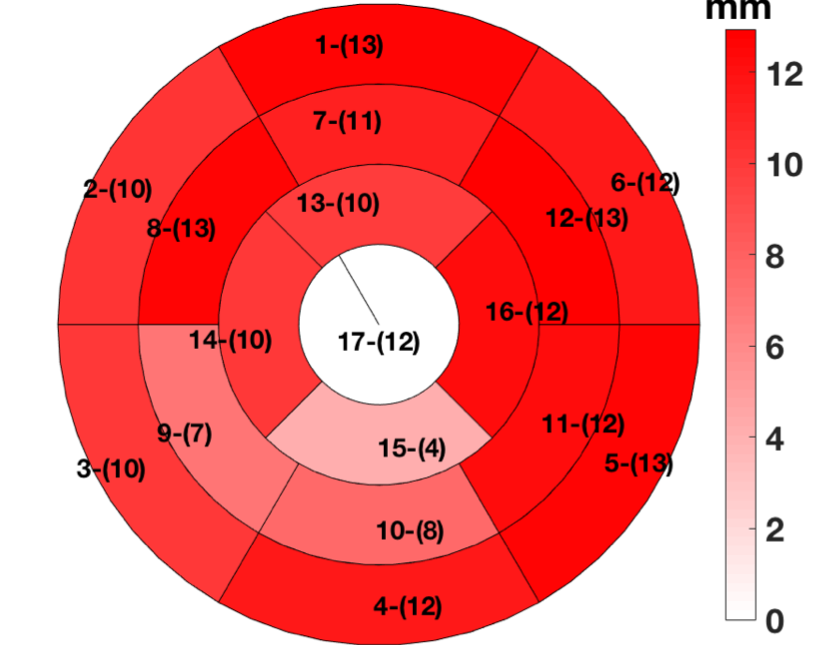
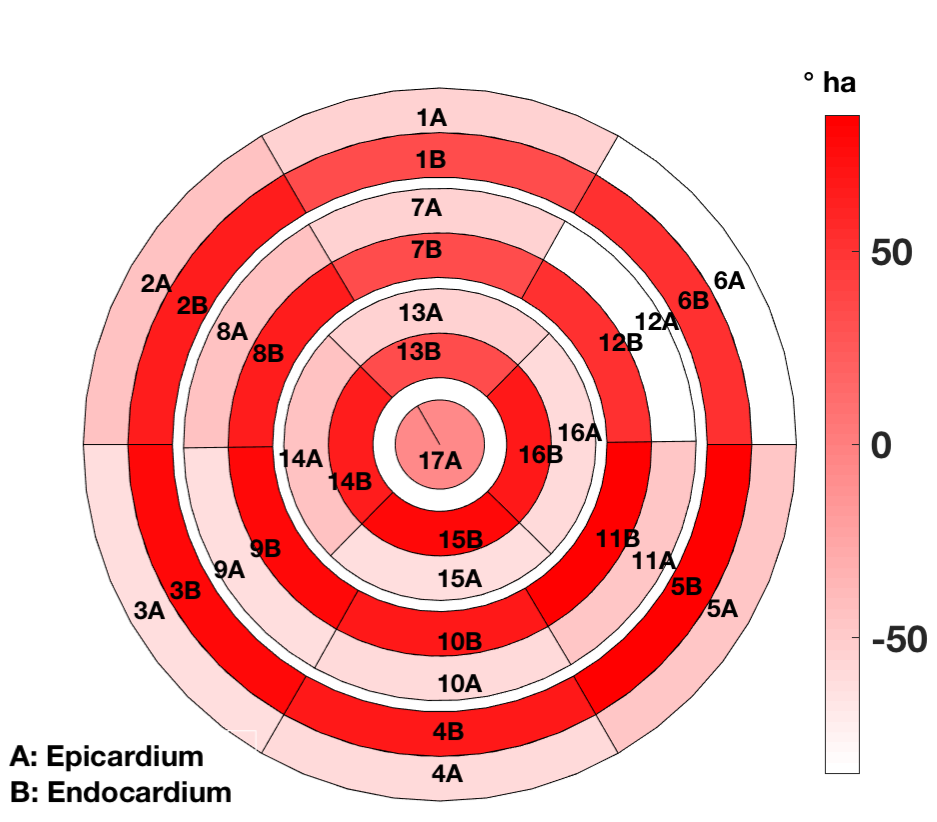
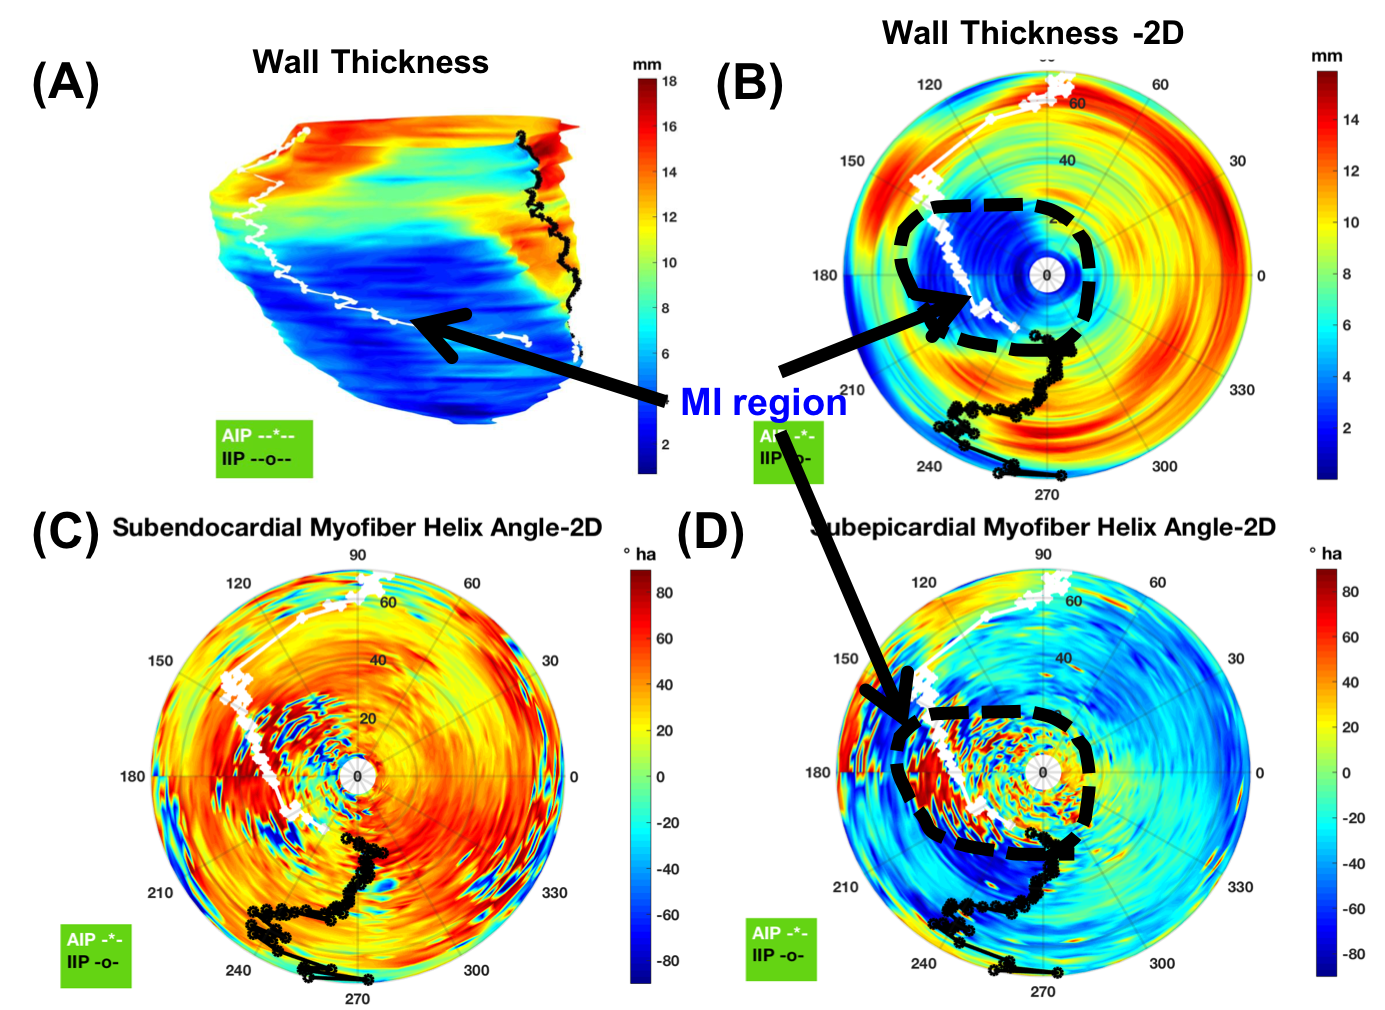
Figure-1 depicts typical filter-based masking and segmentation at one short-axis at the LV equator. The color map in the filtered image at the thin wall region at the septum indicates no specific helix angle pattern. Following the AHA 17-segment regional classification, Figure-2, and Figure-3 depicts the filtered average wall-thickness and average helix angle, respectively. To better demonstrate the myocardium's helix angle linearity aspect, we generated multiple box plots for 16 segments of the 17 AHA segmentation for each swine subject. The four box-plots showed in Figure-4A indicates a clear linear pattern (R-squared close to 1) in the most segment of the swine subject A. However, the MI caused in the swine subject B (Figure-4B) indicates how the MI's large region almost disrupted the myofiber pattern. In addition to the AHA 17-segments representation, we found that the 2D flattened view of the subendocardial and subepicardial surfaces (with a single voxel depth of 0.8 mm) captures the 3D nature of the full-field myofiber helix angle, as presented in Figure-5.Conclusion
DTI technique measures the necessary myofiber orientation distribution and angle essential for high fidelity numerical modeling of the heart and assessing the myofibril local and global health. Like any other practical measurement techniques, recognizing and filtering noise is paramount in interpreting the measurement results. The presented method proposes a rigorous framework by which the experts may utilize the ex vivo DTI measurements for modeling and diagnostic purposes. Naturally, we are examining this framework on the acquired in vivo data.Synopsis
Acknowledgements
No acknowledgement found.References
[1]. Kirn, B., Walmsley, J. and Lumens, J., 2018. Uniqueness of local myocardial strain patterns with respect to activation time and contractility of the failing heart: a computational study. Biomedical engineering online, 17(1), p.182.
[2]. Sack, K.L., Aliotta, E., Ennis, D.B., Choy, J.S., Kassab, G.S., Guccione, J.M. and Franz, T., 2018. Construction and validation of subject-specific biventricular finite-element models of healthy and failing swine hearts from high-resolution DT-MRI. Frontiers in Physiology, 9, p.539.
[3]. Winklhofer, S., Stoeck, C.T., Berger, N., Thali, M., Manka, R., Kozerke, S., Alkadhi, H. and Stolzmann, P., 2014. Post-mortem cardiac diffusion tensor imaging: detection of myocardial infarction and remodeling of myofiber architecture. European radiology, 24(11), pp.2810-2818.
[4]. Savadjiev, P., Strijkers, G.J., Bakermans, A.J., Piuze, E., Zucker, S.W. and Siddiqi, K., 2012. Heart wall myofibers are arranged in minimal surfaces to optimize organ function. Proceedings of the National Academy of Sciences, 109(24), pp.9248-9253.
[5]. Zhang, X., Haynes, P., Campbell, K.S. and Wenk, J.F., 2015. Numerical evaluation of myofiber orientation and transmural contractile strength on left ventricular function. Journal of biomechanical engineering, 137(4).
Figures