3632
Assessment of different b values in motion-controlled myocardium spin echo diffusion tensor imaging in vivo1Philips Healthcare (Suzhou) Co., Ltd, Suzhou, China, 2Philips (China) Investment Co., Ltd., Shanghai, China, 3Ruijin Hospital, Shanghai Jiaotong University School of Medicine, Shanghai, China
Synopsis
Diffusion MR is challenging in myocardium because of respiratory motion, cardiac pulsation, and field inhomogeneity in thorax. Diffusion tensor imaging using SE-EPI with respiratory navigation and cardiac triggering of 3 b values (300, 500, 800 s/mm2) was performed in 9 subjects. Sufficient image quality was obtained with b values of 300 and 500 s/mm2. Significant difference was found in SNR, CNR, MD, and FA between various b values while not between myocardium segments. Intermediate b values are recommended to achieve a balance of image quality and diffusion sensitivity . Sufficient myocardium quiescent duration is extremely important for optimal diffusion image quality.
INTRODUCTION
There is a growing interest for diffusion tensor imaging (DTI) due to its unique ability to noninvasively illustrate the fiber structure in myocardium. In practice, myocardial DTI remains challenging because of signal loss caused by non-rigid deformation and displacement during cardiac cycle, relatively short T2 of myocardium, and complex field inhomogeneity in thorax 1-3. Stimulated echo echo-planar imaging (STE-EPI), motion compensated spin echo (SE) EPI, and principal component analysis filtering have been demonstrated to reduce sensitivity to bulk motion in myocardial DTI 1,4-6. STE-EPI typically requires two successive heartbeats for one shot, leading to longer scan time. Motion compensated SE-EPI prolongs echo time (TE) and hence impacts signal-to-noise (SNR). In this study, we explored the possibility of SE-EPI myocardial DTI. To obtain optimal diffusion weighting, image quality of different b values was evaluated. The relationship between SNR, contrast-to-noise ratio (CNR) and myocardium quiescent duration was investigated.METOHDS
Study sample: Five female and four male healthy subjects (mean age, 41.4 ± 14.1 years; heartrate, 66.2 ± 4.6 bpm) underwent cardiac DTI. All parts of this study were approved by local institutional review board and written consent form was obtained from each subject. MR imaging: Cardiac DTI was performed on a 3 Tesla MR scanner (Elition X, Philips Healthcare, Best, the Netherlands, Max G 45 mT/m, Max SR 220 T/m/s) using a 16-channel anterior coil and a 12-channel posterior coil. A 2D balanced FFE cine scan was performed with breath-hold to determine the myocardium quiescent duration in a heart cycle. A free breathing cine scan ensued for navigator placement. SE-EPI DTI with respiratory navigation and fat suppression was then performed with the following parameters: voxel size 2.5 × 2.5 × 5 mm3, FOV 320 × 320 mm2, slice number 1, half scan factor 0.6, SENSE factor 2.0, NSA 6, TR 1 heartbeat, diffusion direction number 15, navigator acquisition window 6 mm, 3 b values (300, 500, 800 s/mm2) were acquired separately with b0, corresponding TEs were 38, 43, 48 ms, respectively, scan time ~5 min for each b value considering navigation efficiency was ~60%.Data Analysis: The diffusion weighted images calculated with images of all directions were reviewed by two radiologists (15 and 6 years of experience) blinded to each other. Each reviewer drew six regions of interest (ROIs) in anterior, antero-lateral, infero-lateral, inferior, infero-septal, and antero-septal part in myocardium. A 1 to 5 rating principle was used to evaluate the image quality of each ROI. SNR and CNR were calculated in these areas with the following equations:
SNR = mean(Smyo)/SD(Snoise)
CNR = (mean(Smyo)-mean(Sbp))/SD(Snoise)
where, Smyo and Sbp are the signal of certain myocardium ROI and blood pool, respectively. Mean diffusivity (MD) and fractional anisotropy (FA) were obtained in six ROIs. SNR, CNR, MD, and FA were compared between the ROIs and b values using two-way analysis of variance with SPSS 23.0 (IBM Inc., USA). Pearson correlation coefficients were calculated between SNR, CNR of different b values and quiescent duration.
RESULTS
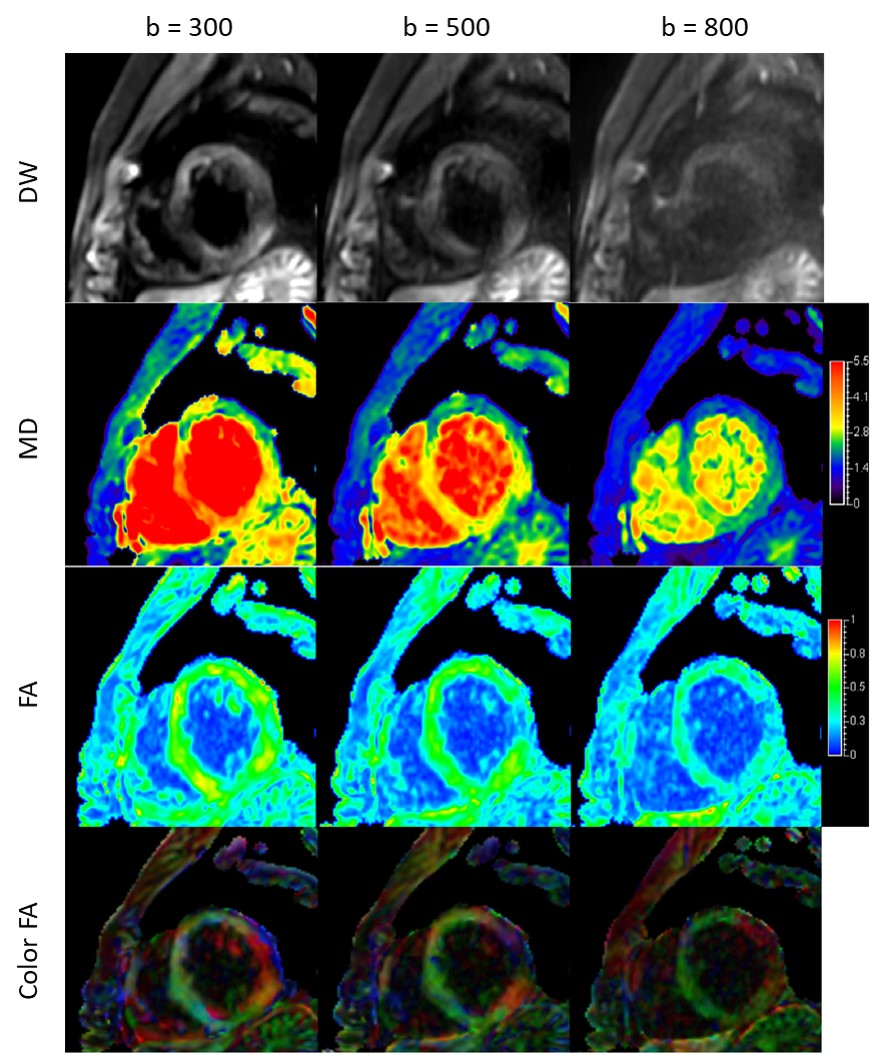
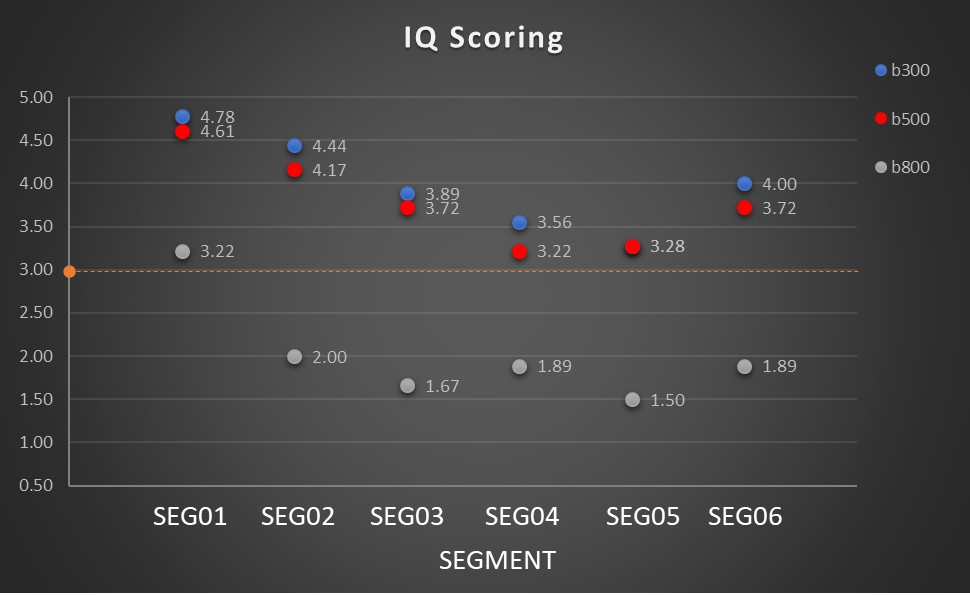
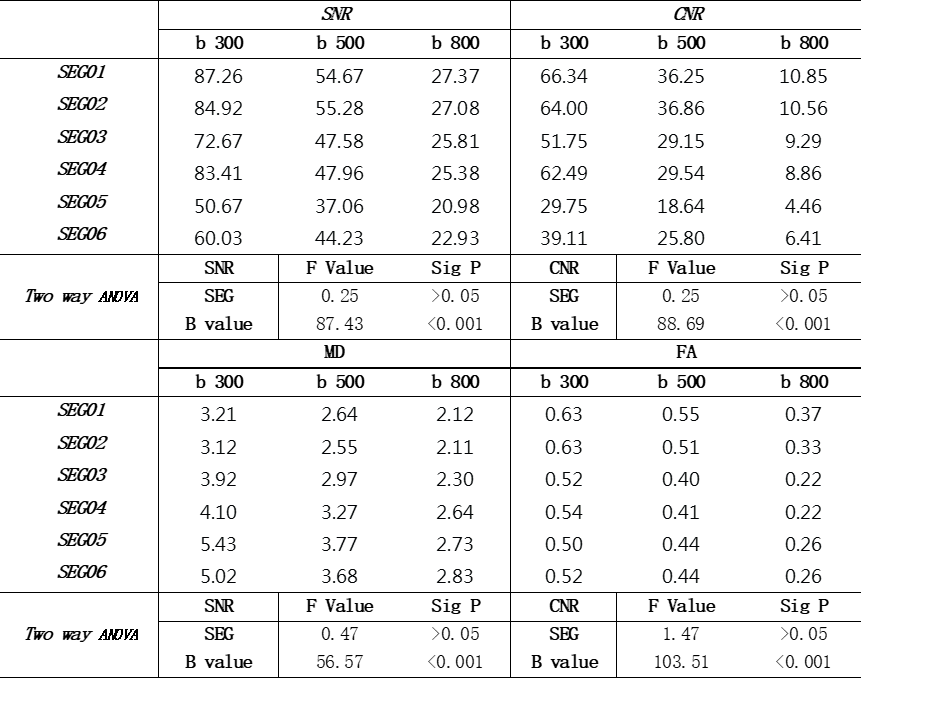
Image quality degraded along with increasing b values. MD was lower at higher b values. Typical DW images, MD, FA maps are shown in Figure 1. Overall mean image quality score was lower than 3.0 points in images of b value 800 s/mm2, while comparable image quality scores more than 3.0 points were achieved with b values of 300 and 500 s/mm2 (Figure 2).Mean SNR, CNR, MD, FA in each segment of myocardium at each b value are listed in Table 1. Significant difference was found between b values for all four indices (SNR: F=87.43, P<0.001; CNR: F=88.69, P<0.001; MD: F=56.57, P<0.001; FA: F=103.51, P<0.001). No significant difference was found between segments (SNR: F=0.25, P>0.05; CNR: F=0.25, P>0.05; MD: F=0.47, P>0.05; FA: F=1.47, P>0.05).
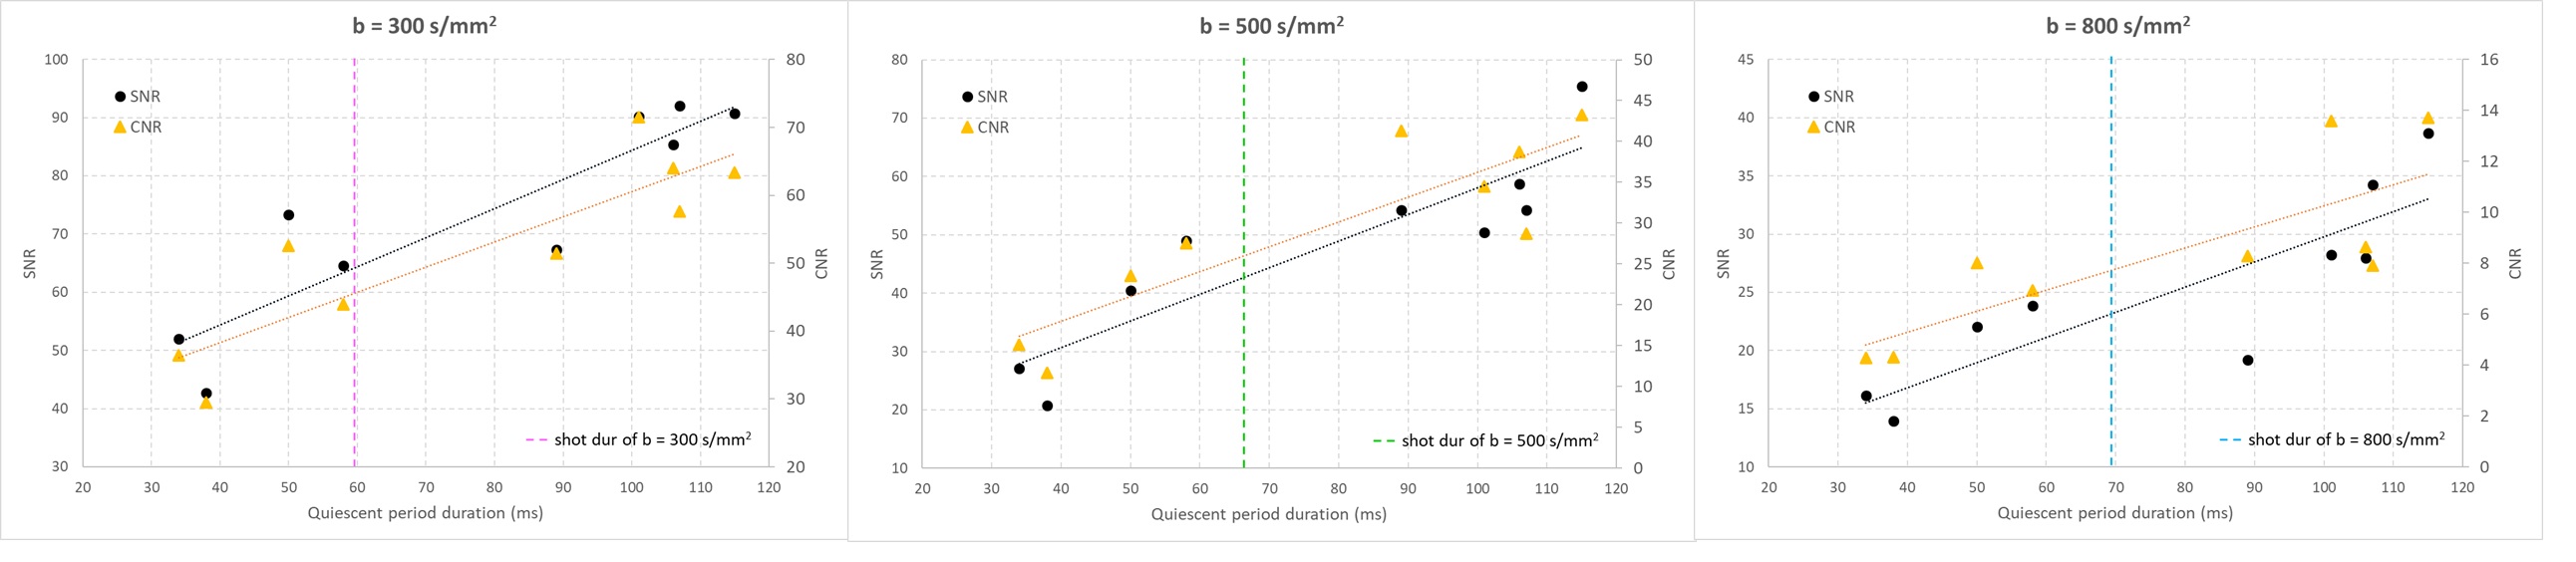
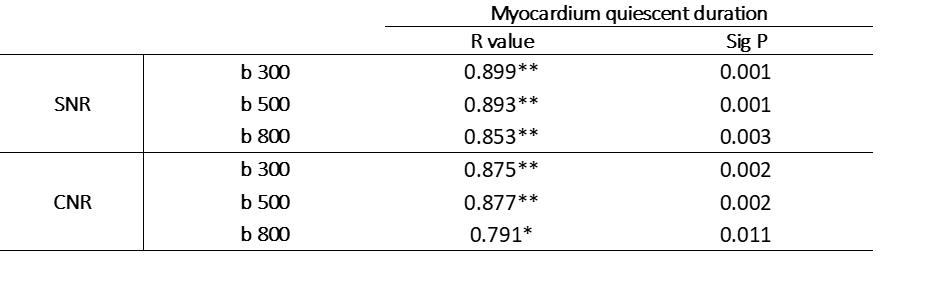
In subjects with longer myocardium quiescent duration, SNR and CNR of combined diffusion images generally increased in all b values (Figure 3). Strong correlation was found betweenSNR, CNR and quiescent duration (Table 2).
DISCUSSION
The results of this study demonstrate the feasibility of cardiac DTI with intermediate b value using conventional SE-EPI in a clinical scanner. To reduce the impact from motion, cine scans monitoring diaphragm movement and cardiac cycle respectively should be performed to determine optimal navigator placement and cardiac trigger delay.The quiescent duration varies between subjects. Besides increasing b value, both mean SNR and CNR have a strong correlation with myocardium quiescent duration, indicating that it is essential to keep shot duration shorter than available quiescent duration of each subject. When shot duration of diffusion sequence is too long compared with available quiescent duration, manipulation such as medication control, or better gradient performance should be considered.
CONCLUSION
Although SNR and CNR decrease with higher b values inevitably, it is still feasible to obtain optimal image quality, SNR, CNR in myocardial diffusion tensor imaging with prudently choice of navigator acquisition window and cardiac trigger delay. According to the result of our study, an intermediate b value (300~500 s/mm2) is recommended reasonably to achieve sufficient image quality and diffusion sensitivity with acceptable scan time. Sufficient myocardium quiescent duration with corresponding shot duration is extremely important for good image quality.Acknowledgements
No acknowledgement found.References
1. Nielles‐Vallespin S, Mekkaoui C, Gatehouse P, et al. In vivo diffusion tensor MRI of the human heart: reproducibility of breath‐hold and navigator‐based approaches[J]. Magnetic resonance in medicine, 2013, 70(2): 454-465.2.
2. Wei H, Viallon M, Delattre B M A, et al. Assessment of cardiac motion effects on the fiber architecture of the human heart in vivo[J]. IEEE transactions on medical imaging, 2013, 32(10): 1928-1938.3.
3. Scott A D, Ferreira P F, Nielles‐Vallespin S, et al. Optimal diffusion weighting for in vivo cardiac diffusion tensor imaging[J]. Magnetic resonance in medicine, 2015, 74(2): 420-430.4.
4. Scott A D, Nielles-Vallespin S, Ferreira P F, et al. An in-vivo comparison of stimulated-echo and motion compensated spin-echo sequences for 3 T diffusion tensor cardiovascular magnetic resonance at multiple cardiac phases[J]. Journal of Cardiovascular Magnetic Resonance, 2018, 20(1): 1.5.
5. Lasič S, Szczepankiewicz F, Dall'Armellina E, et al. Motion‐compensated b‐tensor encoding for in vivo cardiac diffusion‐weighted imaging[J]. NMR in Biomedicine, 2020, 33(2): e4213.6.
6. Von Deuster C, Stoeck C T, Genet M, et al. Spin echo versus stimulated echo diffusion tensor imaging of the in vivo human heart[J]. Magnetic resonance in medicine, 2016, 76(3): 862-872.
Figures