3631
Assessment of myocardial involvement characteristics by cardiac MR imaging in patients with polymyositis and dermatomyositis
Changjing Feng1, Wangyan Liu1, Xiaoxuan Sun1, Qiang Wang1, Xiaomei Zhu1, Xiaoyue Zhou2, Yi Xu1, and Yinsu Zhu1
1The First Affiliated Hospital of Nanjing Medical University, Nanjing, China, 2Siemens Healthineers Ltd., Shanghai, China
1The First Affiliated Hospital of Nanjing Medical University, Nanjing, China, 2Siemens Healthineers Ltd., Shanghai, China
Synopsis
Cardiac involvement is frequently observed in polymyositis (PM) and dermatomyositis (DM) but typically remains subclinical. Cardiac MR tissue characterization parameters could serve as early detection markers for myocardial involvement in PM/DM patients without overt LV dysfunction. PM and DM patients showed a different positive segment distribution of myocardial involvement, where PM patients was more serious than that in DM patients. Above all, CMR tissue characterization parameters can detect myocardial involvement characteristics between PM and DM and compare the differences between them.
Introduction
Idiopathic inflammatory myopathy (IIM) is a group of systematic autoimmune disorders with a global average prevalence of 4.27-7.89/ 100,000 individuals1. Polymyositis (PM) and dermatomyositis (DM) are the most common types of IIM, affecting skeletal muscles and internal organs2. Myocardial involvement happens frequently in PM and DM but is subclinical in most cases2-4. Cardiac magnetic resonance (CMR) imaging is emerging as a non-invasive and reliable tool for facilitating the diagnosis of myocarditis4, 5 and myocardial involvement in autoimmune diseases6. This study was aimed to investigate myocardial involvement characteristics and compare its differences in patients with PM and DM by CMR.Methods
A total of 17 PM and 27 DM were enrolled in this retrospectively study. A 3T MR scanner (MAGNETOM Skyra, Siemens Healthcare, Erlangen, Germany) was used for all the CMR scan. CMR 2-chamber, 4-chamber, and shot-axis cine images were derived with a standard segmented balanced steady-state free-processing (bSSFP) sequence. The typical parameters were as follows: field of view (FOV), 340-380 mm; repetition time (TR)/echo time (TE), 3.4/1.4 ms; matrix size, 208×188; voxel size, 1.6×1.6×8.0 mm3; bandwidth, 962 Hz/px; flip angle (FA), 47°; slice thickness, 8 mm; and inter-slice gap, 2 mm. LGE images were acquired 8–15 min after intravenous administration of gadolinium-DTPA (Magnevist, Bayer, Berlin, Germany) at a dose of 0.2 mmol/kg in short-axis stack using a phase-sensitive inversion-recovery (PSIR) gradient echo sequence. Inversion times were adjusted to null the signal from normal myocardium (FOV, 340-380 mm2; matrix size, 256×220; voxel size, 1.3×1.3×8.0 mm3; bandwidth, 781 Hz/px; TR, 485 ms; TE, 1.24 ms; FA, 55°). Typical parameters of motion-corrected basal, mid, and apical level of LV short-axis Modified Look-Locker inversion-recovery (MOLLI) T1-mapping sequence with a 5b(3b)3b scheme before and 15-20 min after intravenous contrast agent injection were as follows: FOV, 340-380 mm; matrix size, 192×172; voxel size, 1.3×1.3×8.0 mm3; bandwidth, 1085 Hz/px; TR/TE, 2.9/1.15 ms; and FA, 35°. Inversion time was individually adjusted for complete nulling of the myocardium. T2 mapping was acquired with the same image planes as T1 mapping using a T2-prepared sequence with three different TE times (0 ms, 30 ms, 55 ms). Left ventricular (LV) morphologic and functional parameters and CMR tissue characterization imaging, including global native T1, T2, extracellular volume (ECV), and late gadolinium enhancement (LGE), were analyzed using the cvi42 software (Circle Cardiovascular Imaging Inc., Calgary, Alberta, Canada). Global native T1, T2, and ECV were analyzed by the 16 American Heart Association (AHA) segment.Results
The LGE, T1, and ECV maps of one PM and one DM patient are shown in Figure 1. Patients in the PM/DM group showed elevated global native T1 and ECV values (Table 1). Global ECV values were higher in the PM group when compared to the DM group (ECV, 33 ± 3 % vs. 30 ± 4 %; p = 0.039) (Figure 2). PM and DM groups showed a different positive segment distribution of native T1, T2, and ECV, where positive segments of in PM patients were more than those of DM patients (Figure 3). No significant differences in LV functional parameters were observed between PM and DM groups, and most of them were in normal range (Table 1).Discussion
In this study, we retrospectively evaluated the CMR parameters of PM and DM patients. Although the laboratory characteristics were elevated, the PM/DM group showed a normal LV volume and EF values, thereby suggesting the subclinical stage. Our data revealed two patterns of myocardial damage. For PM patients, LGE with patchy or strip was specifically tendency located at interventricular septum and insertion sites, especially insertion sites. For DM patients, LGE tendency occurs in the interventricular septum and inferior segments with non-ischemic pattern. In our cohort, the mean global ECV was higher in PM patients compared with DM patients, which proved that PM patients had a tendency of higher myocardial involvement when compared to DM patients. In our analysis, we differentiated myocardium segments, instead of analyzing as a whole as seen in most published studies7. Segmental analysis of global native T1 values in patients with PM and DM showed that the prolonged native T1 values predominately involved segments of the interventricular septum, but the number of prolonged native T1 segments of PM were more than those of DM. Moreover, the number of prolonged ECV segments were more than the prolonged native T1 segments in both PM and DM patients, but the number of prolonged ECV segments of PM were also more than that of DM. The prolonged native T1 and ECV values reflect necrosis and fibrosis, which can lead to both conduction disturbances and supraventricular or ventricular arrhythmias as demonstrated in previous studies8. Our results suggested that PM patients had a tendency of a wider range of myocardial necrosis and fibrosis than DM patients.Conclusions
In conclusion, CMR tissue characterization imaging provided excellent performance for assessing the myocardial involvement in PM and DM patients with normal left ventricular function during the subclinical stage. Furthermore, the characteristics of myocardial involvement was different between PM patients and DM patients, and myocardial involvement in patients with PM was more serious when compared to patients with DM.Acknowledgements
No acknowledgement found.References
1 Mandel DE, Malemud CJ, Askari AD. Idiopathic Inflammatory Myopathies: A Review of the Classification and Impact of Pathogenesis. Int J Mol Sci. 2017;18(5):1084. 2 Mavrogeni S, Douskou M, Manoussakis MN. Contrast-Enhanced CMR Imaging Reveals Myocardial Involvement in Idiopathic Inflammatory Myopathy Without Cardiac Manifestations. JACC Cardiovasc Imaging. 2011;4(12):1324-1325. 3. Diederichsen LP. Cardiovascular involvement in myositis. Curr Opin Rheumatol. 2017;29(6):598-603. 4. Rosenbohm A, Buckert D, Gerischer N, et al. Early diagnosis of cardiac involvement in idiopathic inflammatory myopathy by cardiac magnetic resonance tomography. J Neurol. 2015;262(4):949-956. 5. Allanore Y, Vignaux O, Arnaud L, et al. Effects of corticosteroids and immunosuppressors on idiopathic inflammatory myopathy related myocarditis evaluated by magnetic resonance imaging. Ann Rheum Dis. 2006;65(2):249-252. 6. Mavrogeni SI, Kitas GD, Dimitroulas T, et al. Cardiovascular magnetic resonance in rheumatology: Current status and recommendations for use. Int J Cardiol. 2016;217:135-148. 7. Yu L, Sun J, Sun J, et al. Early detection of myocardial involvement by T1 mapping of cardiac MRI in idiopathic inflammatory myopathy. J Magn Reson Imaging. 2018;48(2):415-422. 8. Thavendiranathan P, Walls M, Giri S, et al. Improved Detection of Myocardial Involvement in Acute Inflammatory Cardiomyopathies Using T2 Mapping. Cir Cardiovasc Imaging. 2012;5(1):102-110.Figures
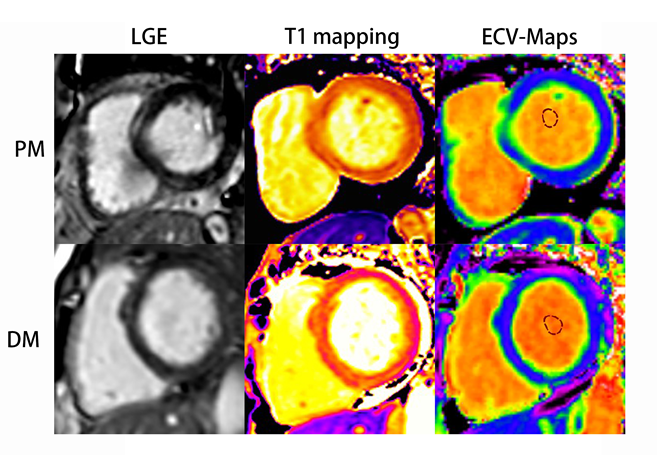
Course of late gadolinium enhancement (LGE), Native myocardial T1 and ECV
map images in PM and DM patients, respectively. LGE detected mid-wall
enhancement in the interventricular septum and inferior in PM and subepicardial
enhancement in the interventricular septum and inferior in DM. LGE volume of 16%
in both the PM and DM patients. Mean global native T1 and ECV values were 1281
ms and 32%, 1283 ms and 30% in PM and DM patients, respectively.
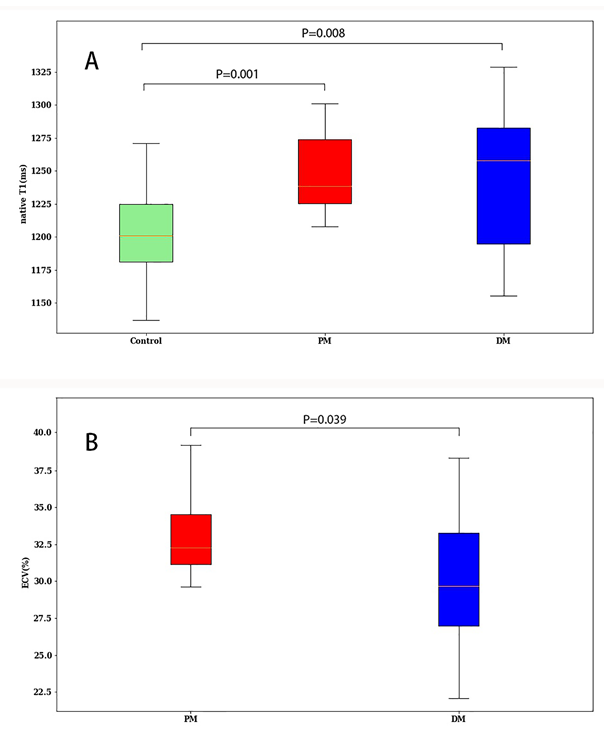
Global
native T1 (A) in control (green), Polymyositis (PM) (red), and Dermatomyositis (DM)
(blue) and global ECV (B) in Polymyositis (PM) (red), and Dermatomyositis (DM) (blue)
showed by box plots.
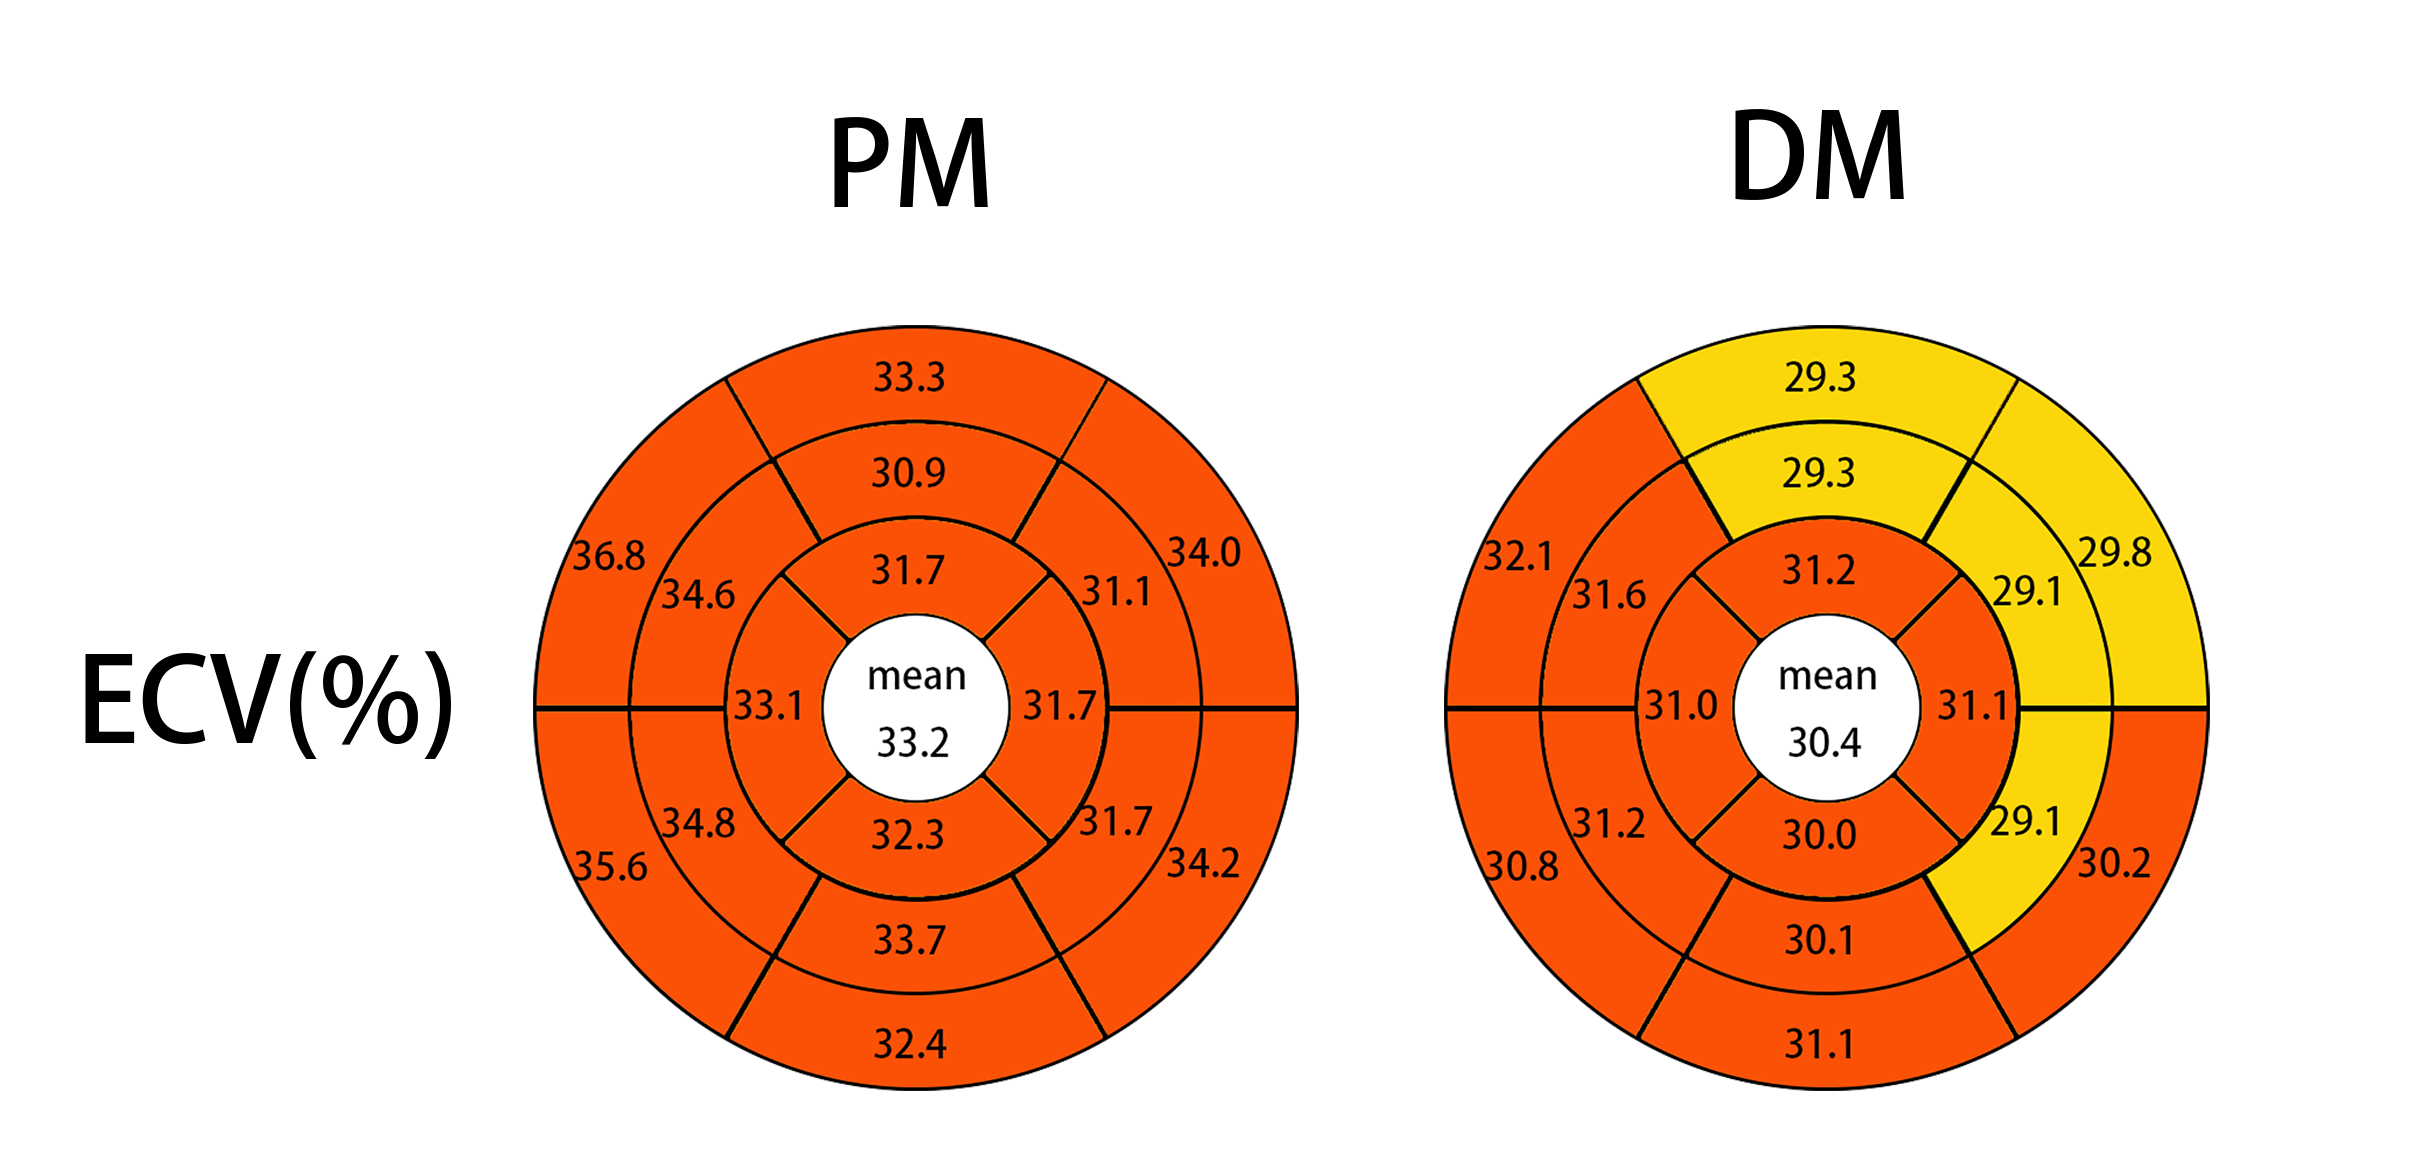
Bullseye plots comparing the ECV values of PM and DM. Segmentation was
performed according to the AHA 16-segment model in three short-axis slices. The
average across all segments is given in the center of the bullseye. ECV values
of more than the cutoff 29.88% of previous study showed with red color.

Data are presented as mean ± SD. PM, polymyositis; DM, dermatomyositis; LV, left ventricle; EDV, end-diastolic volume; ESV, end-systolic volume; SV, stroke volume; EF, ejection fraction; and ECV, extracellular volume fraction. ^P < 0.05 compared between PM and DM.
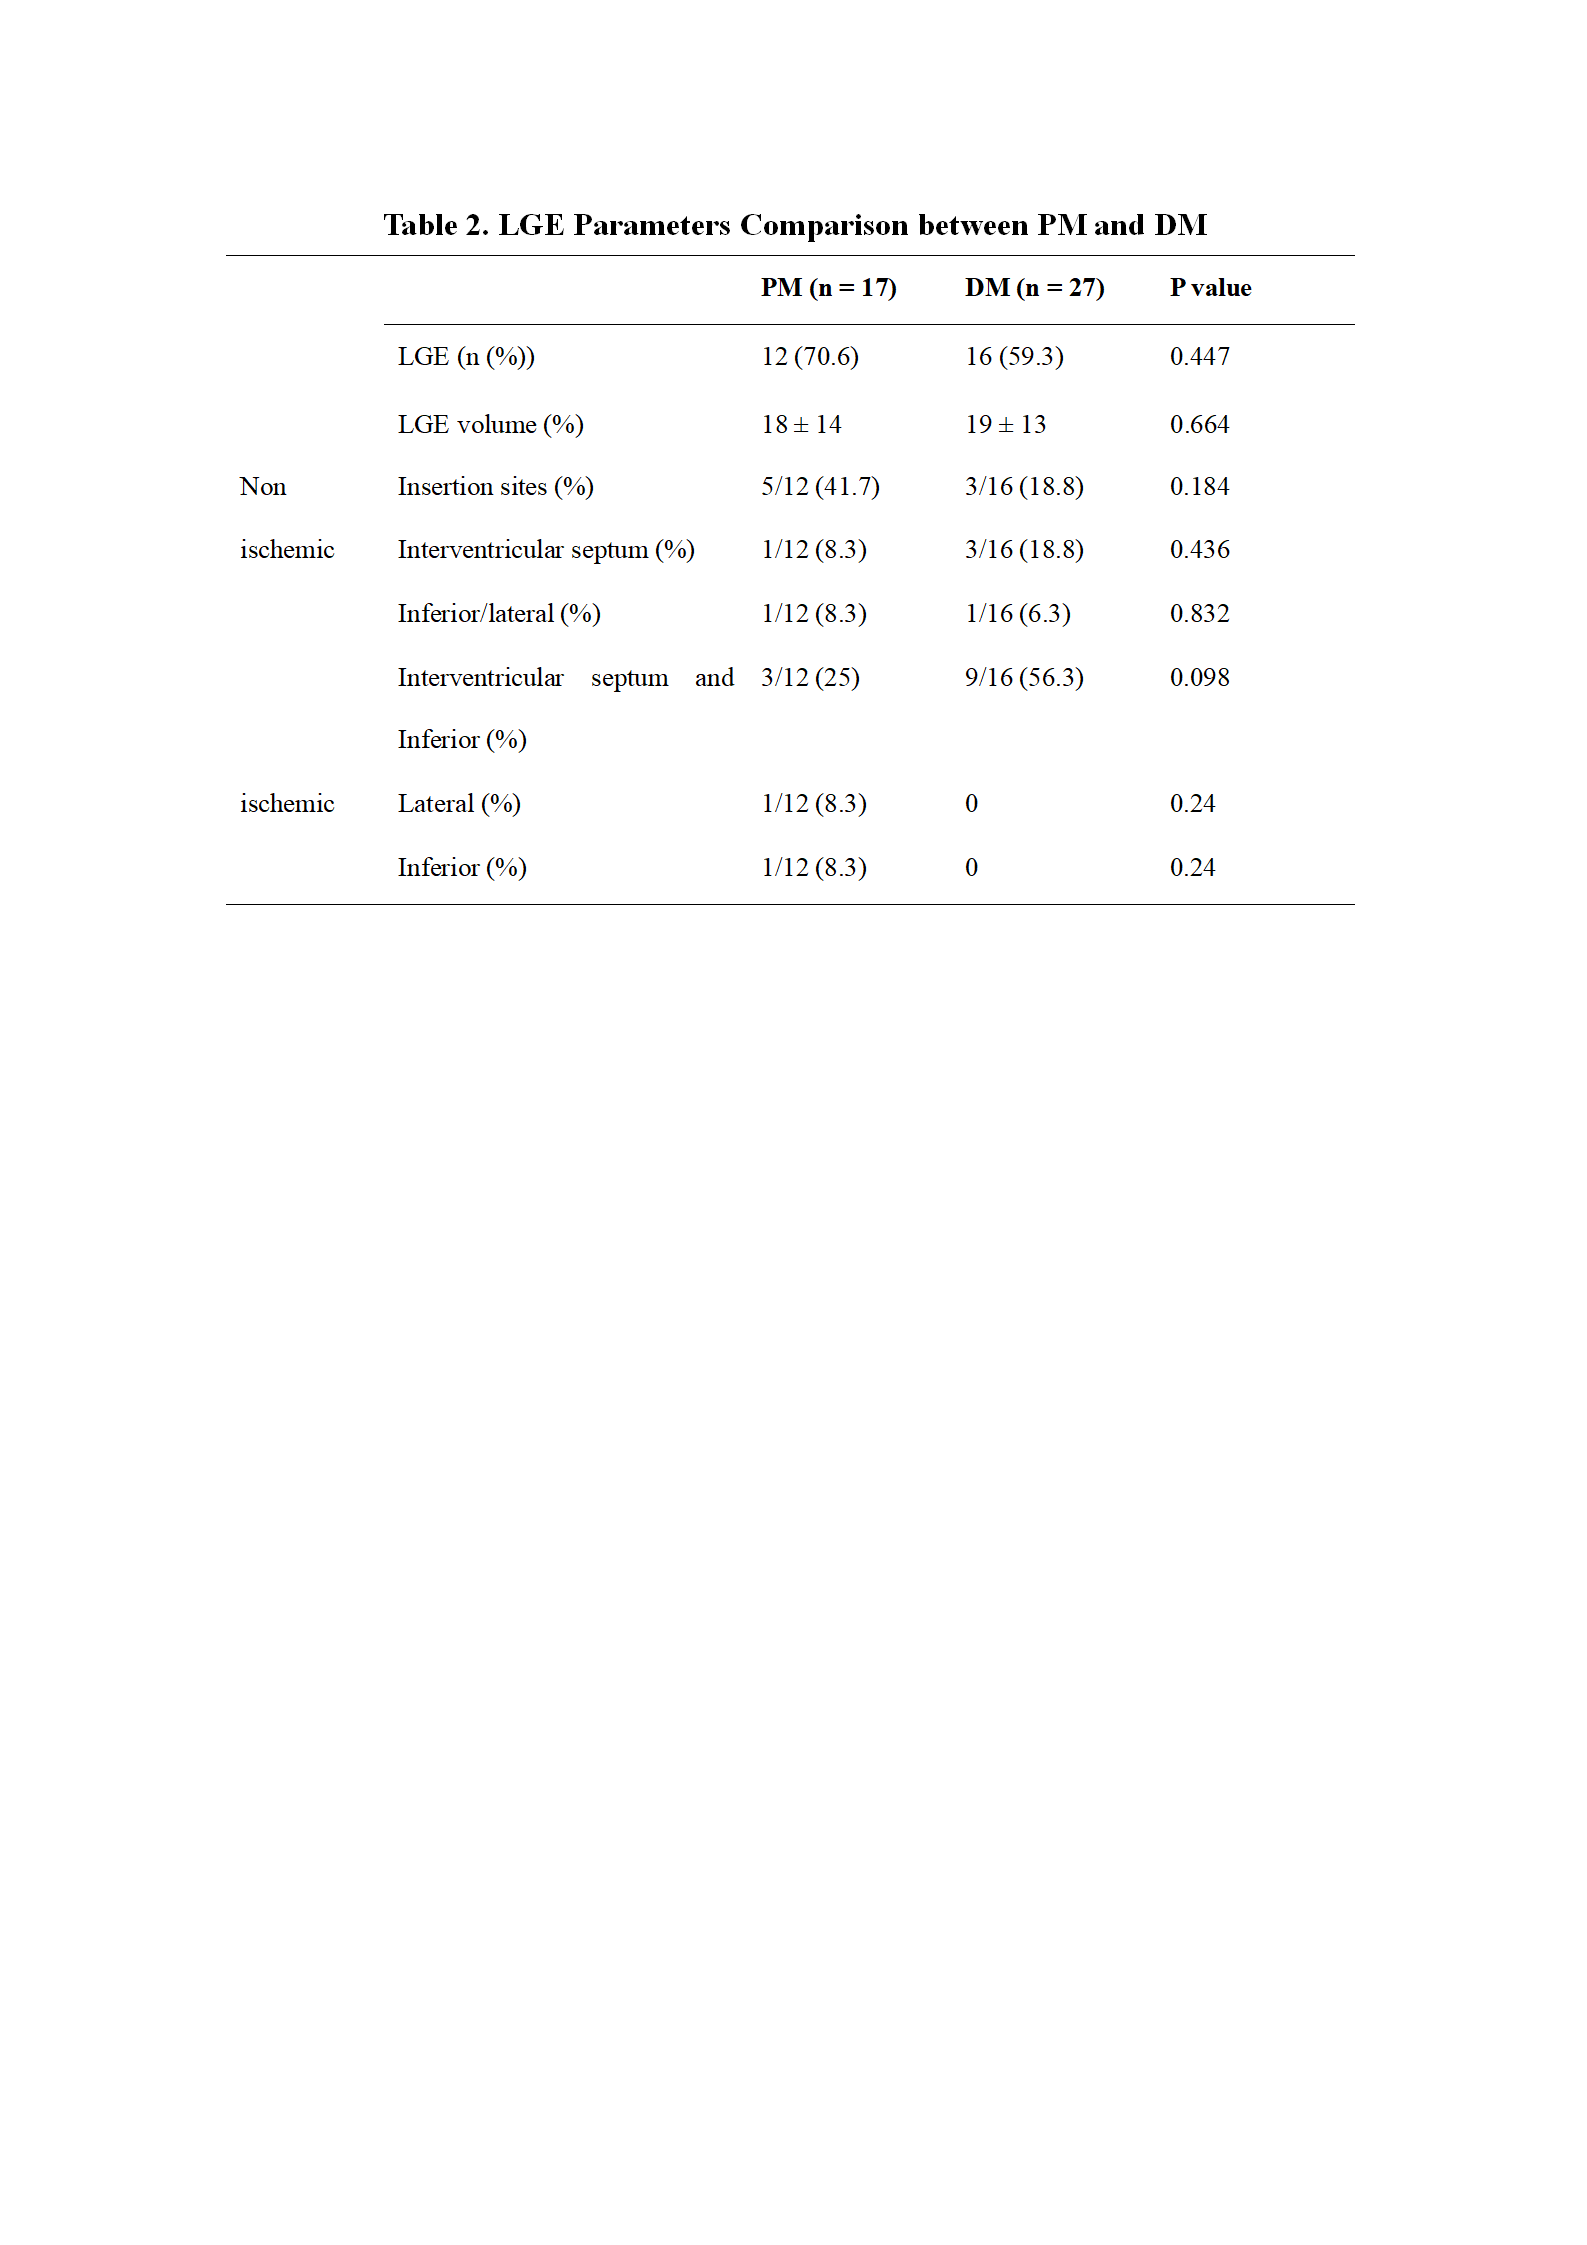
Data are presented as mean ± SD or n (%). PM, polymyositis; DM, dermatomyositis; and LGE, late gadolinium enhancement.