3627
3D wave Cardiac Magnetic Resonance for myocardial scar tissue characterization1IHU Liryc, Electrophysiology and Heart Modeling Institute, fondation Bordeaux Université, Pessac, France, 2Univ. Bordeaux, INSERM, Centre de recherche CardioThoracique de Bordeaux, U1045, Bordeaux, France
Synopsis
3D MRI of the myocardium after an ischemic attack could provide an accurate scar segmentation, much needed by the clinicians. However, this type of acquisition, usually obtained by late gadolinium enhancement (LGE), is very time consuming. We combined a wave acquisition with an inversion pulse and a variable density Poisson undersampling strategy to accelerate 3D cardiac imaging. Retrospectively subsampled images of a sheep heart were successfully reconstructed with an acceleration factor of 4, opening the path to a fast high-resolution 3D LGE acquisition.
Introduction
3D electrical mapping of the heart revealed that myocardial scar is the substrate of anarchic propagation of electrical influx. Re-entrant activity developing in the scar tissue can lead to ventricular fibrillation (sudden cardiac death). Incorporation of CT images, Late Gadolinium Enhancement (LGE) MRI and segmentation of vessels was shown to help optimizing planning of ablation therapy1. However, 3D CMR is time consuming, and a trade-off between acquisition duration and spatial resolution is often necessary in patients suffering for arrhythmia, for who acquisition duration may be increased due to difficulty in gating the sequence on irregular ECG. Parallel imaging techniques take advantage of the use of array receivers2 to reduce acquisition time by k-space subsampling. Among the techniques, Wave-CAIPI–type sequences3 offer further aliasing control and higher acceleration factors. In this study, we present a wave gradient-echo sequence, containing an inversion pulse, implemented for in vivo 3D rapid scar imaging on the heart.Methods
- Pulse Sequence: We implemented at 1.5T (MAGNETOM Aera, Siemens Healthineers) a wave-encoded 3D-GRE sequence, with a non-selective inversion pulse for T1-weighting and respiratory navigator. 7 sinusoidal gradients (6mT/m intensity) are played during the readout in both phase encoding directions. In order to calibrate the PSF, experimental trajectories are measured using 1D calibrations scans prior to wave 3D-GRE acquisition4 (see chronogram in Fig.1).
- Animal model: A partial coronary occlusion (implantation of a millimetric obstructive coil) of the first diagonal branch of left anterior descending artery was induced in an anesthetised sheep (protocol approved by ethical committee) under radiographic and ECG control. The animal was imaged in the chronic phase 6 weeks post-myocardial infarction.
- In vivo experiment: Fully sampled wave 3D-GRE acquisitions were performed in the thorax of an anesthetized sheep. The acquisitions were ECG gated in cardiac diastole and a crossed pair navigator echo was used to track and compensate respiratory motion (4 mm acceptance window). Acquisition parameters: FoV =313*313*120mm2, 208*208*48 matrix (1.5*1.5*2.5mm3 spatial resolution), TE/TR/FA = 2.86ms/27ms/10°, 350ms inversion time; acquisition of 40 segments per heartbeat.
- Inline Image Reconstruction: Raw data were streamed to the Gadgetron reconstruction framework5, where calibrations and image reconstruction were performed in a in-house written MATLAB gadget.
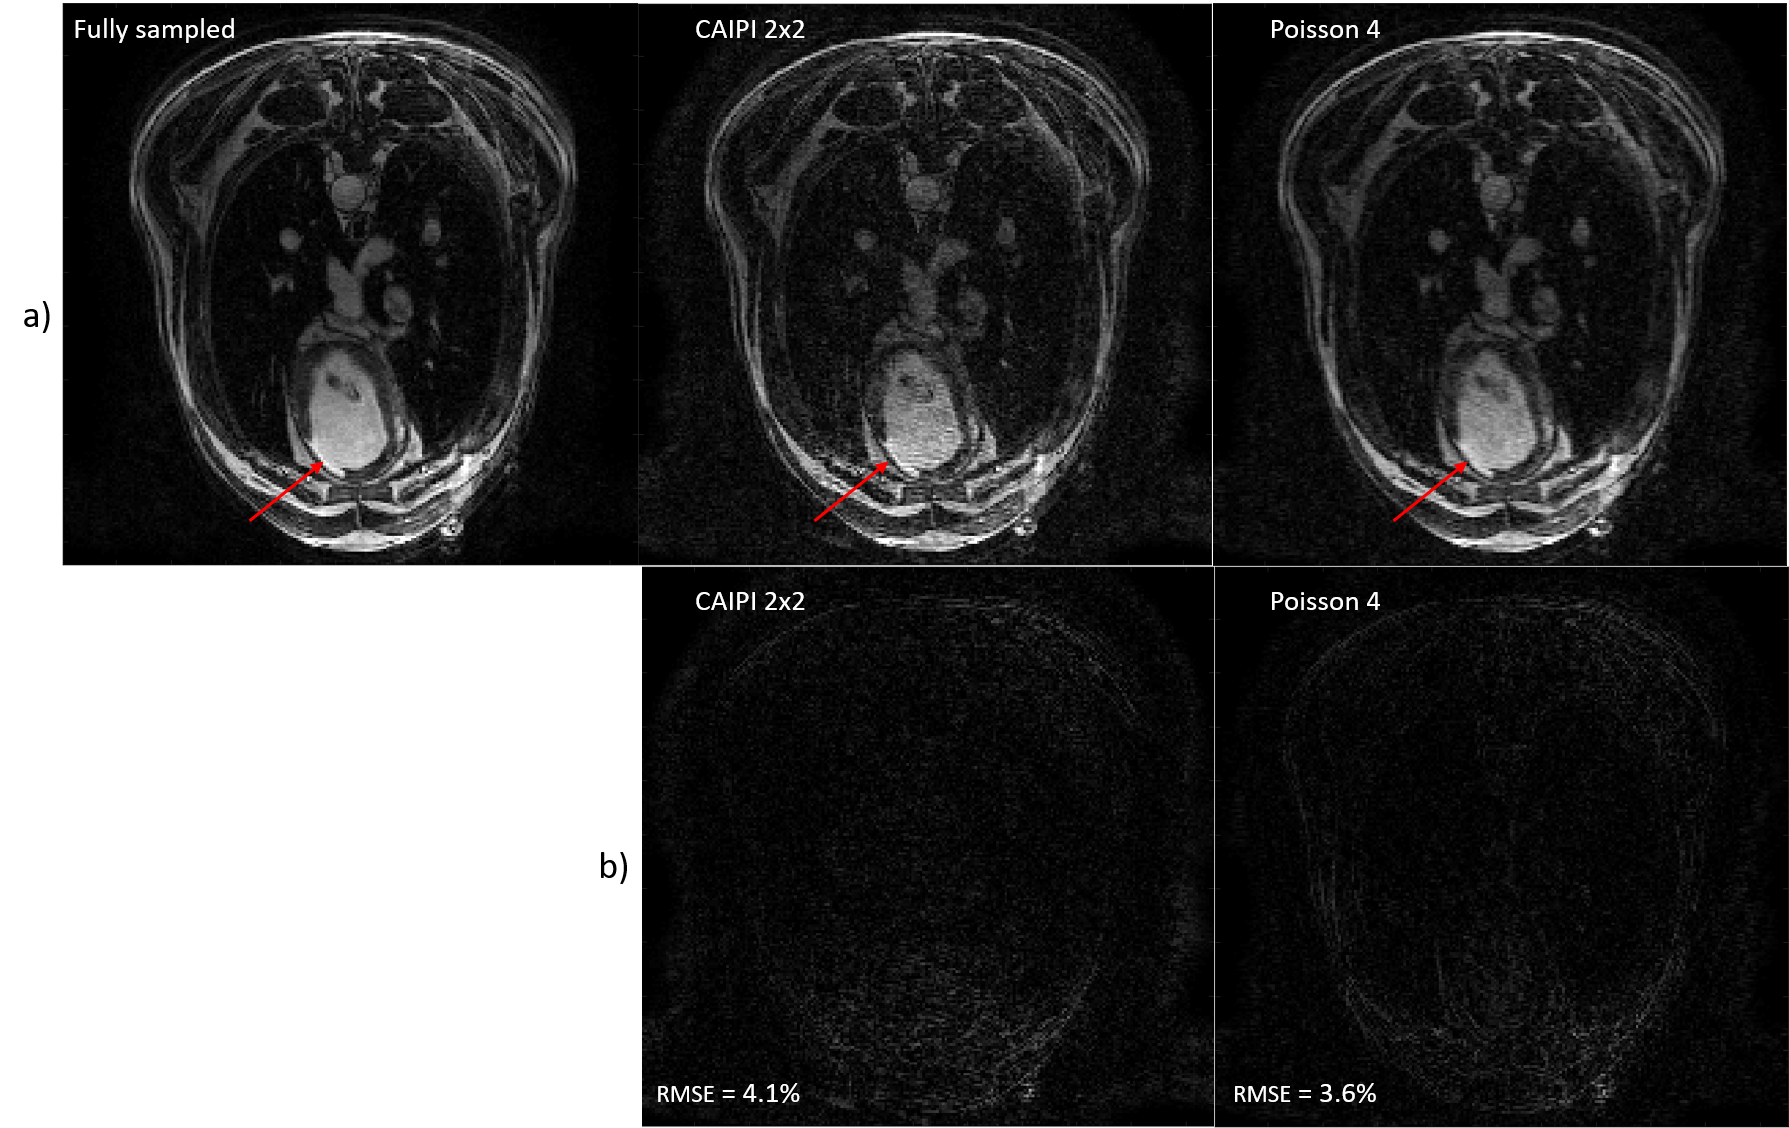
- Offline Image Reconstruction: The fully sampled in-vivo acquisition was reconstructed to create a reference 3D volume. The effect of the wave gradient was de-convoluted from the fully sampled data using the PSF formalism developed by Bilgic and al3. The corresponding images served as a gold standard. The raw data were then retrospectively subsampled and reconstructed to simulate accelerated acquisitions (acceleration factor of 4) using a MATLAB script and the BART toolbox6. For this, a 2x2 CAIPI mask and a x4 Poisson undersampling mask were applied in ky-kz dimensions. Coil sensitivity maps were estimated using ESPIRIT2 on low-resolution wave images de-convoluted by low resolution PSFs7.
Results
The fully sampled dataset was acquired in 12 minutes. The fully sampled image was reconstructed and sent back to the MRI computer. This inline reconstruction pipeline offers flexibility to tune the parameters during the experiment, especially the number of wave gradients and their amplitude, depending on resulting image quality. Figure 2 shows the difference between images obtained with the subsampled k-spaces with acceleration factor of 4. Residual ghosting is still visible on the image, as we move away from the scanner isocenter, but they do not alter the signal in the heart. The image subsampled with the CAIPI mask shows a RMSE of 4.1%, higher than the one accelerated by the VDP disk. However, the infarct is clearly visible in both images. Figure 3 displays orthogonal views of the 3D data sets for qualitative comparison of image quality.Discussion
Acceleration of acquisitions was performed offline to compare image quality with different subsampling strategies. Both accelerated images show acceptable RMSE compared to the fully sampled data, yet the Poisson undersampling yields better SNR due to the reduced coherence of the aliasing artefacts. The scar tissue observed were consistent between both the fully sampled and undersampled images.Incorporating Compressed Sensing in the SENSE reconstruction of the BART toolbox may further improve image quality.Conclusion
The presented results indicate the feasibility of rapid 3D LGE scar imaging using a navigated T1-weighted Wave-CAIPI type sequence. The image quality after retrospective k-space subsampling by a factor 4 was similar to the fully sampled image (albeit with lower SNR) using either CAIPI or Poisson undersampling masks, showing potential for clinical usage.Acknowledgements
This work received financial support from the French National Investments for the Future Programs: ANR-10-IAHU-04 (IHU Liryc)References
1. Cochet H, Dubois R, Sacher F, Derval N, Sermesant M, Hocini M, Montaudon M, Haïssaguerre M, Laurent F, Jaïs P. Cardiac arrythmias: multimodal assessment integrating body surface ECG mapping into cardiac imaging. Radiology. 2014;271:239–247
2. Uecker M, Lai P, Murphy MJ, et al. ESPIRiT-an eigenvalue approach to autocalibrating parallel MRI: Where SENSE meets GRAPPA. Magnetic Resonance in Medicine. 2014;71(3):990-1001.
3. Bilgic B, Gagoski BA, Cauley SF, et al. Wave-CAIPI for highly accelerated 3D imaging. Magnetic Resonance in Medicine. 2015;73(6):2152-2162.
4. Zhang Y, Hetherington HP, Stokely EM, Mason GF, Twieg DB. A novelk-space trajectory measurement technique. Magnetic Resonance in Medicine. 1998;39(6):999-1004.
5. Hansen MS, Sørensen TS. Gadgetron: An open source framework for medical image reconstruction: Gadgetron. Magn Reson Med. 2013;69(6):1768-1776.
6. Uecker M, Ong F, Tamir J, Bahri D, Virtue P, Cheng J, Zhang T, and Lustig M. Berkeley Advanced Reconstruction Toolbox. Annual Meeting ISMRM, Toronto 2015, In Proc. Intl. Soc. Mag. Reson. Med. 23:2486
7. Chen F, Zhang T, Cheng JY, Shi X, Pauly JM, Vasanawala SS. Autocalibrating motion-corrected wave-encoding for highly accelerated free-breathing abdominal MRI: Wave-Encoding for Free-Breathing Abdominal MRI. Magn Reson Med. 2017;78(5):1757-1766.
Figures
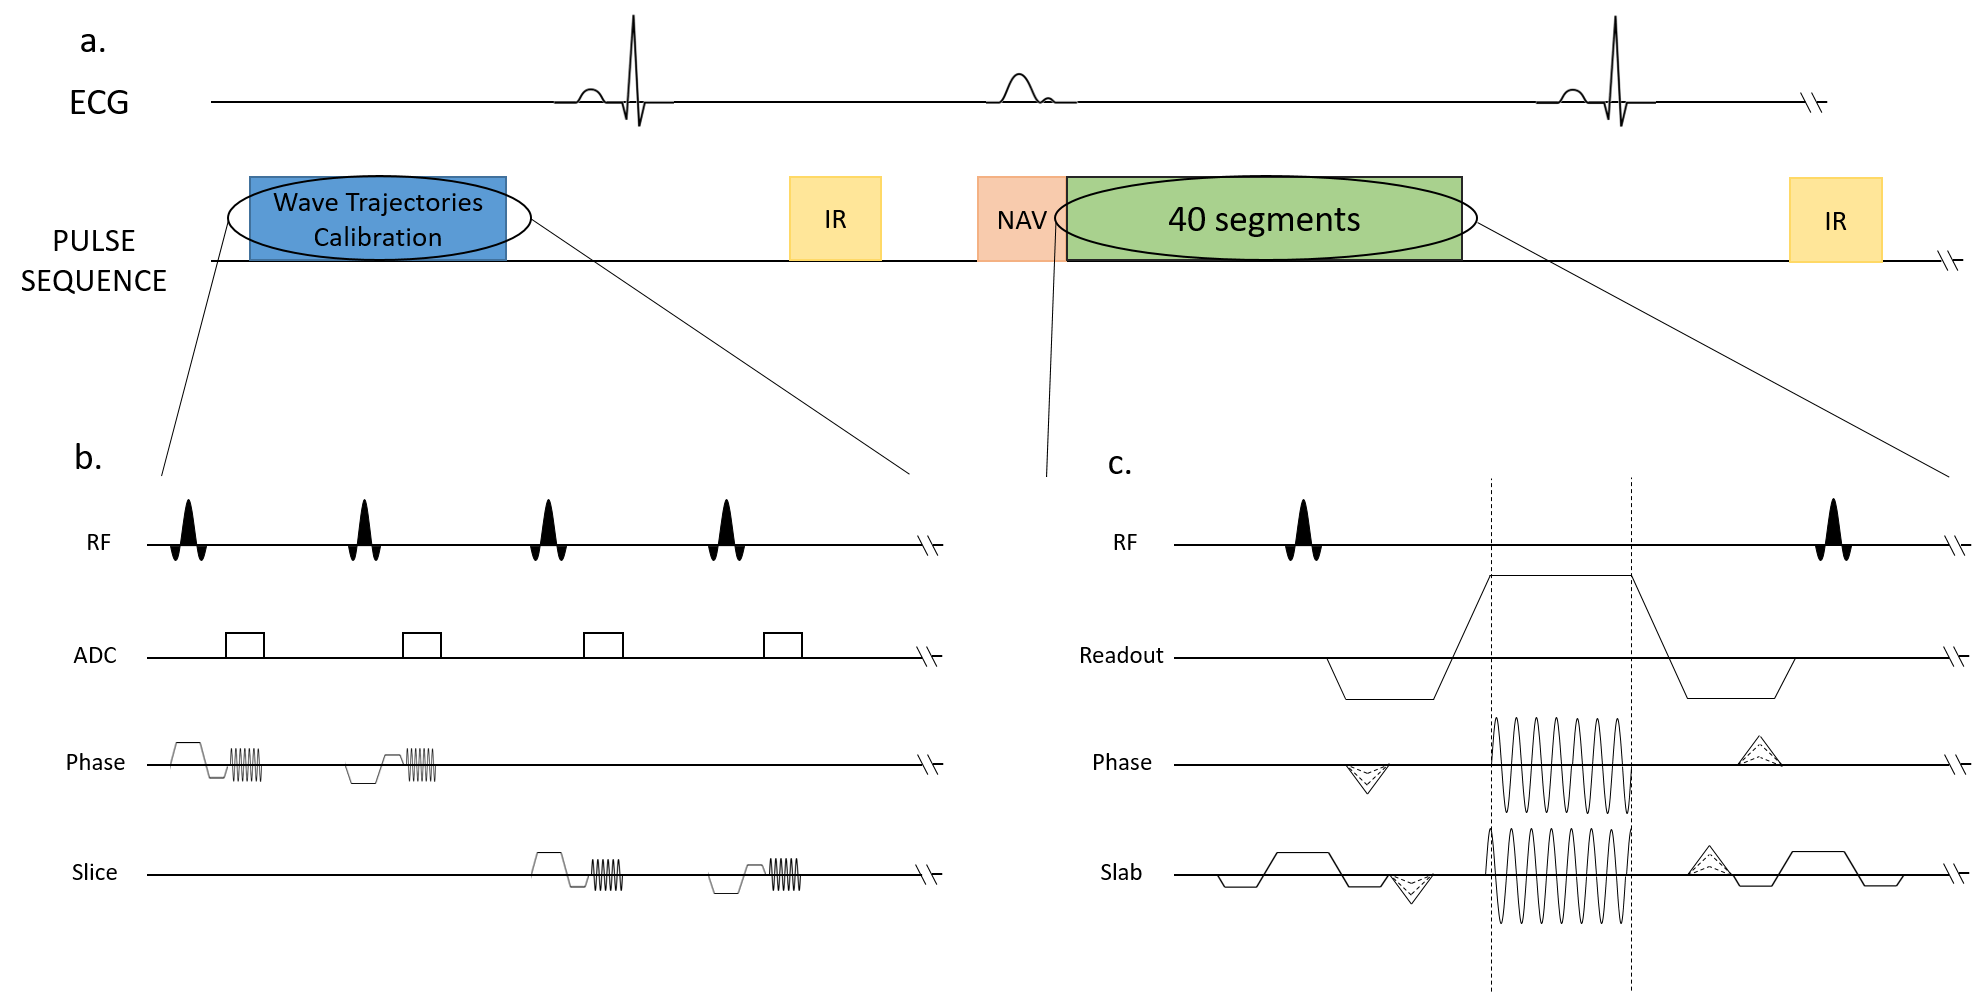
Sequence diagrams. Zoom in on the Trajectory Calibration Sequence (b.) and on the Wave sequence (c.).
a.) The sequence is triggered in diastole and respiratory gating was performed using an echo navigator played before data acquisition.
b.) The trajectories calibration module takes place during the first 25 seconds (4 averages are performed).
c.) The wave encoding gradients are applied during the readout, in both phase and slice directions. The slice encoding wave gradient starts ¼ of a cycle before the phase wave gradient.
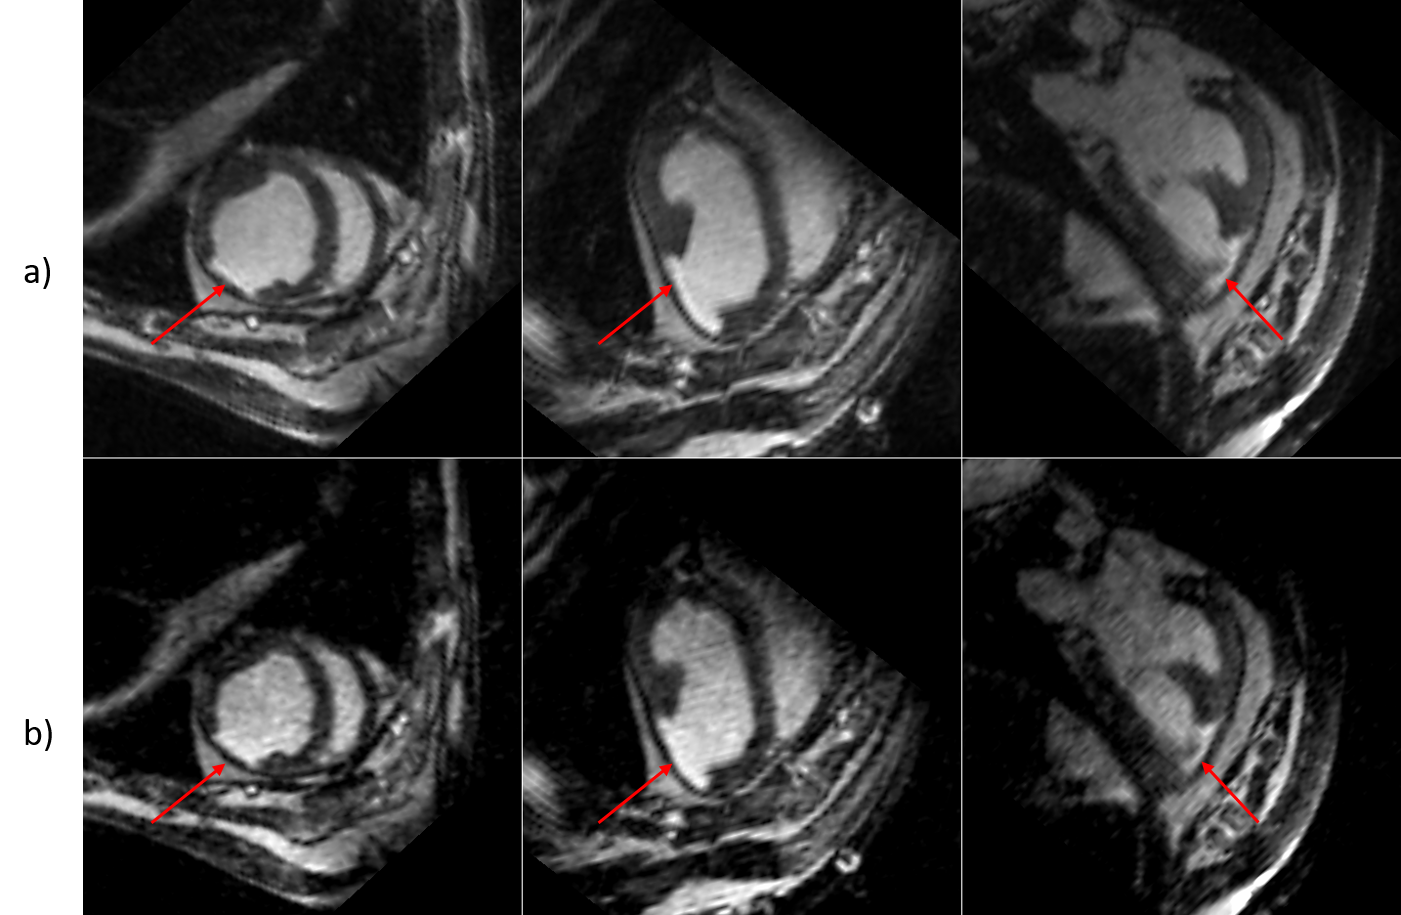
Reorientation of the data in orthonormal planes. The red arrow indicates the infarct.
a.) Fully sampled data.
b.) VDP undersampling by 4.