3624
Metabolic changes in coronary artery disease assessed using 1H NMR Metabolomics1Nuclear Magnetic Resonance and MRI Facility, All India Institute of Medical Sciences, New Delhi, India, 2Cardiology, All India Institute of Medical Sciences, New Delhi, India
Synopsis
Coronary artery disease (CAD) is caused by building up of plaque in the arteries of the heart, which narrows the lumen of arteries. Present study investigated the metabolic profile of blood plasma using 1H-NMR spectroscopy for distinguishing coronary artery disease (CAD) patients from healthy control (N). The results showed significant differences in the concentration of several metabolites like lactate, pyruvate, choline, acetate and alanine in the blood plasma of CAD patients in comparison to healthy controls suggesting alterations of several metabolic pathways including glycolysis, gluconeogenesis which may be related to the development of CAD.
Introduction
Coronary artery disease (CAD) is the most common type of heart diseases caused by building up of plaque along the inner walls of the arteries of the heart, which narrows the lumen of arteries and reduces blood flow to the heart. Metabolomics has emerged as a promising technique enabling in-depth understanding of underlying biochemical abnormalities associated with disease processes and identifying biomarkers of clinical relevance. Limited number of studies documented role of 1H NMR spectroscopy in conjunction with multivariate analysis for the diagnosis and for determining the severity of coronary heart disease.1-3 In the present study we are using one dimensional 1HNMR technique to investigate the metabolomic profile of blood plasma which can be helpful to identify any change in the biochemical composition of the blood plasma particularly in the context of some metabolite concentration which can be correlated with the presence CAD. NMR based metabolomics analysis framework with pattern recognition approach may play an important role to measure metabolic changes reflected in bio-fluids.Objective
To investigate the potential of 1H NMR metabolomics of blood plasma for distinguishing coronary artery disease (CAD) patients from healthy controls.Patients and Methods
Venous blood samples were collected from 13 controls and 15 CAD patients. Plasma were separated from blood samples after centrifuged at 2000 rpm for 15 minutes at 40C and stored at- 80o C until NMR experiments were performed. For NMR experiments 200 µl blood plasma , 30 µl sodium formate (0.5mM) and 370 µl D2O was used to making 600 µl overall volume, all 1D NMR experiments were carried out on a 700 MHz (Agilent) spectrometer using 1H NMR. The chemical shifts of resonances were referenced to sodium formate which was set at 8.46 ppm. 1D spectrum with water suppression was acquired with a single 90° pulse using a spectral width of 9124.1 Hz and 32 K data points. The parameter for spin echo (CPMG) were; no. of scans 64, relaxation delay 70 s with presaturation of water during relaxation delay. FID’s were multiplied by an exponentially decaying function prior to FT with a line broadening of 0.3 Hz. The data was processed on Linux work station using Agilent software Vnmrj 2.3A. Two dimensional (2D) TOCSY experiment was carried out for assignments of metabolite peaks. The blood plasma metabolites concentrations were compared across healthy control and CAD patients using unpaired t-test. A p-value <0.05 was considered significant. analysis using metabolite concentration multivariate analysis (supervised and unsupervised ) method was used included PCA, PLS-DA using MetaboAnalyst 4.0 a web-based metabolomic data processing tool.Results
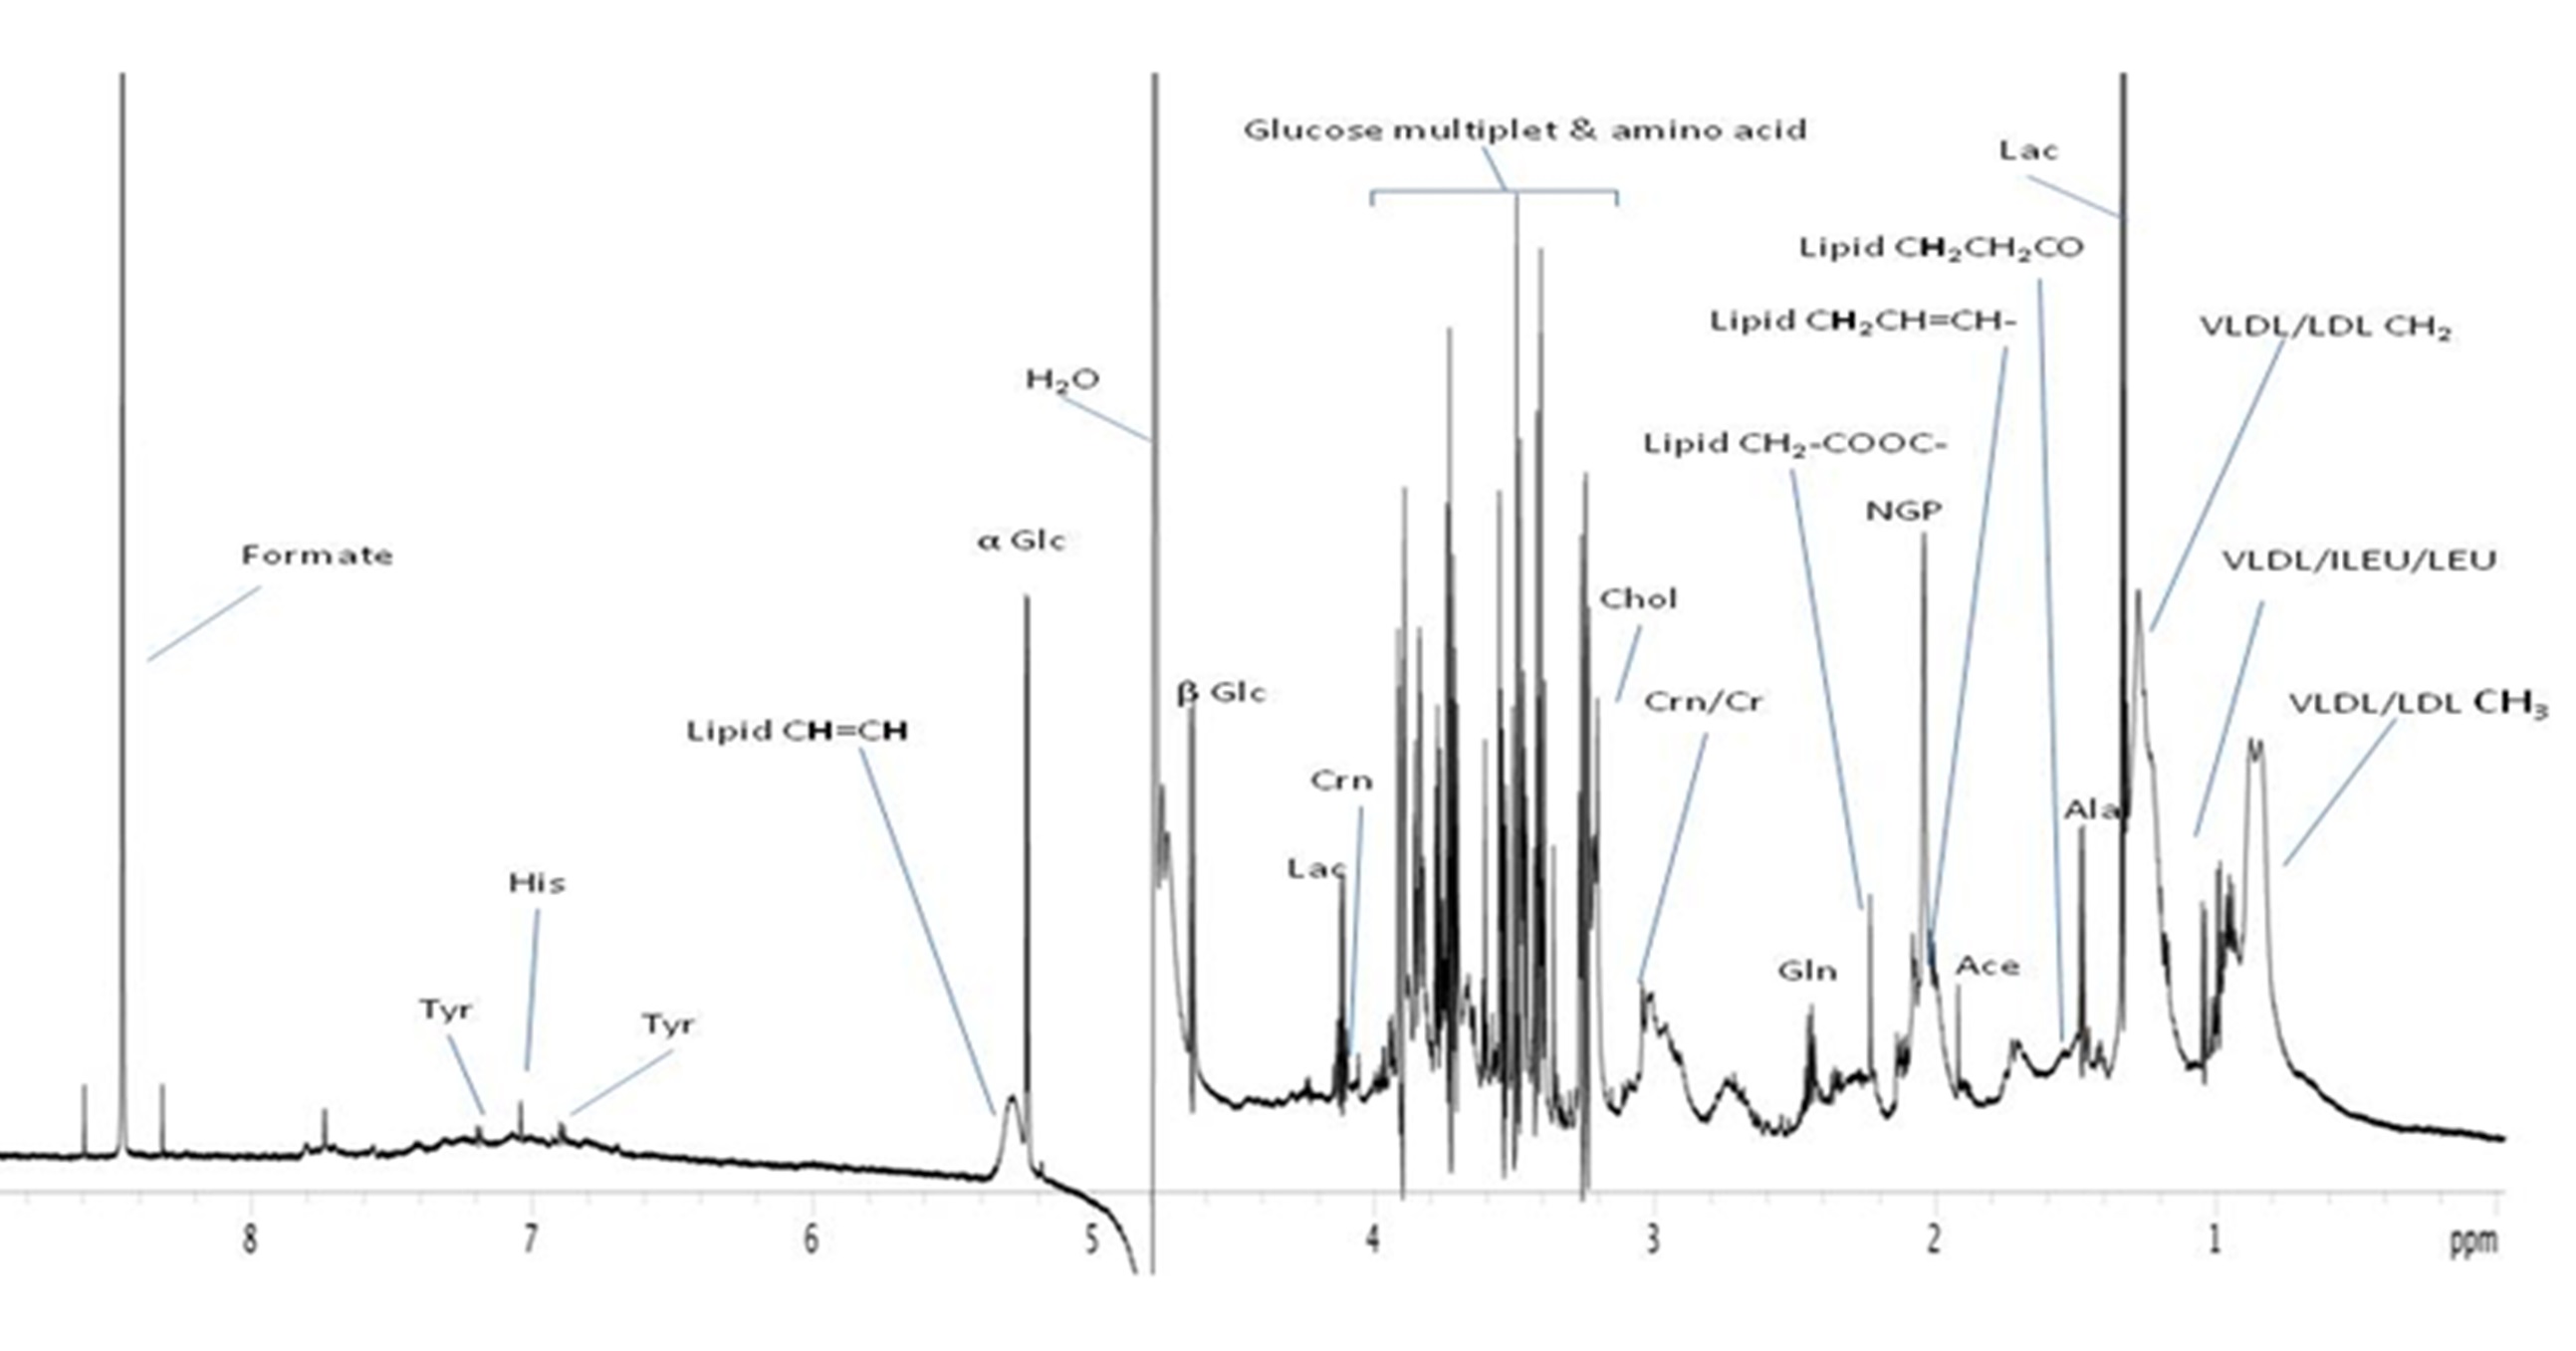
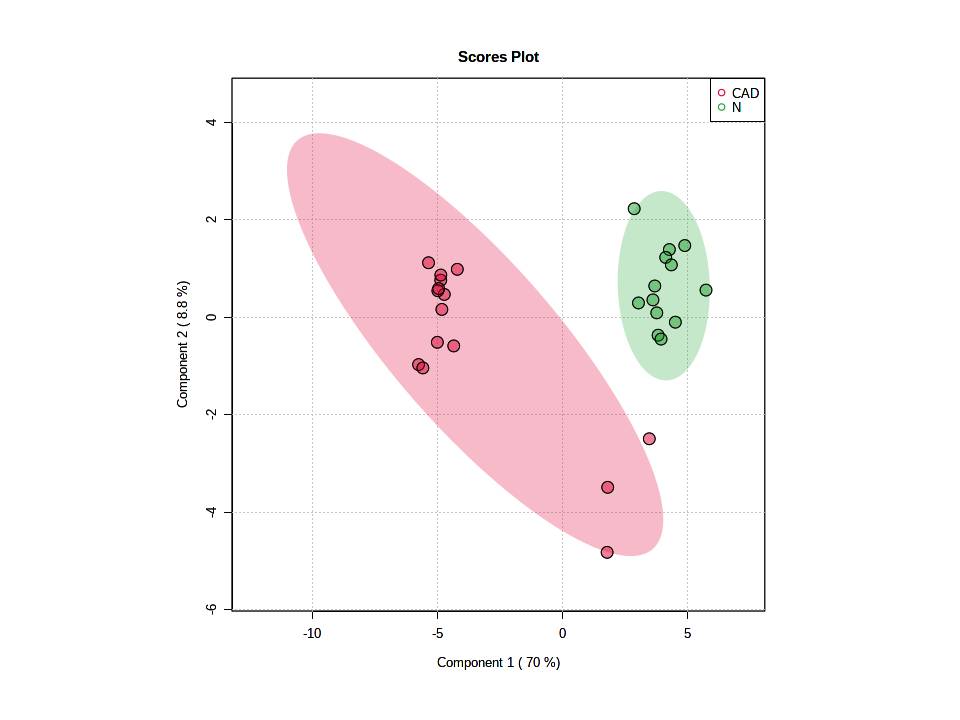
Figure 1 shows the 1H NMR spectrum obtained from blood plasma and assignments of resonances observed from metabolites. A total of 32 metabolites were assigned including amino acids like alanine, leucine, isolucine, valine, lactate and macromolecules like lipids, unsaturated fatty acids, LDL/VLDL/HDL and other lipid compounds. Using formate as reference (8.46ppm) integration was done more than 25 peak in NMR spectra of blood plasma and Metabolite concentration was determined using the integrated intensity of each metabolite. Statistically significant differences were observed in various metabolites like branch chain amino acids, alanine, lactate, choline across the groups of patients and controls. Partial least square discriminant analysis on the metabolites concentration data depicted separate cluster for the two categories of samples, normal (green) and CAD patients(red) (Figure 2).Discussion
The present study revealed significant differences in the concentration of several metabolites such as lactate, pyruvate, choline, acetate and alanine concentration in blood plasma of patients with coronary artery disease compared to healthy controls. These alterations in metabolite levels may be associated with the alteration of inter-connected metabolic pathways related to lipid, fatty acid and carbohydrate metabolism. Increased levels of metabolites like low density lipoprotein/very low density lipoprotein LDL/VLDL have been found to be closely associated with CAD risk factor. This is in agreement with the findings wherein metabolites like alanine and LDL/VLDL were suggested as possible biomarkers for differentiating between controls and patients with CAD3.Conclusion
We observed significant difference in the some metabolites concentration may be used as a measure to discriminate between CAD patients with healthy person. Also the metabolic profiling may offer the opportunity to understand the biochemical mechanism of coronary artery disease and help to identify potential biomarker/s and severity in CAD.Acknowledgements
Department of Science and Technology, Govt. of India is acknowledged for providing funds for 700 MHz NMR spectrometer (IR/SO/LU-05/2007/AIIMS).References
1. Brindle JT, Antti H, Holmes E, Tranter G, Nicholson JK, Bethell HW, Clarke S, Schofield PM, McKilligin E, Mosedale DE, Grainger DJ. Rapid and noninvasive diagnosis of the presence and severity of coronary heart disease using 1H-NMR-based metabonomics. Nat Med. 2002;8(12):1439-44.
2. Kirschenlohr HL, Griffin JL, Clarke SC, Rhydwen R, Grace AA, Schofield PM, Brindle KM, Metcalfe JC. Proton NMR analysis of plasma is a weak predictor of coronary artery disease. Nat Med. 2006;12(6):705-10.
3. Malik A, Sharma U, Lakshmy R, Narang R, Jagannathan NR. Biochemical characterization of blood plasma of coronary artery disease patients by in vitro high-resolution proton NMR spectroscopy. J Biosci. 2015;40(1):31-9.
Figures