3623
Microstructural CMR imaging in a longitudinal pig model of acute to chronic myocardial infarction1Institute for Biomedical Engineering, University and ETH Zurich, Zurich, Switzerland, 2Institute of Diagnostic and Interventional Radiology, University Hospital Zurich, Zurich, Switzerland, 3Division of Surgical Research, University Hospital Zurich, Zurich, Switzerland, 4Institute of Translational Cardiovascular Technologies, ETH Zurich, Zurich, Switzerland
Synopsis
In this work we compare non-contrast enhanced imaging methods such as native T1, T2 mapping and cardiac diffusion tensor imaging, to ECV measurements in a longitudinal porcine study of myocardial infarction. T2 is elevated only during the acute stage. During the transition from acute to chronic stage T1 remains unchanged and ECV as well as MD progressively increase while FA decreases. During the acute stage, T2 mapping provides highest contrast whereas diffusional metrics showed larger changes during the chronic stage compared to native relaxometry showing the potential of DTI for probing dynamic myocardial changes upon an ischemic event.
Introduction
The myocardial response to an ischemic event is highly dynamic (1). Initially, reperfusion-related edema leads to swelling of injured myocardium, followed by a deferred second wave of edema acociated with removal of cardiomyocyte debris, collagen homeostasis and healing (2). The degradation of cell membranes and vasculature in the ischemic region results in an elevated extracellular volume fraction (ECV) (3) up to the point of scar formation. Cardiovascular magnetic resonance imaging offers a broad spectrum of non-contrast enhanced techniques such as T1 and T2 imaging, and more recently, methods for diffusion parameter estimation to assess the ischemic region. While the underlying pathophysiology is the same, the contrast mechanisms behind the different imaging methods differ. Here we compare the contrast generated by non-contrast enhanced imaging methods relative to ECV measurements in a longitudinal porcine study of myocardial infarction (MI).Methods
Study designNine female pigs (Edelschwein, 30-35kg) were grouped into infarction (N=5) and control (N=4) cohorts. All animals underwent imaging at baseline (2 weeks before MI), acute stage (day 6) and twice during follow-up (week 5 & week 9). MI was introduced by 90min occlusion of the left-circumflex artery. All animal handling, procedures and protocols were approved by the Cantonal Veterinary Office (Zurich, Switzerland).
Data acquisition
Imaging was performed on a 1.5T clinical Philips Achieva MR system (32-channel cardiac receiver array, 80mT/m@100T/m/s gradient system) in short-axis view. The protocol consisted of:
1) Cine imaging: 1.8×1.8mm2 spatial resolution, 8mm slice thickness, 25 heart phases, 1.5ms/3ms TE/TR
2) T1 mapping using MOLLI (4): 2×2mm2 spatial resolution, 8mm slice thickness, 1.1ms/2.3ms TE/TR, inversion delays 10-13 (pre-contrast) or 12-14 (post-contrast)
3) T2 mapping using multi-echo spin-echoes and multi-shot EPI readout: 2×2mm2 spatial resolution, 10mm slice thickness, nine echoes: ΔTE 8.8ms
4) Diffusion tensor imaging (DTI) using a second-order motion-compensated spin-echo sequence (5,6): 2×2mm2 spatial resolution, 8mm slice thickness, TE/TR: 81ms/5R-R intervals, 3 diffusion encoding directions@b=100s/mm2, 3@b=200s/mm2 and 12@b=450s/mm2, eight signal averages.
5) Late Gadolinium Enhanced imaging (LGE): 3D inversion-recovery gradient-echo sequence (~15min post CA), with 2×2×8mm3 spatial resolution, 1.4ms/2.8ms TE/TR
20min after contrast agent administration (total 0.2mmol/kg) T1 mapping was repeated and blood hematocrit sampled for ECV mapping.
Data analysis
Parameter maps as well as DTI data were reconstructed and registered using in-house developed Matlab (Mathworks, Natick, USA) software (7). Remote and infarct zones were manually segmented on the T2, native T1, ECV, mean diffusivity (MD) and fractional anisotropy (FA) maps using GTVolume (GyroTools, Winterthur, Switzerland). Scalar values were averaged across the region of interest and statistical significance was tested by paired (infarct vs. remote) and unpaired (remote vs. control) two-tailed Student’s t-tests. The relative change in signal was computed as paired difference between remote and infarcted area and normalized by the values of the remote area. To evaluate any potential bias in the remote area, values were compared to healthy control data.
Results
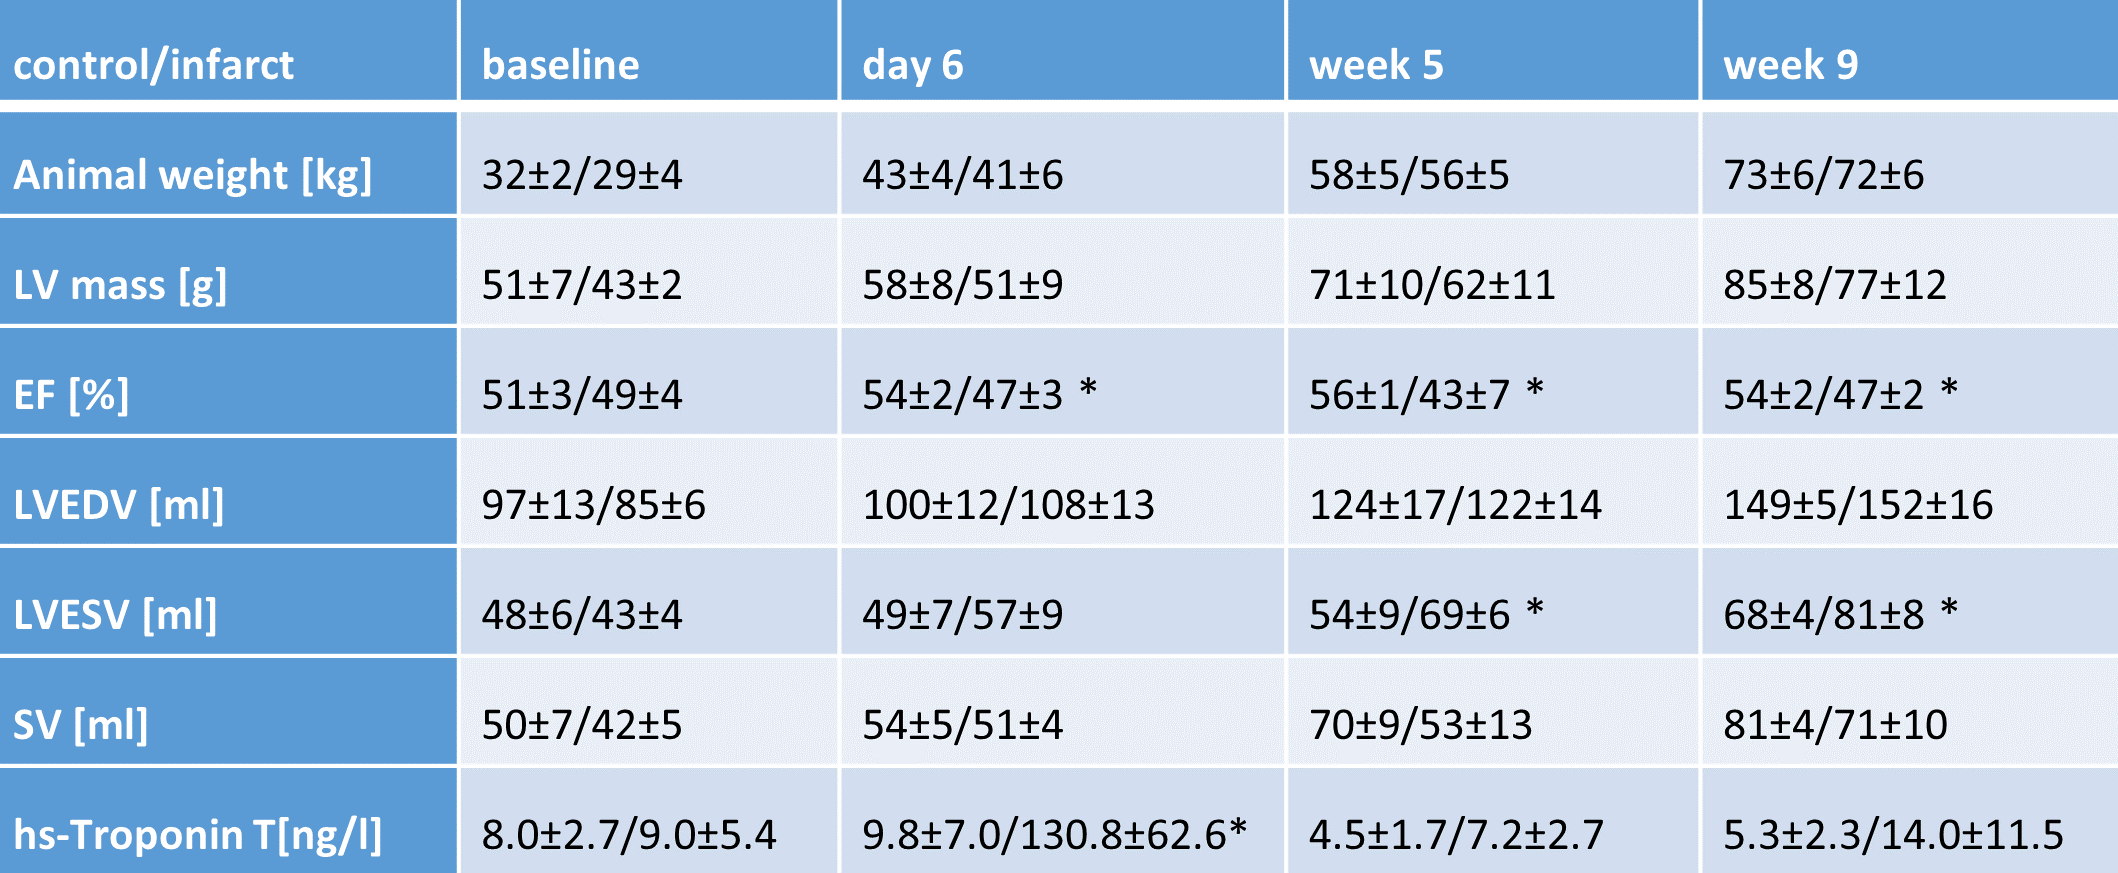
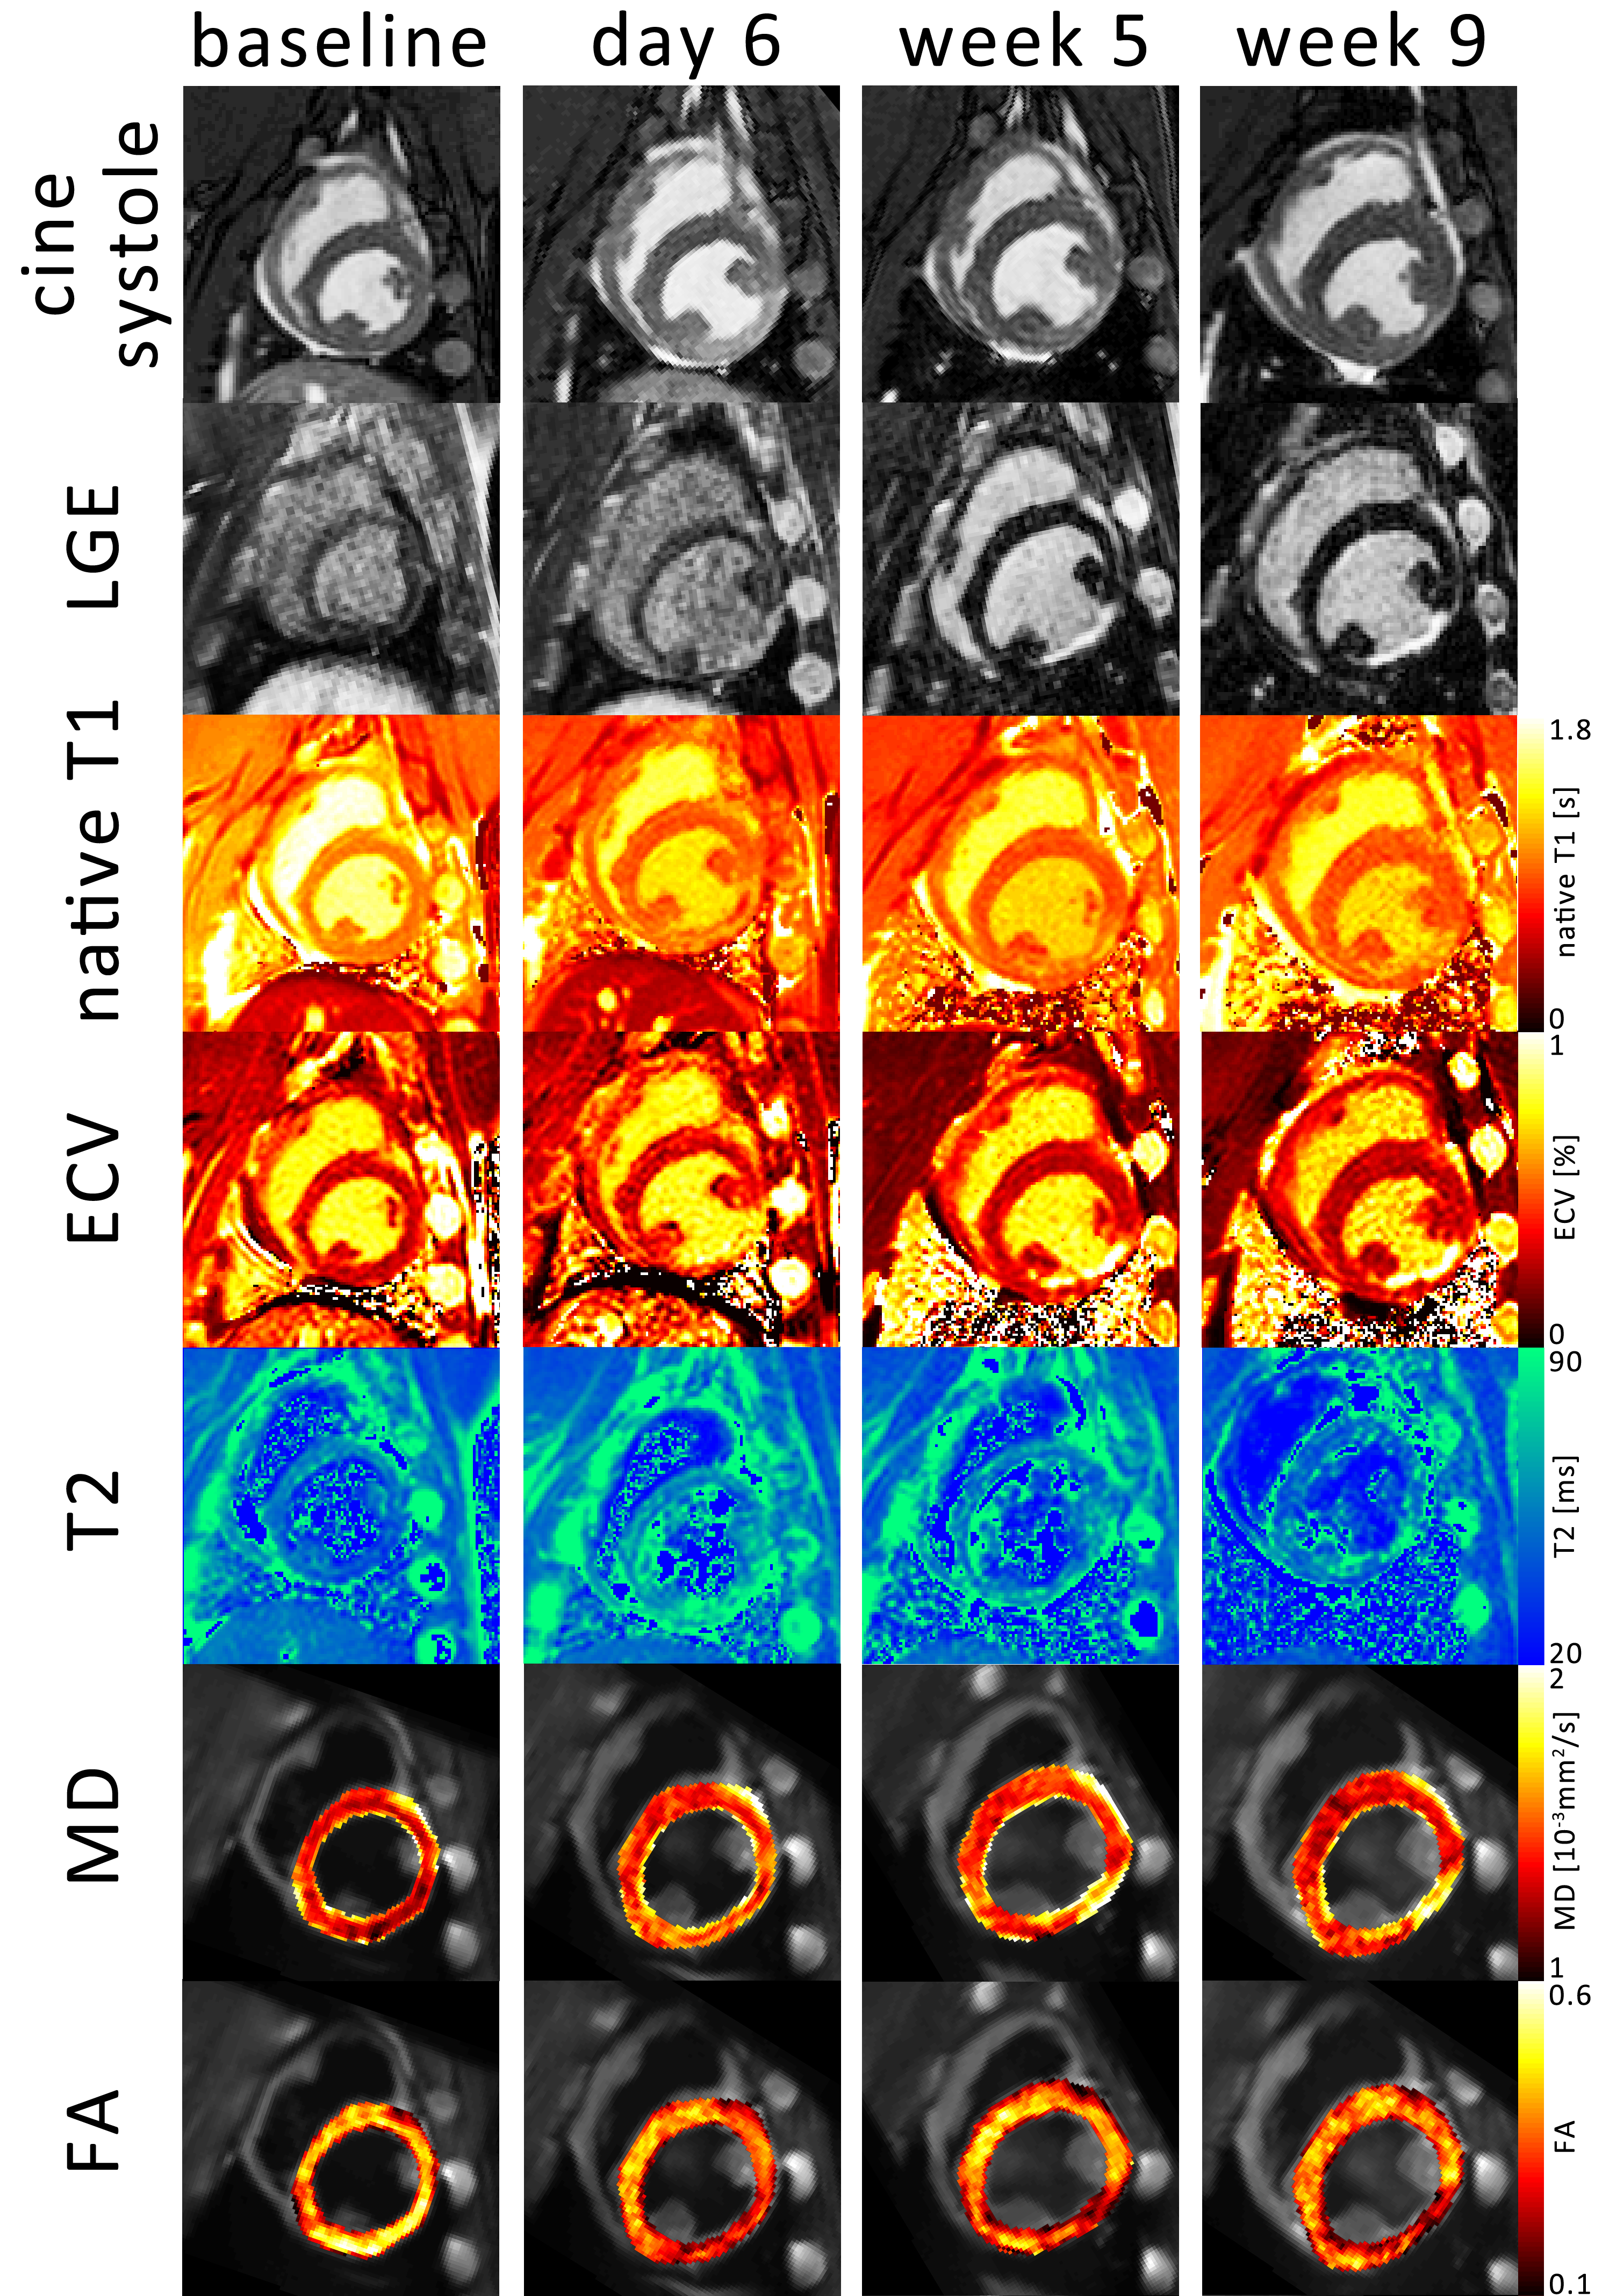
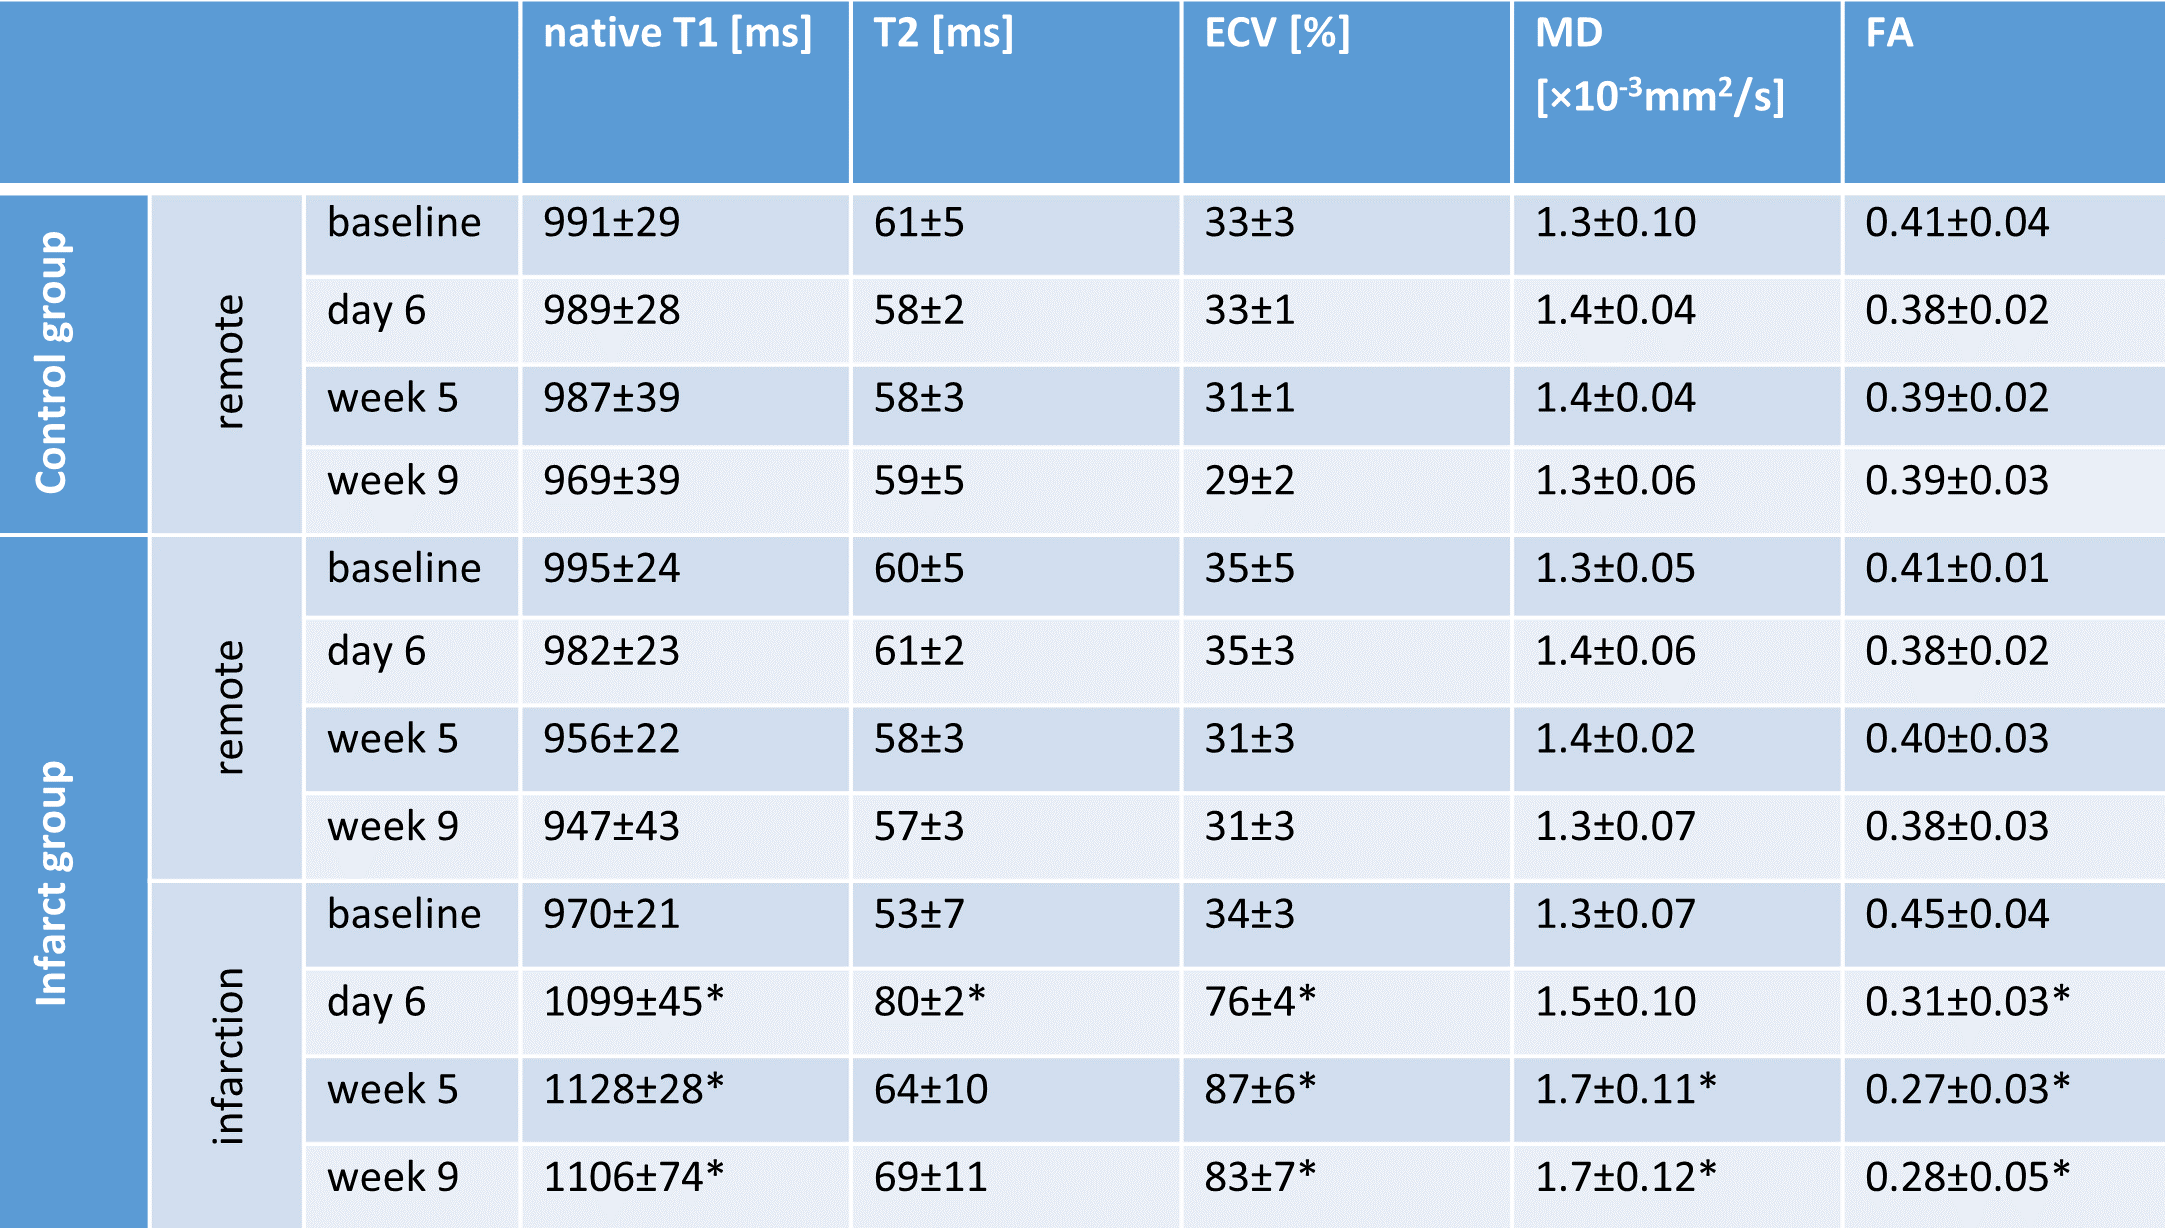
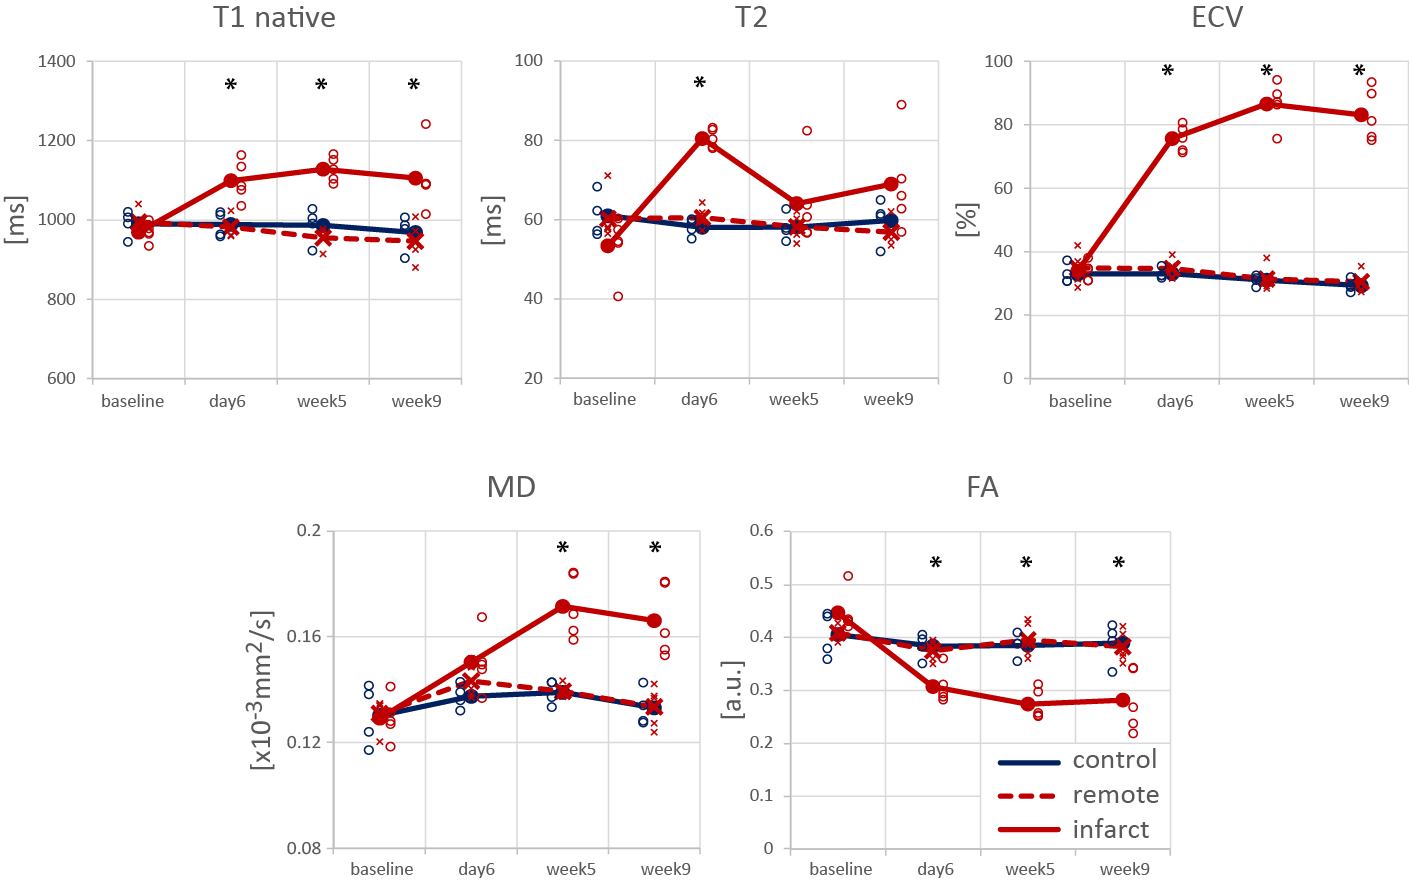
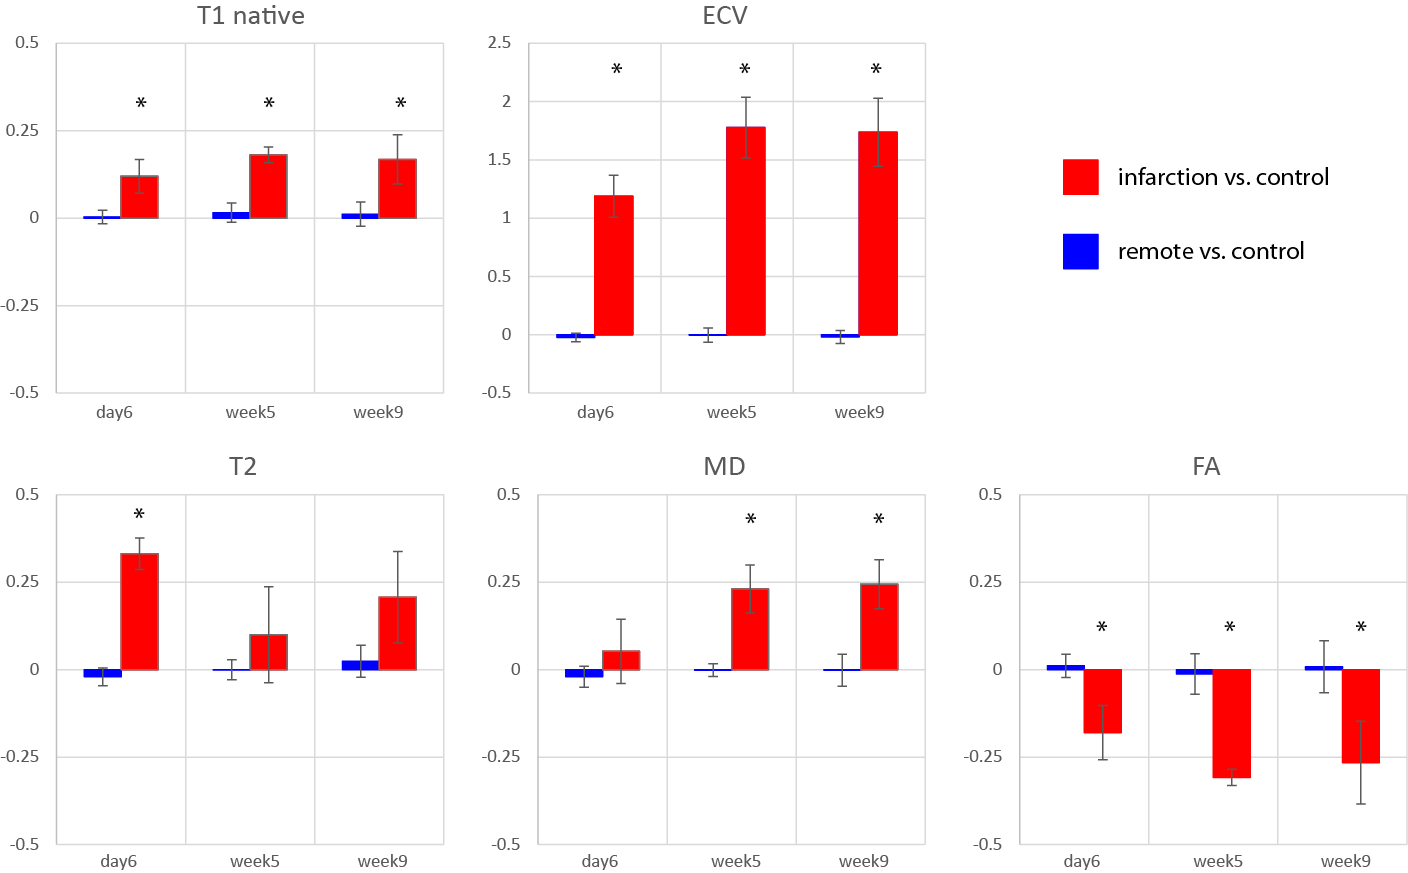
Progression of animal weight, LV mass, EF, LVEDV, LVESV and SV as well as hs-Troponin are listed in Table 1. A significant reduction in EF in the infarct group was associated with progressively increasing LVESV above animal growth. Figure 1 shows cine and LGE images as well as example parameter maps. T2 values are elevated in the ischemic region at day 6 and T1 and ECV maps show apparent enhancement during follow-up. The areas of elevated MD and reduced FA are co-located with the infarcted segment. The corresponding change in values over the time course of the experiment are presented in Figure 2 and in Table 2. No differences were found between the control group and the remote region in the infarct group. Native T1, ECV and MD are significantly elevated in the infarcted region while FA is reduced. ECV as well as MD progressively increase from the acute to the chronic stage by 14% (ECV), 14% (MD), while FA is reduced by 11%. T2 is significantly increased in the ischemic area only during the acute stage. Figure 3 compares the sensitivity of non-Gadolinium-enhanced readouts between infarcted and remote areas. During the acute stage, T2 mapping provides highest contrast whereas diffusional metrics showed larger changes during the chronic stage compared to native relaxometry. ECV outperforms all non-contrast methods at all time points.Discussion
In this study, we found similar signal changes in ECV and native T1 (8), T2 (2), MD and FA (9,10) compared to previous work. Despite identical underlying changes in tissue properties, imaging physics differ between relaxometry and diffusion imaging. While native T1 and T2 mapping probe changes in spin-lattice and spin-spin interaction, MD reflects changes in viscosity of the imaged liquid and the apparent mean free pathway depending on the spacing of restrictions. FA is predominantly probing changes in relative directional mean free pathways of diffusing molecules and hence the overall tissue architecture. Our results suggest a higher sensitivity to changes in myocardial microstructure by diffusion imaging. If contrast agents are used, however, ECV presents the most prominent changes in signal favoring it over non-contrast enhanced diffusion imaging and relaxometry.Conclusion
Diffusion tensor imaging shows potential as non-contrast enhanced imaging method for probing dynamic myocardial changes upon an ischemic event.Acknowledgements
This research was funded by the Swiss National Science Foundation, grants SNF PZ00P2 174144 320030_153014 and CR23I3_166485References
1. Fernández-Jiménez R, Barreiro-Pérez M, Martin-García A, et al. Dynamic edematous response of the human heart to myocardial infarction: Implications for assessing myocardial area at risk and salvage. Circulation 2017;136:1288–1300. doi: 10.1161/CIRCULATIONAHA.116.025582.
2. Fernández-Jiménez R, Sánchez-González J, Agüero J, et al. Myocardial edema after ischemia/reperfusion is not stable and follows a bimodal pattern: Imaging and histological tissue characterization. J. Am. Coll. Cardiol. 2015;65:315–323. doi: 10.1016/j.jacc.2014.11.004.
3. Moon JC, Messroghli DR, Kellman P, et al. Myocardial T1 mapping and extracellular volume quantification: a Society for Cardiovascular Magnetic Resonance (SCMR) and CMR Working Group of the European Society of Cardiology consensus statement. J. Cardiovasc. Magn. Reson. 2013;15:92. doi: 10.1186/1532-429X-15-92.
4. Messroghli DR, Radjenovic A, Kozerke S, Higgins DM, Sivananthan MU, Ridgway JP. Modified look-locker inversion recovery (MOLLI) for high-resolution T 1 mapping of the heart. Magn. Reson. Med. 2004;52:141–146. doi: 10.1002/mrm.20110.
5. Welsh C, Di Bella E, Hsu E. Higher-Order Motion-Compensation for In Vivo Cardiac Diffusion Tensor Imaging in Rats. IEEE Trans. Med. Imaging 2015;0062:1–1. doi: 10.1109/TMI.2015.2411571.
6. Stoeck CT, von Deuster C, Genet M, Atkinson D, Kozerke S. Second-order motion-compensated spin echo diffusion tensor imaging of the human heart. Magn. Reson. Med. 2015;000:n/a-n/a. doi: 10.1002/mrm.25784.
7. Gotschy A, von Deuster C, Stoeck CT., et al. Myocardial extracellular volume expansion precedes functional myocardial alterations during the evolution of systemic sclerosis. In: Proc. Intl. Soc. Mag. Reson. Med. 25. ; 2017.
8. O H-Ici D, Jeuthe S, Al-Wakeel N, Berger F, Kuehne T, Kozerke S, Messroghli DR. T1 mapping in ischaemic heart disease. Eur. Heart J. Cardiovasc. Imaging 2014;15:597–602. doi: 10.1093/ehjci/jeu024.
9. Mekkaoui C, Jackowski MP, Kostis WJ, Stoeck CT, Thiagalingam A, Reese TG, Reddy VY, Ruskin JN, Kozerke S, Sosnovik DE. Myocardial scar delineation using diffusion tensor magnetic resonance tractography. J. Am. Heart Assoc. 2018;7. doi: 10.1161/JAHA.117.007834.
10. Wu MT, Tseng WYI, Su MYM, Liu CP, Chiou KR, Wedeen VJ, Reese TG, Yang CF. Diffusion tensor magnetic resonance imaging mapping the fiber architecture remodeling in human myocardium after infarction: Correlation with viability and wall motion. Circulation 2006;114:1036–1045. doi: 10.1161/CIRCULATIONAHA.105.545863.
Figures