3622
Quantitative Susceptibility Mapping for Mitral Annulus Calcification Detection via Validation of Computed Tomography/Echocardiography
Jiahao Li1,2, Hannah Mitlak3, Lakshmi Nambiar3, Romina Tafreshi3, Jiwon Kim3, Yi Wang1,2, Jonathan W. Weinsaft3, and Pascal Spincemaille2
1Biomedical Engineering, Cornell University, Ithaca, NY, United States, 2Radiology, Weill Cornell Medicine, New York, NY, United States, 3Medicine, Weill Cornell Medicine, New York, NY, United States
1Biomedical Engineering, Cornell University, Ithaca, NY, United States, 2Radiology, Weill Cornell Medicine, New York, NY, United States, 3Medicine, Weill Cornell Medicine, New York, NY, United States
Synopsis
Mitral annulus calcification is common in patients with mitral regurgitation and impacts prognosis and response to mitral valve interventions. While cardiac MRI is widely used to assess MR, identification of MAC is a key gap in current cardiac MRI. Quantitative susceptibility mapping is an emerging MRI tissue characterization approach that is sensitive to calcium because it is strongly diamagnetic. Here, we demonstrate the feasibility of using cardiac QSM for detecting MAC in patients using Computed Tomography and Echocardiography as reference.
Introduction
Mitral annulus calcification (MAC) is common in patients with mitral regurgitation (MR) and impacts prognosis and response to mitral valve interventions1. While cardiac MRI is widely used to assess MR2, identification of MAC is a key gap in current cardiac MRI. Quantitative susceptibility mapping (QSM) is an emerging MRI tissue characterization approach that is sensitive to calcium because it is strongly diamagnetic3. QSM has been used to detect calcification in phantoms and in the brain4. Here, we demonstrate the feasibility of using cardiac QSM for detecting MAC in patients using Computed Tomography and Echocardiography as reference.Methods
In this retrospective study, cardiac patients who had previously undergone cardiac CT or echocardiography were included. Cardiac QSM was acquired on a clinical 3T scanner (GE 750W) 20-30 minutes post gadolinium administration (0.2mmol/kg). The cardiac QSM sequence was an ECG-triggered navigator gated free-breathing multi-echo 3D GRE sequence.1D navigators were placed on the diaphragm and acquired both before and after data acquisition in each heart beat to limit respiratory motion of the final reconstructed data to a 4mm window. Multi-echo GRE was acquired for 5 echoes in each repetition time. The total field was fitted from the complex multi-echo data and unwrapped by graph-cut based method. QSM was obtained using total field inversion together with regularization on the variation of susceptibility within the left and right ventricular blood pools5.For identification of MAC, a myocardium region of interest (ROI) was drawn in three successive slices encompassing the mitral annulus (basal left ventricle) of the magnitude gradient echo magnitude images. Voxels on QSM were considered to be calcified if their susceptibility was below $$$\mu_Q - 1.5\sigma_Q$$$, with $$$\mu_Q$$$ and $$$\sigma_Q$$$ the mean and standard deviation of the combined ROI histogram across patients. Voxels on R2* were considered to be calcified if their R2* above $$$\mu_R - 1.5\sigma_R$$$, with $$$\mu_R$$$ and $$$\sigma_R$$$ derived from the R2* histogram. For each patient, a magnetic moment was computed as the sum of the susceptibilities of all calcified voxels multiplied with the voxel size (in mm3). A similar R2* moment was calculated from the R2* calcified voxels.
The presence and severity of MAC was established by the reference standard of CT or echocardiography, which were read blinded to QSM results. For 5 patients with MAC for which CT was available, a mitral calcification mask was drawn using ITK-SNAP. Next, a correlation was computed between the mean susceptibility values for all calcified voxels on QSM and the mean Hounsfield value from CT with in the CT derived MAC mask.
Results and Discussion
12 patients (age: 58±18yo, 58% male) underwent cardiac QSM (acquisition time 305±177.7s, navigator efficiency 46%, resolution 1.5x1.5x5mm3), among whom 7 had MAC (43% moderate, 57% mild) established by the reference of CT (n=10) and/or echo (n=12). On QSM, patients with MAC had lower susceptibility in the basal left ventricle (LV) compared to those without MAC(p=0.0034), while the R2* moment increased (p=0.13). Basal LV magnetic moment on QSM markedly differed between moderate MAC (-1307±481; p<0.001), and mild MAC patients compared to patients without MAC (-595±205 vs. -43±68; p<0.001) (Figure 1). Figure 2 show that the basal LV magnetic moment decreased as calcium severity grade increased on CT/echo, while the R2* moment increased. The measured susceptibility (magnetic moment) decreases with the severity of calcification. This is consistent with the diamagnetism (negative susceptibility relative to water) of calcifications. Figure 3 shows a good linear correlation between CT and QSM values in MAC (R2 = 0.94), again suggesting the ability of QSM to detect MAC using CT as the reference.Conclusion
In this initial validation study, cardiac susceptibility in the mitral annulus decreased according to the presence and graded severity of mitral annular calcification as established on CT/echo.Acknowledgements
No acknowledgement found.References
- Abramowitz Y, Jilaihawi H, Chakravarty T, Mack MJ, Makkar RR. Mitral Annulus Calcification. J Am Coll Cardiol. 2015;66(17):1934-1941. doi:10.1016/j.jacc.2015.08.872
- Garg P, Swift AJ, Zhong L, et al. Assessment of mitral valve regurgitation by cardiovascular magnetic resonance imaging. Nat Rev Cardiol. 2020;17(5):298-312. doi:10.1038/s41569-019-0305-z
- Wang Y, Liu T. Quantitative susceptibility mapping (QSM): Decoding MRI data for a tissue magnetic biomarker. Magn Reson Med. 2015;73(1):82-101. doi:10.1002/mrm.25358
- Chen W, Zhu W, Kovanlikaya I, et al. Intracranial calcifications and hemorrhages: Characterization with quantitative susceptibility mapping. Radiology. 2014;270(2):496-505. doi:10.1148/radiol.13122640
- Wen Y, Weinsaft JW, Nguyen TD, et al. Free breathing three-dimensional cardiac quantitative susceptibility mapping for differential cardiac chamber blood oxygenation - Initial validation in patients with cardiovascular disease inclusive of direct comparison to invasive catheterization. J Cardiovasc Magn Reson. 2019;21(1):1-13. doi:10.1186/s12968-019-0579-7
Figures
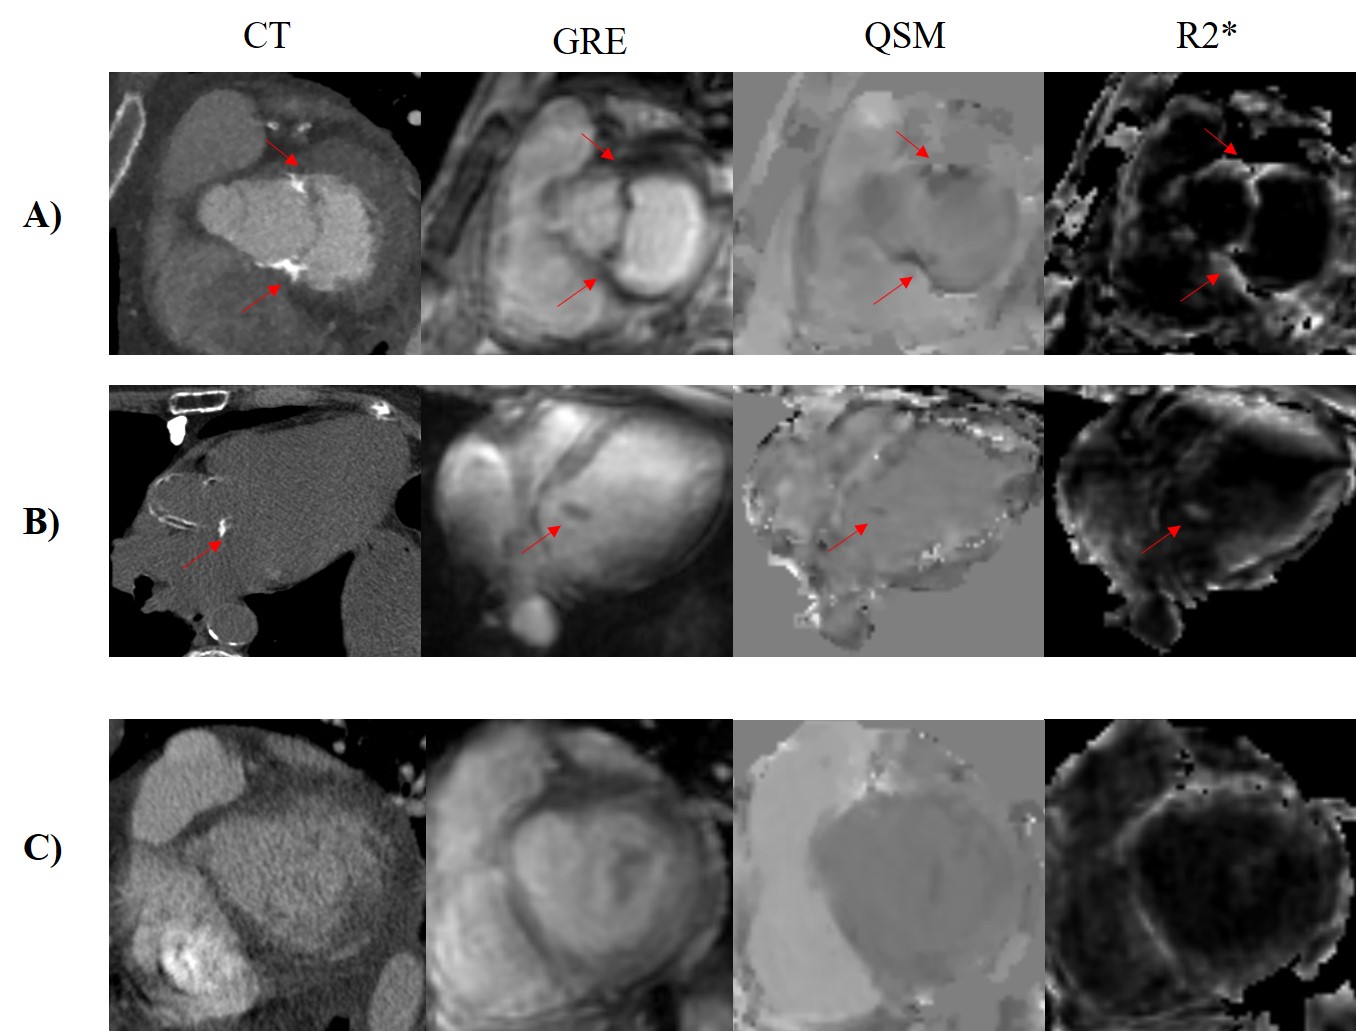
Figure 1. Gradient echo
(GRE), QSM and R2* in representative cases of A) moderate MAC, B) mild MAC, and
C) non-calcification. The corresponding computed tomography of each case is
shown in the first column as the reference for presence and severity of
calcification. The red arrows indicate the location of mitral annular
calcification.
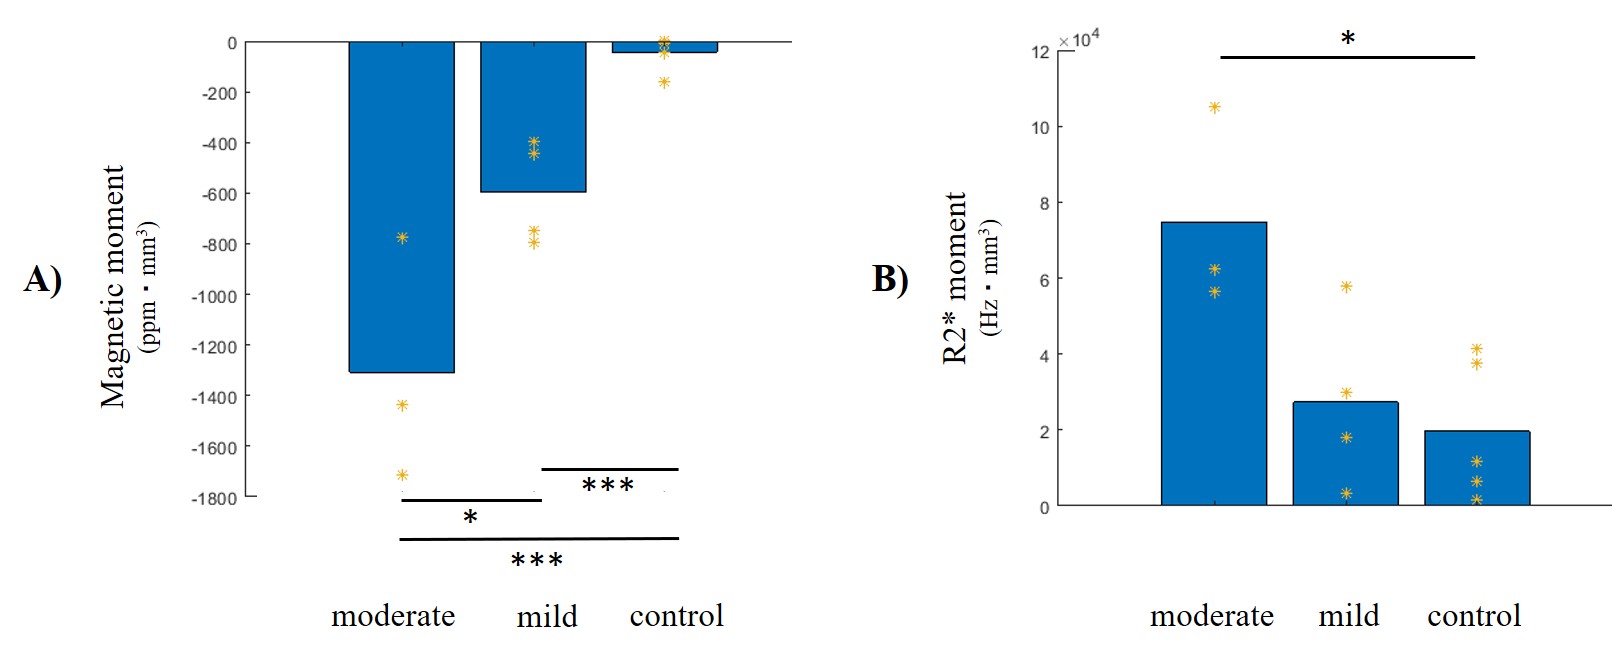
Figure 2. Magnetic moment (A) and the R2* moment (B) averaged
across patients in moderate MAC (n=3), mild MAC (n=4) and non-calcification
(n=5), as established by CT and/or echo. The moment of each individual patient
is indicated in yellow. * indicates p<0.05; *** indicates p<0.001.
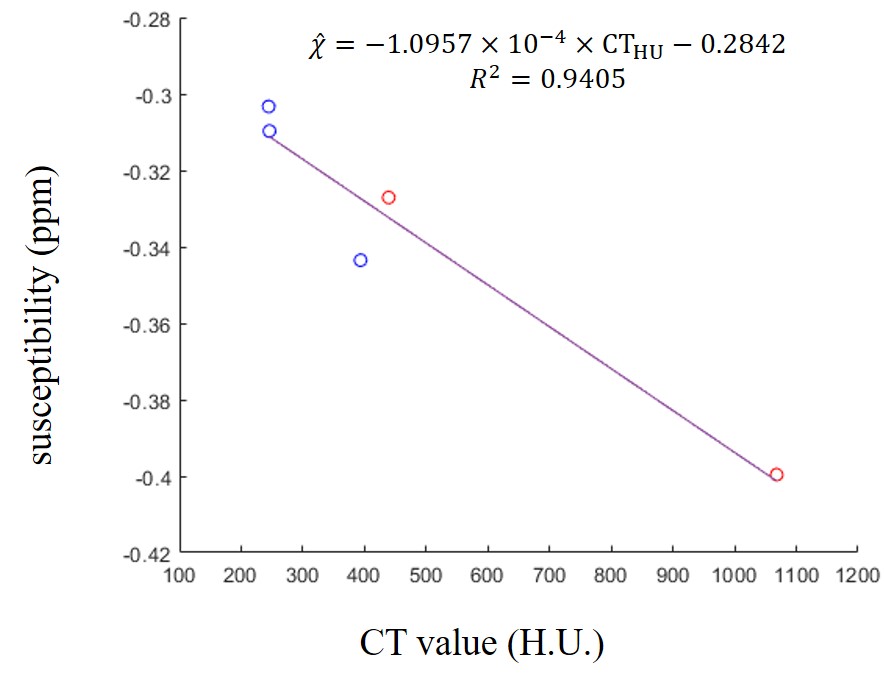
Figure 3. Correlation
between CT value and susceptibility in calcification regions from MAC patients.
Susceptibility detected by thresholding aligned well with CT reference as
linear relationship. H.U., Hounsfield unit; ppm, parts per million. Red points:
moderate calcification; blue points: mild calcification.