3620
Imaging of cardiac skeleton without contrast agents1Research Unit of Medical Imaging, Physics and Technology, University of Oulu, Oulu, Finland
Synopsis
We applied Relaxation along Fictitious Field with rank n (RAFFn) to clinical 3T scanner to study RAFFn contrast between cardiac skeleton and myocardium with multiple RAFFn refocusing times i.e. pulse durations in ex vivo porcine hearts. We found the relationship between relaxation times and RAFFn pulse duration in both cardiac skeleton and myocardium. Furthermore, the optimal pulse duration to gain maximum contrast was close to 2.5 ms. RAFF2 and T2 maps demonstrated higher contrast between cardiac skeleton and myocardium tissues when compared to T1 and T1ρ.
Introduction
MRI together with Gadolinium (Gd) contrast agent has been used to visualize the cardiac conduction system (CCS) as late Gd enhancement (LGE)1. CCS is surrounded by cardiac fibrous skeleton composed of dense connective tissue network, which may provide the opportunities to image the CCS based on the contrast between myocardium and tissues with high fibrous content. Previously, relaxation along fictious field (RAFF)2 and RAFF in nth rotating frame (RAFFn)3 have been applied to measure cardiac fibrosis in mouse models at 9.4T magnetic field4,5. The aim of this study was to demonstrate the contrast between cardiac skeleton and myocardium without contrast agent at 3T.Methods
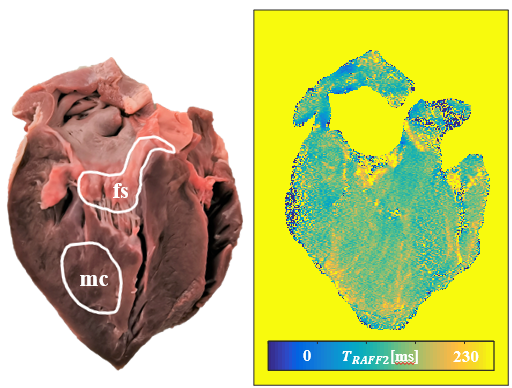
Ex-vivo swine hearts (n=11) were cut halves along long axis. All the measurements were completed at 3T using a Siemens Skyra (Siemens Healthineers GmbH, Erlangen Germany) scanner using Siemens knee coil. Imaging slice was selected close to cut surface. For RAFF2, the pulse duration was set between 1.4 ms and 4.2 ms, and the maximum pulse maximum amplitude to 500 Hz. Three contrasts with varying number of pulses in pulse train for example, 0, 12, 24 for 1.4 ms, and 0, 32 and 64 for 4.2 ms pulse duration, were acquired. For comparison, T1, T1ρ and T2 maps were acquired. Regions-of-interest (ROI) were located on fibrous skeleton and myocardium based on the corresponding anatomy photograph taken from cut surface. Relaxation times (TRAFF2, T2, T1 and T1ρ) were averaged on the ROIs. Relative relaxation time difference (RRTD=[T(fibrous skeleton)-T(myocardium)]/T(myocardium)) and contrast to noise ratio (CNR=[T(fibrous skeleton)-T(myocardium)]/σo(myocardium)×100%) of relaxation times were calculated between fibrous skeleton and myocardium areas. Differences of relaxation times between fibrous skeleton and myocardium, and the difference between TRAFF2, T2, T1 and T1ρ were evaluated by using Student’s t-test.Results
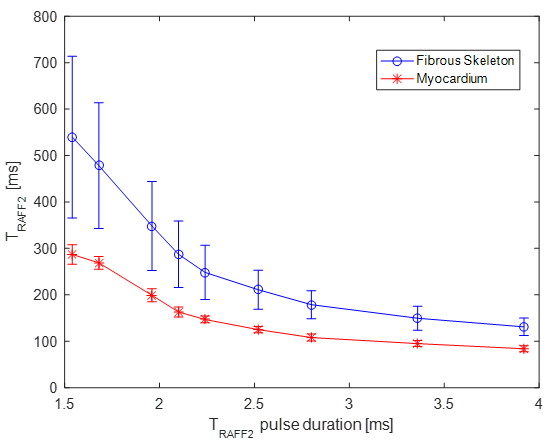
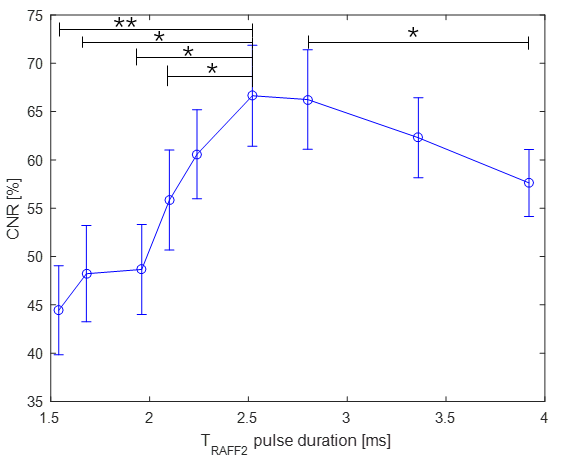
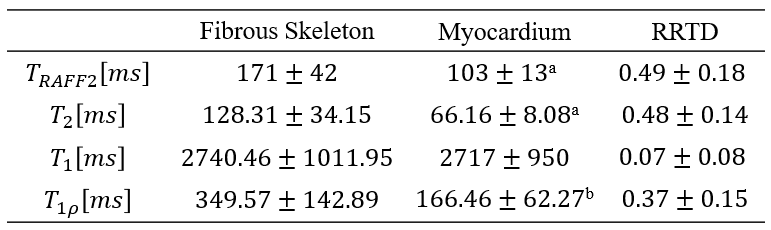
Relaxation times acquired in fibrous skeleton area were higher than in myocardium area (Figure 1), and the relaxation times of these two ROIs decrease with pulse duration (Figure 2). It was found that CNR increases with pulse durations below 2.5 ms, and then decreases (Figure 3). The optimal TRAFF2 pulse duration to obtain maximum CNR being 2.5 ms. The significant differences were found in the relaxation times between fibrous skeleton and myocardium areas in TRAFF2, T2 and T1ρ (Table 1). Differences can be found in RRTD between these four different imaging techniques, and there was a significant difference in RRTD between RAFF2 and T1 (p<0.01). RAFF2 and T2 exhibited higher RRTD, which means higher contrast between fibrous skeleton and myocardium.Discussion
We took into account the CNR to quantify the contrast between fibrotic and myocardium tissues and observed the relationship between CNR and pulse duration. From the comparison between four different imaging sequences, we have found that RAFF2 and T2 maps can gain higher contrast between fibrous skeleton and myocardium than T1ρ and T1. Current results agree well with previous studies where higher relaxation times were associated with fibrous area both in infarct and hypertrophic mouse hearts4,5. Longer TRAFF2, T1ρ and T2 in cardiac skeleton compared to myocardium reflects more likely larger extra cellular space than larger proton exchange in collagen rich cardiac skeleton compared to myocardium.Conclusion
Both TRAFF2 and T2 maps showed high contrast between fibrous skeleton and myocardium areas. Both TRAFF2 and T2 maps may be used to visualize cardiac skeleton structure without the use of contrast agent.Acknowledgements
This research was funded by Academy of Finland, Finnish Cardiovascular Foundation and Aarne Koskelo Foundation.References
1Csepe T A, Zhao J, Sul L V, et al. Novel application of 3D contrast-enhanced CMR to define fibrotic structure of the human sinoatrial node in vivo. European Heart Journal-Cardiovascular Imaging, 2017, 18: 862-869.
2Liimatainen T, Sorce D J, O'Connell R, et al. MRI contrast from relaxation along a fictitious field (RAFF). Magnetic resonance in medicine, 2010, 64: 983-994.
3Liimatainen T, Hakkarainen H, Mangia S, et al. MRI contrasts in high rank rotating frames. Magnetic resonance in medicine, 2015, 73: 254-262.
4Khan M A, Laakso H, Liimatainen T, et al. The follow‐up of progressive hypertrophic cardiomyopathy using magnetic resonance rotating frame relaxation times. NMR in Biomedicine, 2018, 31: e3871.
5Yla-Herttuala E, Laidinen S, Laakso H, &Liimatainen T. Quantification of myocardial infarct area based on TRAFFn relaxation time maps - comparison with cardiovascular magnetic resonance late gadolinium enhancement, T1rho and T2 in vivo. J Cardiovasc Magn Reson. 2018; 20:34.
Figures