3618
Multidimensional Diffusion MRI in the Ex Vivo Mouse Heart1Leeds Institute of Cardiovascular and Metabolic Medicine, University of Leeds, Leeds, United Kingdom, 2Random Walk Imaging, Lund, Sweden, 3Danish Research Centre for Magnetic Resonance, Centre for Functional and Diagnostic Imaging and Research, Copenhagen University Hospital Hvidovre, Copenhagen, Denmark, 4Department of Neurosurgery, Neurobiology, and Anatomy, Medical College of Wisconsin, Milwaukee, WI, United States, 5Clinical Sciences, Lund University, Lund, Sweden, 6Harvard Medical School, Boston, MA, United States, 7Brigham and Women's Hospital, Boston, MA, United States
Synopsis
Multidimensional diffusion MRI, specifically, tensor-valued encoding is a promising technique for improving specificity in microstructural measurements in the myocardium beyond that achievable with DTI. Tensor-valued encoding data combining linear and spherical tensor encoding were acquired in ex vivo mouse hearts at 7T, including an isoproterenol-induced model of hypertrophy. Covariance and gamma fitting methods were employed to reconstruct parameter maps reflecting the isotropic and anisotropic components of the diffusion signal kurtosis. The results were consistent across both methods, and highlight the potential of multidimensional diffusion MRI for improving specificity in cardiac diffusion MRI.
Purpose
Cardiac diffusion MRI is an emerging contrast agent-free method for non-invasive assessment of cardiac microstructure. Diffusion tensor imaging (DTI) has shown great promise in characterising microstructural changes in disease such as myocardial infarction1, hypertrophy2, fibrosis3 and dilated cardiomyopathy4. While DTI-based metrics such as mean diffusivity (MD) and fractional anisotropy (FA) are sensitive to microstructural changes, they are affected by a range of underlying physical properties such as oedema, fibrosis and cell disarray, and have relatively poor specificity.More advanced techniques such as double diffusion encoding (DDE)5, oscillating gradient spin echo (OGSE)6 and q-magic angle spinning (QMAS)7, 8 have been proposed for enhanced specificity. In the heart, non-Gaussian diffusion signal models have been shown to distinguish control vs hypertrophic hearts better than DTI9, compartmental models have been used to estimate cell volume fractions and sizes10, DDE has been used for measuring microscopic FA (µFA) that is insensitive to macroscopic orientation dispersion11, and OGSE has highlighted diffusion time dependence in the mouse myocardium12. Velocity and acceleration-compensated b-tensor encoding has been used to measure trace-weighted signal in vivo in a single shot, with added potential for improving specificity in microstructural characterisation13.
In contrast to conventional pulsed gradient spin echo (PGSE)14, multidimensional diffusion MRI, specifically tensor-valued encoding in this context, employs arbitrary trajectories in q-space, enabling acquisition of different b-tensor shapes, e.g. sticks, planes and spheres corresponding to linear, planar and spherical tensor encoding (LTE, PTE and STE) respectively15, 16. Fitting of a fourth-order tensor permits estimation of the intra-voxel covariance15 of diffusion tensors, and estimation of scalar invariants such microscopic orientation coherence (Cc), normalised size variance (CMD), µFA, and isotropic and anisotropic kurtosis (MKi; MKa)7, 17. Another approach approximates the diffusion probability density with the gamma distribution, yielding information on kurtosis and µFA, as well as variance from isotropic and anisotropic components7, 8.
Here, we combined a QMAS acquisition7 with the covariance and gamma fitting methods, and introduce parameters for the assessment of myocardial microstructure. Proof-of-concept data are presented in ex vivo mouse hearts, including a control and an isoproterenol-induced model of hypertrophy.
Methods
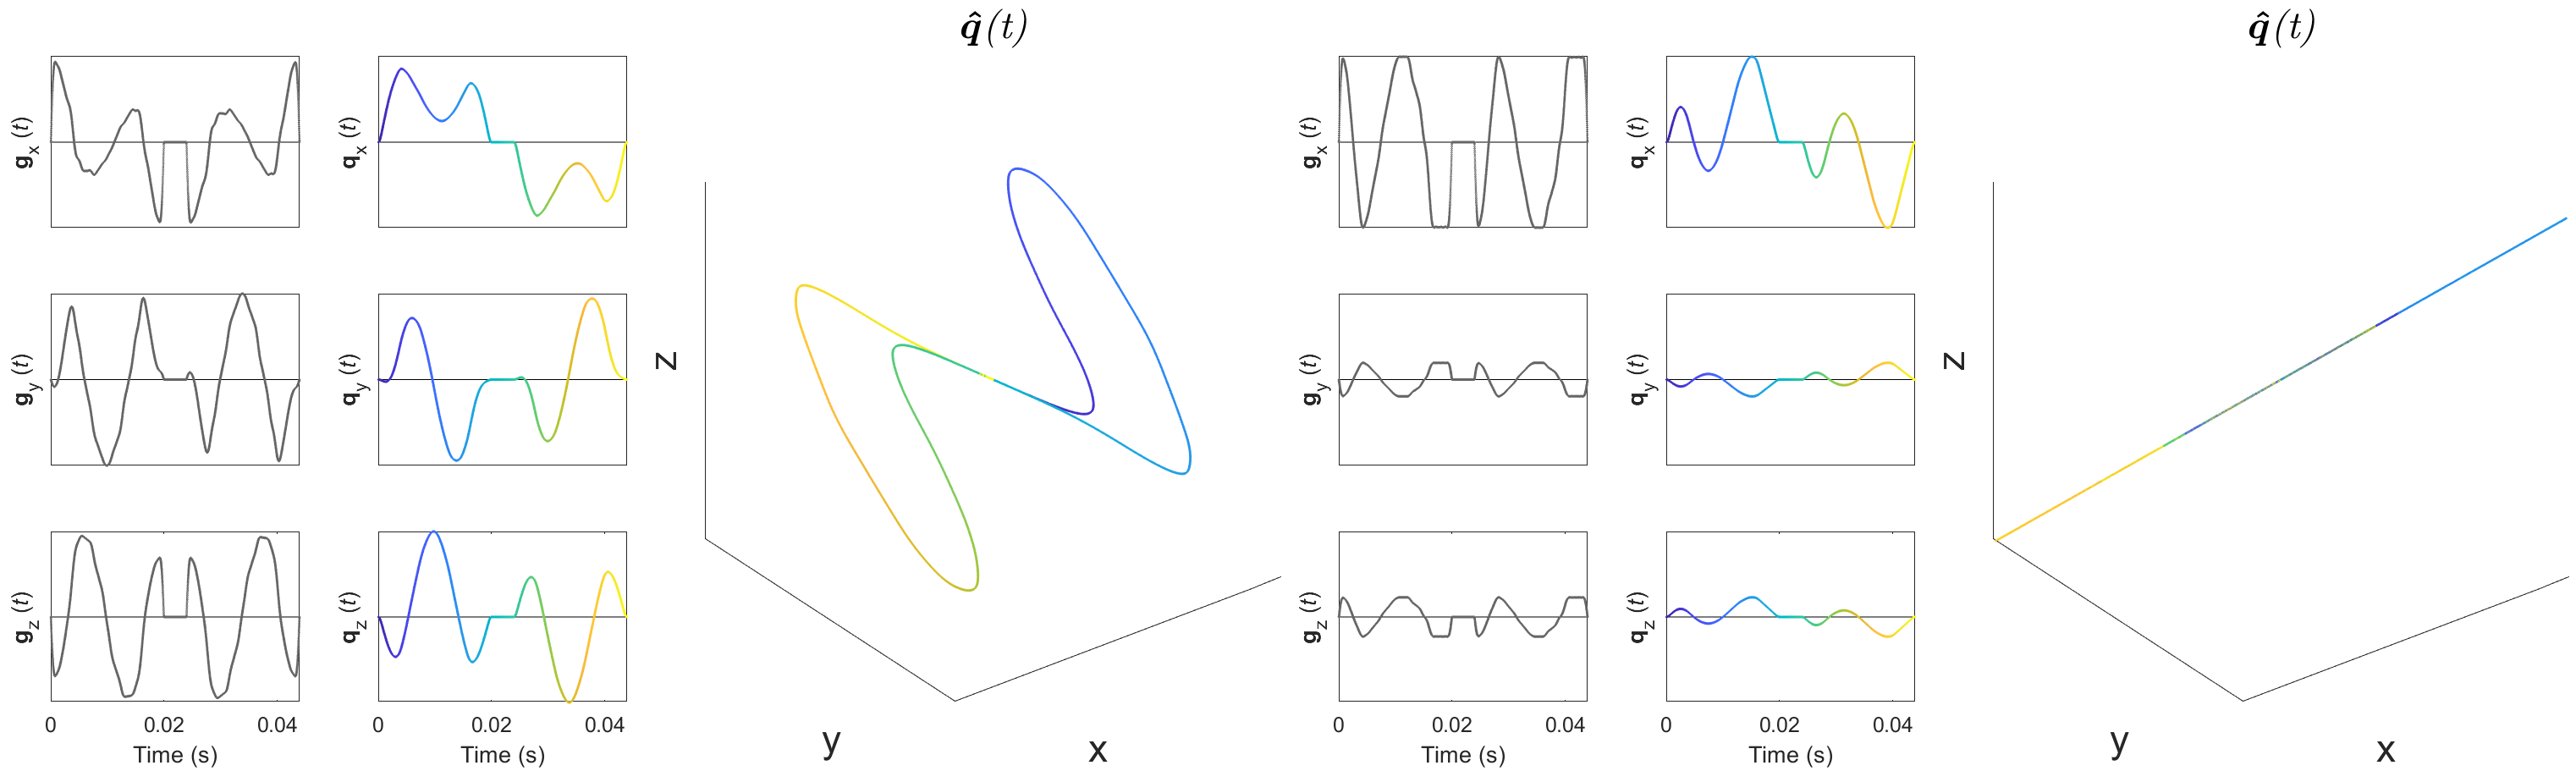
Saline (control; N=1) and isoproterenol (N=1) were delivered to wildtype C57/Bl6 mice18 via implanted osmotic mini-pumps (Alzet, Cupertino, CA, USA). Hearts were arrested in slack state, perfusion fixed, excised and immersion fixed in paraformaldehyde. Hearts were embedded in 1% agarose PBS gel for MRI. All animal use was authorised by the local Animal Ethics Committee and The Home Office, UK. Data were acquired on a Bruker Biospec 7T MRI using a 20 mm diameter transmit-receive volume coil. 3D multi-shot EPI sequences with tuned QMAS LTE and STE waveforms19 (Figure 1) were used: TR = 1000 ms, TE = 54.8 ms, FOV = 10.8 × 9 × 9 mm, resolution = 225 × 225 × 450 µm, encoding time = 20 ms, diffusion directions = 15, b = [0, 0.1 0.5 1.0 1.5] ms/µm2. Data were analysed in Matlab20 and fitting was performed using DTI, covariance and gamma distribution models. Parameter maps were generated, and values reported in a single mid-myocardial short-axis slice in the left ventricle.Results
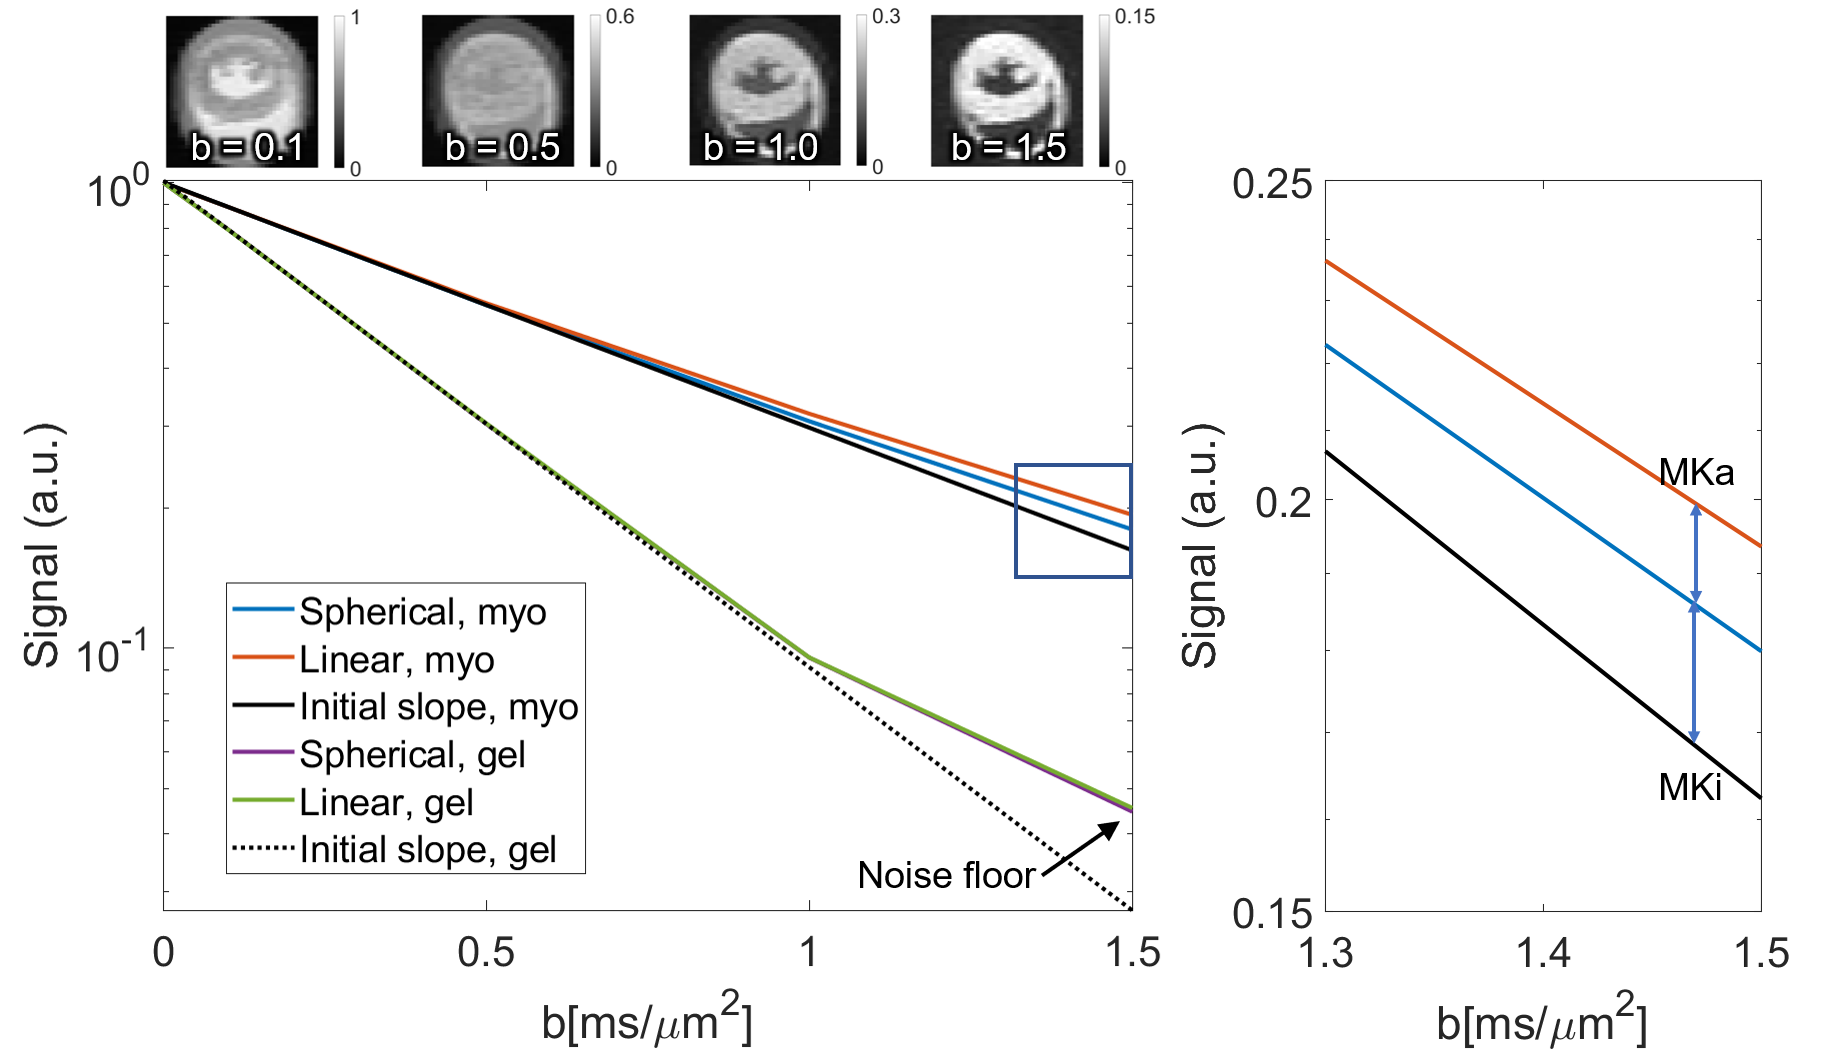
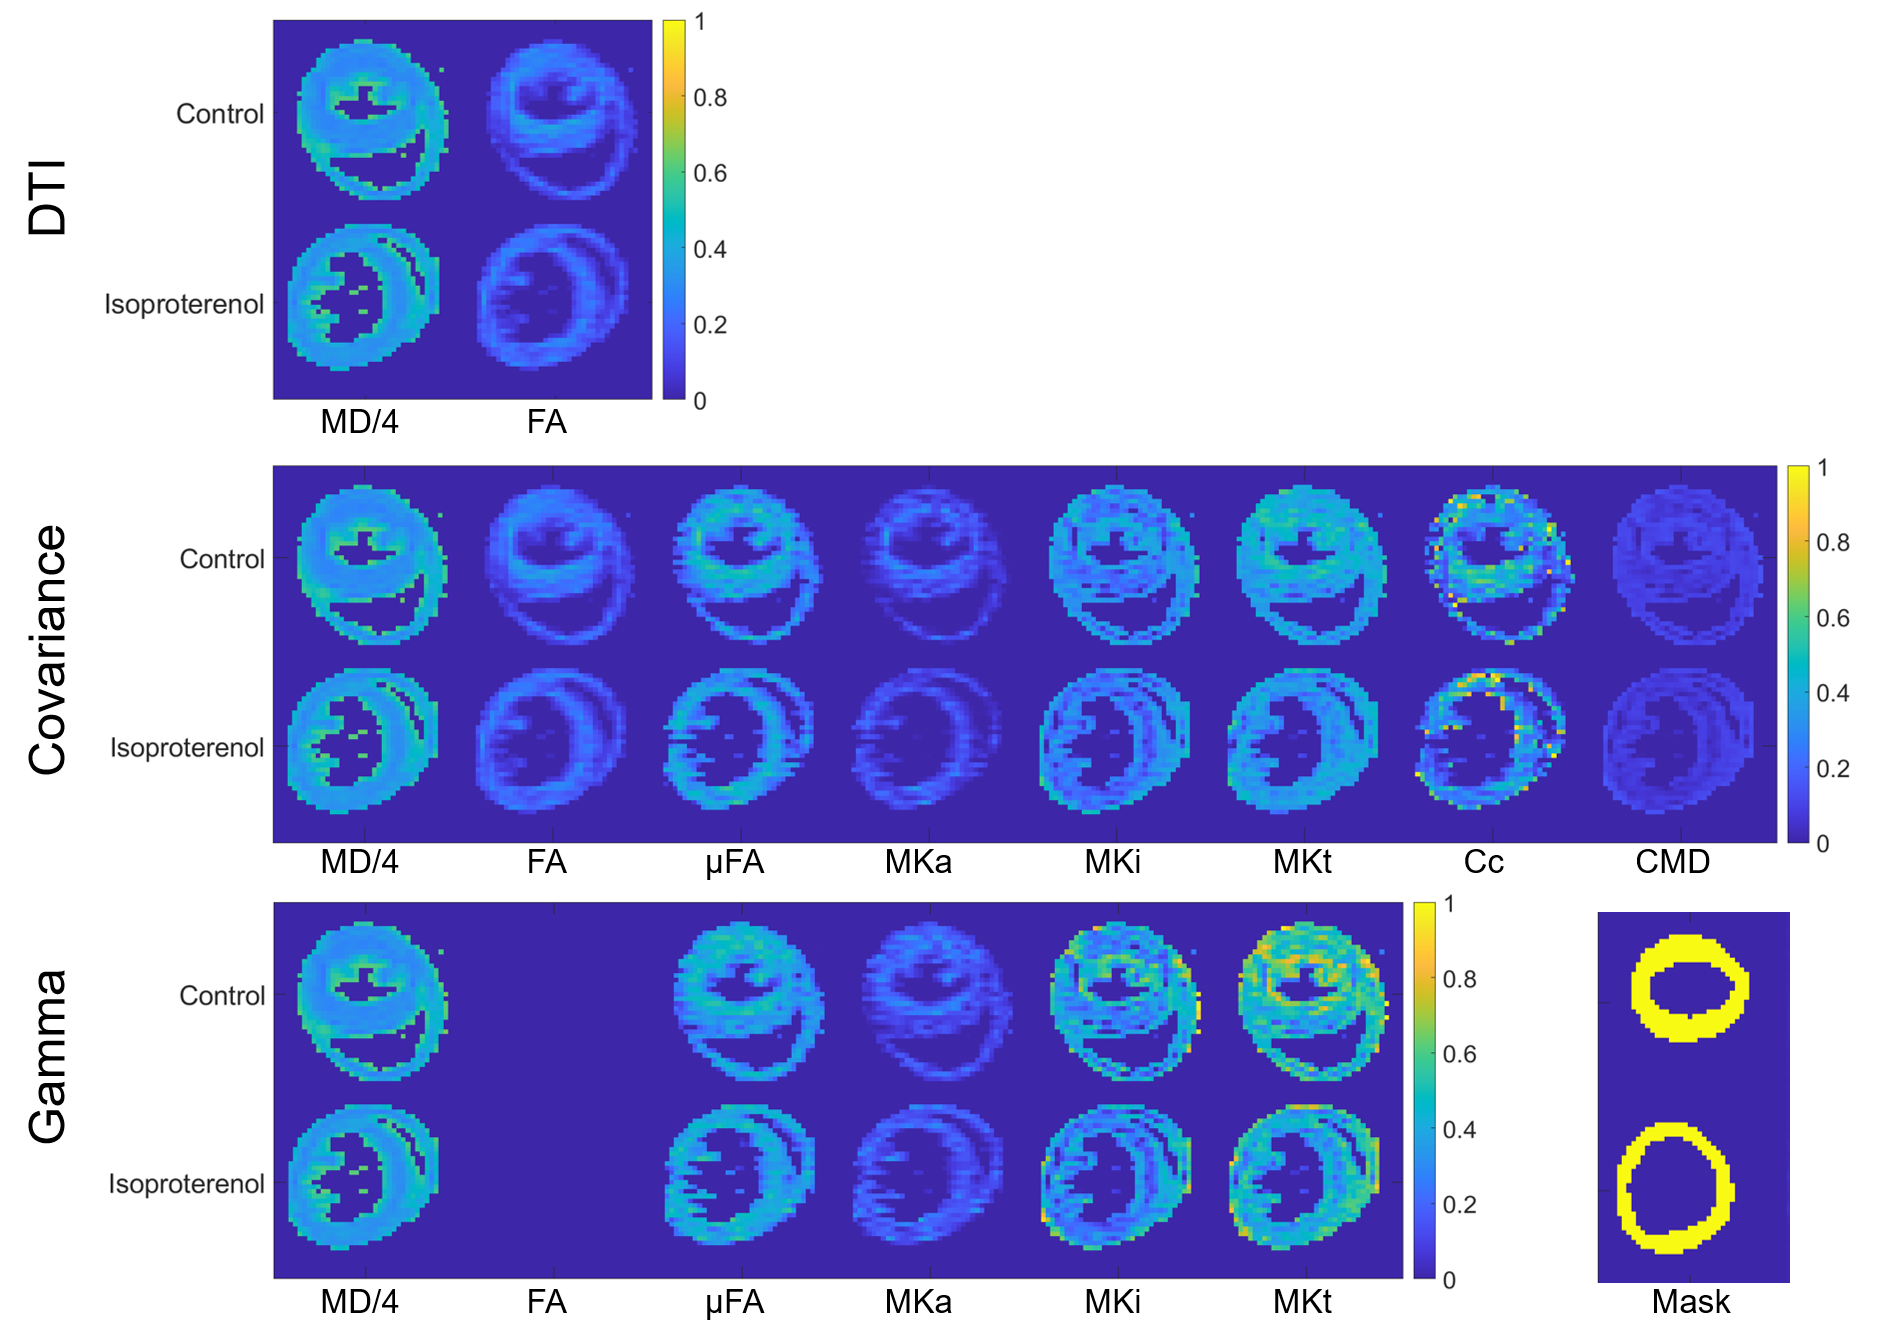
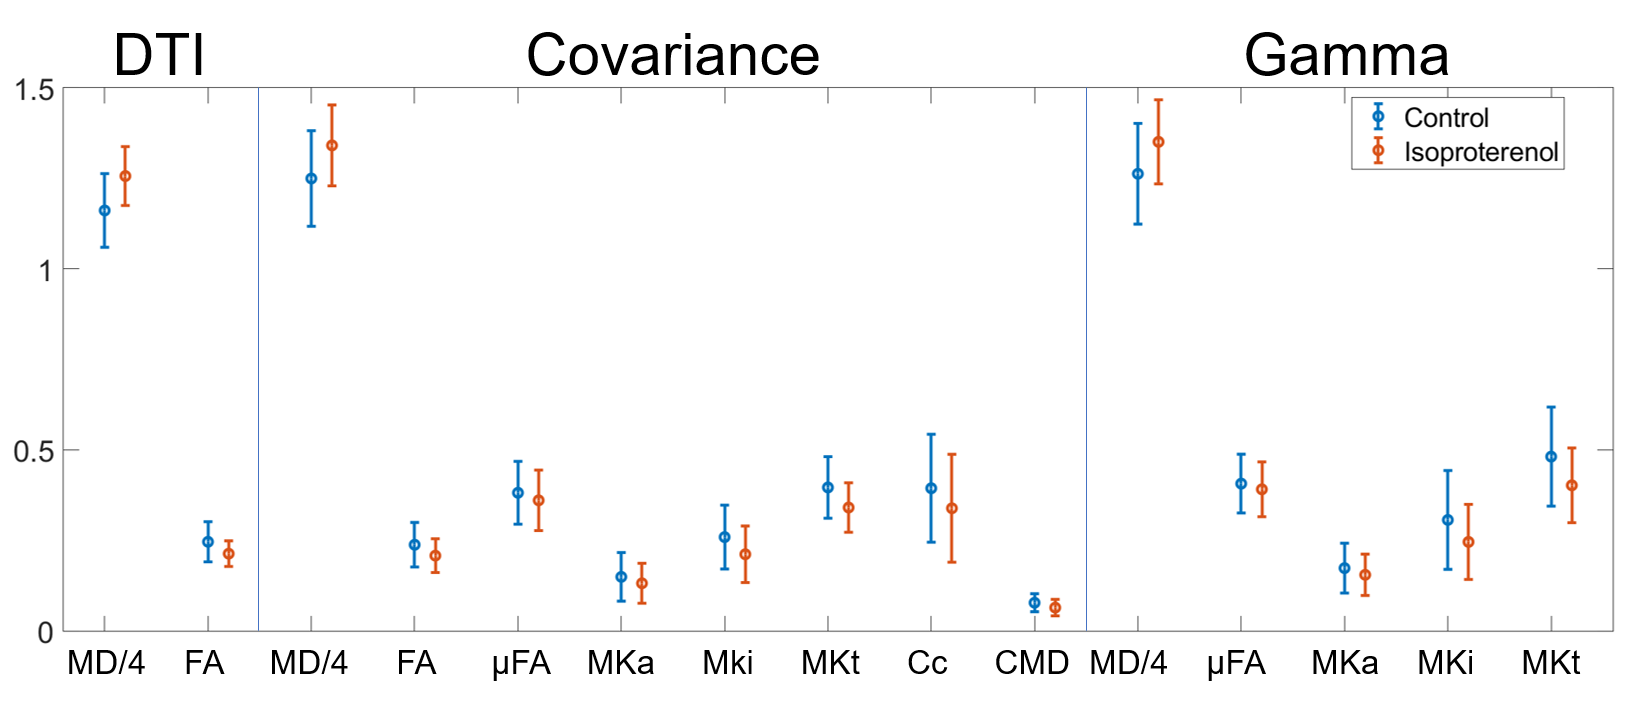
The signal difference between the averaged LTE and STE at b = 1.5 ms/µm2 relative to b = 0 ms/µm2 was 1.4% and 0.06% in the myocardium and gel respectively (Figure 2). The range of MDE parameters, which are not available with conventional DTI, are reported in Figure 3. Figure 4 reports on the parameters values in a mid-myocardial short-axis slice. Among selected parameters, mean MD / FA were +8.2% / -13% in the isoproterenol-treated relative to control heart. Corresponding differences in µFA / MKa / MKi / Cc / CMD (covariance) were ‑5.5% / -12% / -18% / -14% / -17%, and µFA / MKa / MKi (gamma) were -3.8% / -11% / -20%.Discussion
The higher MD and lower FA in the isoproterenol-treated heart may reflect increased cell size and/or cell disarray relative to the control heart. The lower orientation coherence from the covariance model corroborates the latter, while the lower µFA reflects lower diffusion anisotropy on the microscopic scale, which may be related to lower cell eccentricity. That MKi is lower in the isoproterenol-treated heart suggests lower isotropic heterogeneity that could stem from reduced variation in cell density. Both covariance and gamma models gave similar µFA, MKa and MKi. These preliminary findings indicate that µFA and MK are lower in the myocardium compared to in brain white matter (0.74 and 0.93 respectively)15. This may be due to the larger diameter or higher cell permeability in cardiomyocytes relative to axons. Naturally, larger sample sizes will be needed to establish significance of such observations. Furthermore, it will be necessary to incorporate motion-compensation methods for in vivo application21, and to validate the measurements independently. We are also evaluating the sensitivity of measurements to diffusion times and b. Whilst excluded here by using tuned waveforms, diffusion time dependence is an important consideration that we explore in a related ISMRM abstract. In summary, we have demonstrated feasibility of tensor-valued encoding in ex vivo mouse hearts, and introduced parameters, unavailable with DTI, for improving specificity in characterising the myocardial microstructure.Acknowledgements
This work was supported by the British Heart Foundation, UK (PG/19/1/34076, SI/14/1/30718). Dr. Dall'Armellina is a BHF Intermediate Clinical Research Fellow (FS/13/71/30378). SL and HL have received funding from the European Research Council (ERC) under the European Union’s Horizon 2020 research and innovation programme (grant agreement No 804746). SL is supported also by Random Walk Imaging. We thank Markus Nilsson for his expert inputs, and Joanna Koch-Paszkowski and Leah Khazin for their work on the sample preparation.References
1. Wu MT, Tseng WY, Su MY, Liu CP, Chiou KR, Wedeen VJ, Reese TG and Yang CF. Diffusion tensor magnetic resonance imaging mapping the fiber architecture remodeling in human myocardium after infarction: correlation with viability and wall motion. Circulation. 2006;114:1036-45.
2. Tseng W-Y, Dou J, Reese TG and Wedeen VJ. Imaging myocardial fiber disarray and intramural strain hypokinesis in hypertrophic cardiomyopathy with MRI. Journal of magnetic resonance imaging : JMRI. 2006;23.
3. Nguyen C, Lu M, Fan Z, Bi X, Kellman P, Zhao S and Li D. Contrast-free detection of myocardial fibrosis in hypertrophic cardiomyopathy patients with diffusion-weighted cardiovascular magnetic resonance. Journal of cardiovascular magnetic resonance : official journal of the Society for Cardiovascular Magnetic Resonance. 2015;17:107.
4. Abdullah OM, Drakos SG, Diakos NA, Wever-Pinzon O, Kfoury AG, Stehlik J, Selzman CH, Reid BB, Brunisholz K, Verma DR, Myrick C, Sachse FB, Li DY and Hsu EW. Characterization of diffuse fibrosis in the failing human heart via diffusion tensor imaging and quantitative histological validation. NMR in biomedicine. 2014;27:1378-86.
5. Jespersen SN, Lundell H, Sonderby CK and Dyrby TB. Orientationally invariant metrics of apparent compartment eccentricity from double pulsed field gradient diffusion experiments. NMR in biomedicine. 2013;26:1647-62.
6. Colvin DC, Loveless ME, Does MD, Yue Z, Yankeelov TE and Gore JC. Earlier detection of tumor treatment response using magnetic resonance diffusion imaging with oscillating gradients. Magn Reson Imaging. 2011;29:315-23.
7. Lasic S, Szczepankiewicz F, Eriksson S, Nilsson M and Topgaard D. Microanisotropy imaging: quantification of microscopic diffusion anisotropy and orientational order parameter by diffusion MRI with magic-angle spinning of the q-vector. Frontiers in Physics. 2014.
8. Szczepankiewicz F, Lasic S, van Westen D, Sundgren PC, Englund E, Westin CF, Stahlberg F, Latt J, Topgaard D and Nilsson M. Quantification of microscopic diffusion anisotropy disentangles effects of orientation dispersion from microstructure: applications in healthy volunteers and in brain tumors. NeuroImage. 2015;104:241-52.
9. McClymont D, Teh I, Carruth E, Omens J, McCulloch A, Whittington HJ, Kohl P, Grau V and Schneider JE. Evaluation of non-Gaussian diffusion in cardiac MRI. Magnetic resonance in medicine : official journal of the Society of Magnetic Resonance in Medicine / Society of Magnetic Resonance in Medicine. 2017;78:1174-1186.
10. McClymont D, Teh I, Whittington HJ, Lygate C and Schneider JE. Inferring cell morphology in the heart with a compartment model of diffusion MRI. Paper presented at: In: Proceedings of the 25th Annual Meeting of ISMRM, Honolulu, USA; 2017.
11. Teh I, Lundell H, Whittington HJ, Dyrby TB and Schneider JE. Resolving Microscopic Fractional Anisotropy in the Heart. Paper presented at: In: Proceedings of the 24th Annual Meeting of ISMRM, Singapore; 2016.
12. Teh I, Schneider JE, Whittington HJ, Dyrby TB and Lundell H. Temporal Diffusion Spectroscopy in the Heart with Oscillatiing Gradients. Proc Int Soc Magn Reson Med. 2017:3114.
13. Lasic S, Szczepankiewicz F, Dall'Armellina E, Das A, Kelly C, Plein S, Schneider JE, Nilsson M and Teh I. Motion-compensated b-tensor encoding for in vivo cardiac diffusion-weighted imaging. NMR in biomedicine. 2020;33:e4213.
14. Stejskal EO and Tanner JE. Spin Diffusion Measurements: Spin Echoes in the Presence of a Time-Dependent Field Gradient. J Chem Phys. 1965;42:288.
15. Westin CF, Knutsson H, Pasternak O, Szczepankiewicz F, Ozarslan E, van Westen D, Mattisson C, Bogren M, O'Donnell LJ, Kubicki M, Topgaard D and Nilsson M. Q-space trajectory imaging for multidimensional diffusion MRI of the human brain. NeuroImage. 2016;135:345-62.
16. Topgaard D. Multidimensional diffusion MRI. Journal of magnetic resonance. 2017;275:98-113.
17. Szczepankiewicz F, van Westen D, Englund E, Westin CF, Stahlberg F, Latt J, Sundgren PC and Nilsson M. The link between diffusion MRI and tumor heterogeneity: Mapping cell eccentricity and density by diffusional variance decomposition (DIVIDE). NeuroImage. 2016;142:522-532.
18. Ainscough JF, Drinkhill MJ, Sedo A, Turner NA, Brooke DA, Balmforth AJ and Ball SG. Angiotensin II type-1 receptor activation in the adult heart causes blood pressure-independent hypertrophy and cardiac dysfunction. Cardiovasc Res. 2009;81:592-600.
19. Lundell H, Nilsson M, Dyrby TB, Parker GJM, Cristinacce PLH, Zhou FL, Topgaard D and Lasic S. Multidimensional diffusion MRI with spectrally modulated gradients reveals unprecedented microstructural detail. Scientific reports. 2019;9:9026.
20. Nilsson M, Szczepankiewicz F, Lampinen B, Ahlgren A, de Almeida Martins JP, Lasic S, Westin CF and Topgaard D. An open-source framework for analysis of multidimensional diffusion MRI data implemented in MATLAB. Paper presented at: In: Proceedings of the 26th Annual Meeting of ISMRM, Paris; 2018.
21. Lasic S, Lundell H, Szczepankiewicz F, Nilsson M, Schneider JE and Teh I. Time-dependent and anisotropic diffusion in the heart: linear and spherical tensor encoding with varying degree of motion compensation. Proc Int Soc Magn Reson Med. 2020:4300.
22. Lundell H, Lasic S, Szczepankiewicz F, Nilsson M, Topgaard D, Schneider JE and Teh I. Stay on the beat: tuning in on time-dependent diffusion in the heart. Proc Int Soc Magn Reson Med. 2020:959.
Figures