3617
Time-averaged wall shear stress: a potential indicator for carotid intra-plaque hemorrhage1Center for Biomedical Imaging Research, Tsinghua University, Beijing, China, 2Department of Radiology, Sun Yat-Sen Memorial Hospital, Sun Yat-Sen University, Guangzhou, China
Synopsis
We investigated the relationship between the TAWSS and presence of plaque components in histology combined with plaque burden metrics interpreted from multi-contrast MR images among patients scheduled for CEA within one week. Based on 18 patients with 60-slice histological and MR images, correlation analysis revealed that there is an association between the presence of IPH and TAWSS. In addition, our findings indicated that TAWSS can improve the performance of plaque burden metrics, MWT in predicting presence of IPH.
Introduction
Carotid atherosclerotic plaques is known as one of the major etiologies for ischemic stroke1,2. A number of studies demonstrated that intra-plaque hemorrhage (IPH), one of the key features of carotid vulnerable atherosclerotic plaques3, is associated with cerebrovascular events. Hemodynamic parameters measured by image-based computed fluid dynamics (CFD), such as wall shear stress (WSS) have been widely applied to evaluate the vulnerability of carotid plaques4. It is well established that low WSS correlates with plaque formation, whereas high WSS plays important role in plaque rupture5. Nevertheless, the association between WSS and carotid IPH is not fully investigated. In this study, we aimed to determine the association between hemodynamic parameters measured by CFD method based on carotid morphology derived from multi-contrast MRI and carotid IPH.Methods
Study population: Eighteen patients with moderate-to-severe carotid atherosclerotic stenosis who were scheduled for carotid endarterectomy (CEA) were recruited. The study protocol was approved by institutional review board and written consent form was obtained from all subjects. MR imaging protocol: Multi-contrast carotid MRI was conducted on a whole-body 3.0T MR scanner (Achieva TX, Philips Healthcare) with 8-channel carotid coil within one week before CEA. The detailed imaging parameters are listed in Table 1. Histology and MR images analysis: The carotid plaque specimens were obtained from a routine CEA procedure and histological process was performed with H&E stain. The histological images were interpreted by two experienced histologists and presence of different plaque components was recorded. The lumen and outer wall boundaries of carotid arteries were outlined and the Max wall thickness (MWT) was measured on MR images which were matched to the histologic slices by two experienced radiologists. Geometric model: The geometric models were reconstructed from MRI segmentation by using the image processing tool VMTK (the Vascular Modeling Toolkit 1.4.0, Orobix srl). CFD model and analysis: The reconstructed geometries were meshed by ICEM CFD (ANSYS 19.2 Inc., USA) with tetrahedral elements in the core region and prismatic cells in the 5 boundary layers of vessel wall. We assumed the blood flow as incompressible and Newtonian fluid. The dynamic viscosity and density of blood were set as 0.0035 Pa*s and 1066 kg/m3, respectively. The velocity of inlet and pressure of outlets were extracted from numerous volunteers’ data. CFX (ANSYS 19.2 Inc., USA) was used to solve the Navier-Stokes model with the time step size of 0.08 s and 300 steps (equals to 3 cardiac cycles). The computed data from the third cycle were used for analysis. To evaluate the mechanical influence of the flow, several WSS-based metrics were applied to this study, including time-averaged WSS (TAWSS, defined in Equation 1) and time-averaged peak WSS (TApWSS). The workflow of the post-processing was presented as Figure 1. Statistical analysis: All the matched histological and MR images were included for component identification and parameter extraction. Spearman correlation analysis was conducted to calculate the correlation coefficients. The ROC analysis was performed to calculate the area-under-the-curve (AUC) of MWT and TAWSS in discriminating presence of carotid IPH. All statistical analyses were conducted using SPSS 26.0 (SPSS Inc. Chicago, IL, USA).Results
Of 18 patients enrolled in this study, 60 histological slices were matched with MRI images. The correlation coefficients between different plaque components and hemodynamic parameters are illustrated in Table 2. TAWSS was significantly correlated with the presence of IPH determined by histology (r=0.267, p=0.039). Meanwhile, the correlation coefficient between the number of plaque components and the time-averaged value of peak WSS was 0.263 (p=0.043). Figure 2 summarized the results of ROC analysis for predicting the presence of IPH with TAWSS. In predicting the presence of IPH, the AUC of TAWSS, MWT, and combined TAWSS with MWT was 0.657 (95% CI, 0.518-0.797), 0.715 (95% CI, 0.579-0.851), and 0.784 (95% CI, 0.658-0.910), respectively. In predicting carotid IPH, the optimal cut-off value of TAWSS was 4.09 Pa with sensitivity of 72.2% and specificity of 58.3%.Discussion and Conclusion
In this study, TAWSS was found to be associated with carotid IPH. In discriminating carotid IPH, the strength of combination between TAWSS and plaque burden was higher than each measurement alone. Our findings suggest that TAWSS is a potential indicator for carotid vulnerable plaque features of IPH. According to a patient-specific case study, Wang et al found that the location of IPH and calcification had an association with TAWSS4. However, the reliability of the results of this case report needs further investigated by increasing study sample size. In addition, investigators of this case report only evaluated one slice which could not represent the overall plaque features. In our study, 18 patients with 60 slices of histological and MR images were included which increase the repeatability of findings. Although weak correlation between TAWSS and carotid IPH was found in our study, TAWSS could improve the AUC of MWT up to 6.9% after combined TAWSS with MWT in predicting presence of IPH. From the aspect of fluid dynamics, wall shear stress can influence the formation environment of early-stage plaque. Our findings suggest that changes of shear stress distribution and geometric features of blood vessel may affect the mechanical property and stimulate the progression of atherosclerotic plaque, particularly formation of the vulnerable plaque.Acknowledgements
None.References
1. Benjamin, E. J., Muntner, P., Alonso, A., Bittencourt, M. S., Callaway, C. W., Carson, A. P., et al. Heart disease and stroke statistics-2019 update: a report from the American Heart Association. Circulation. 2019, 139, e56–528.
2. Markus, H. (2016). Stroke: causes and clinical features. Medicine. 44, 515–520.
3. Michel JB, Virmani R, Arbustini E, Pasterkamp G (2011) Intra-plaque hemorrhages as the trigger of plaque vulnerability. European Heart Journal. 32:1977–1985.
4. Wang J., Paritala P. K., Mendieta J. B., et al. Carotid Bifurcation with tandem stenosis—a patient-specific case study combined in vivo imaging, in vitro Histology and in silico Simulation. Frontiers in Bioengineering and Biotechnology. 2019, 7(349):1-11.
5. D. Lopes, H. Puga, J. Teixeira, R. Lima. Blood flow simulations in patient-specific geometries of the carotid artery: A systematic review. Journal of Biomechanics. 2020,111:1-17.
Figures
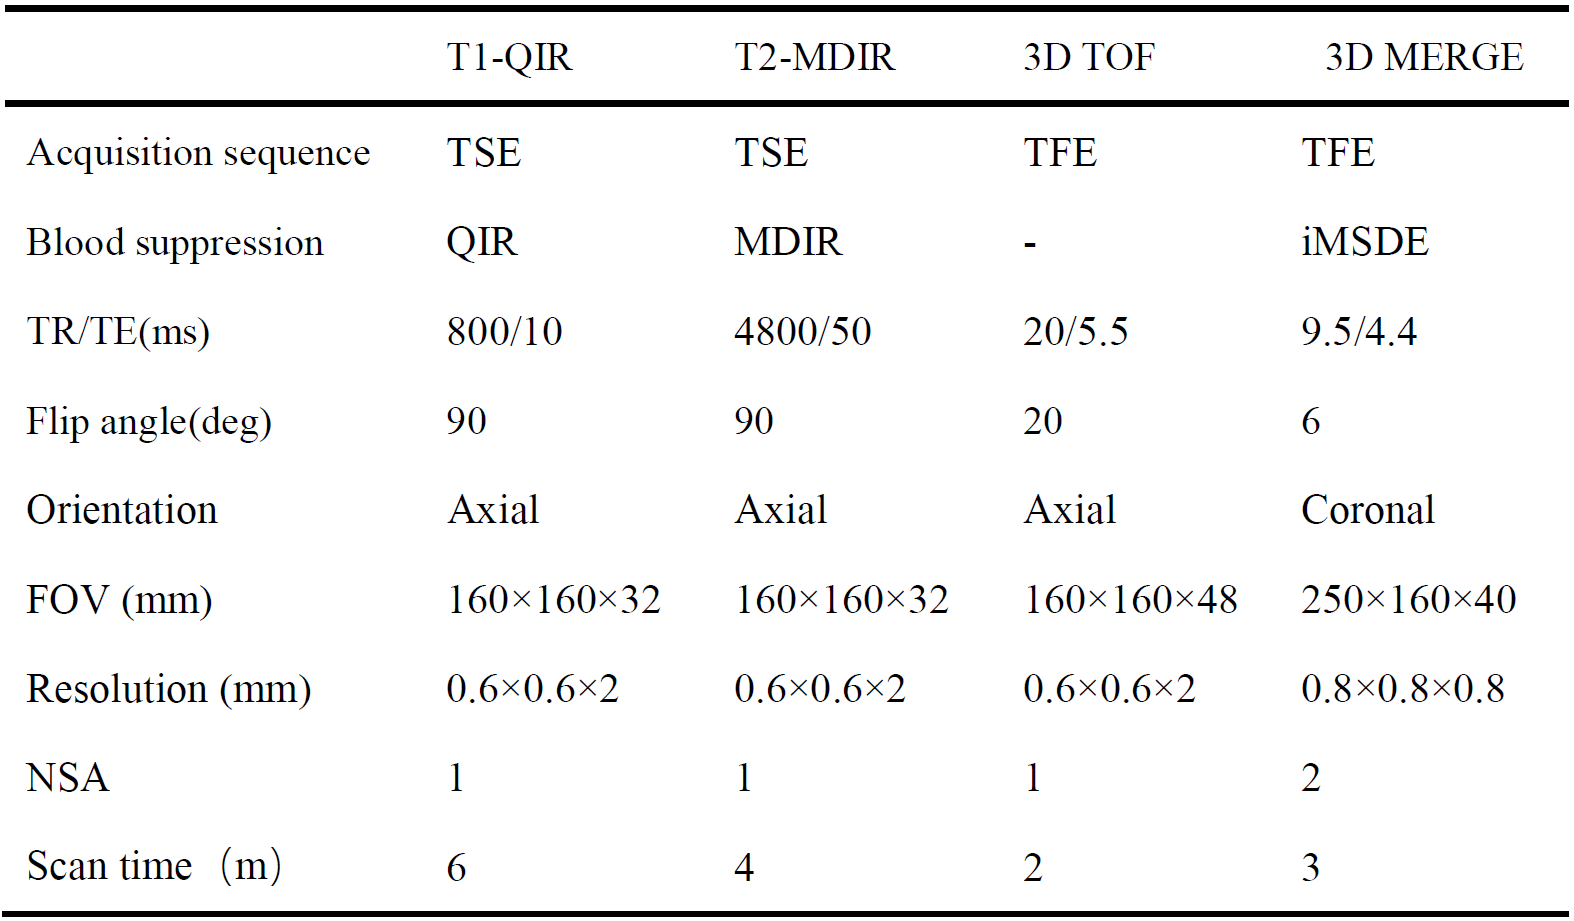
Table 1. MR imaging protocol for multi-contrast imaging.
TSE, turbo spin echo; FFE, fast field echo; DANTE, delay alternating with nutation for tailored excitation; PSIR, phase inversion recovery; iMSDE, improved motion-sensitized driven-equilibrium.
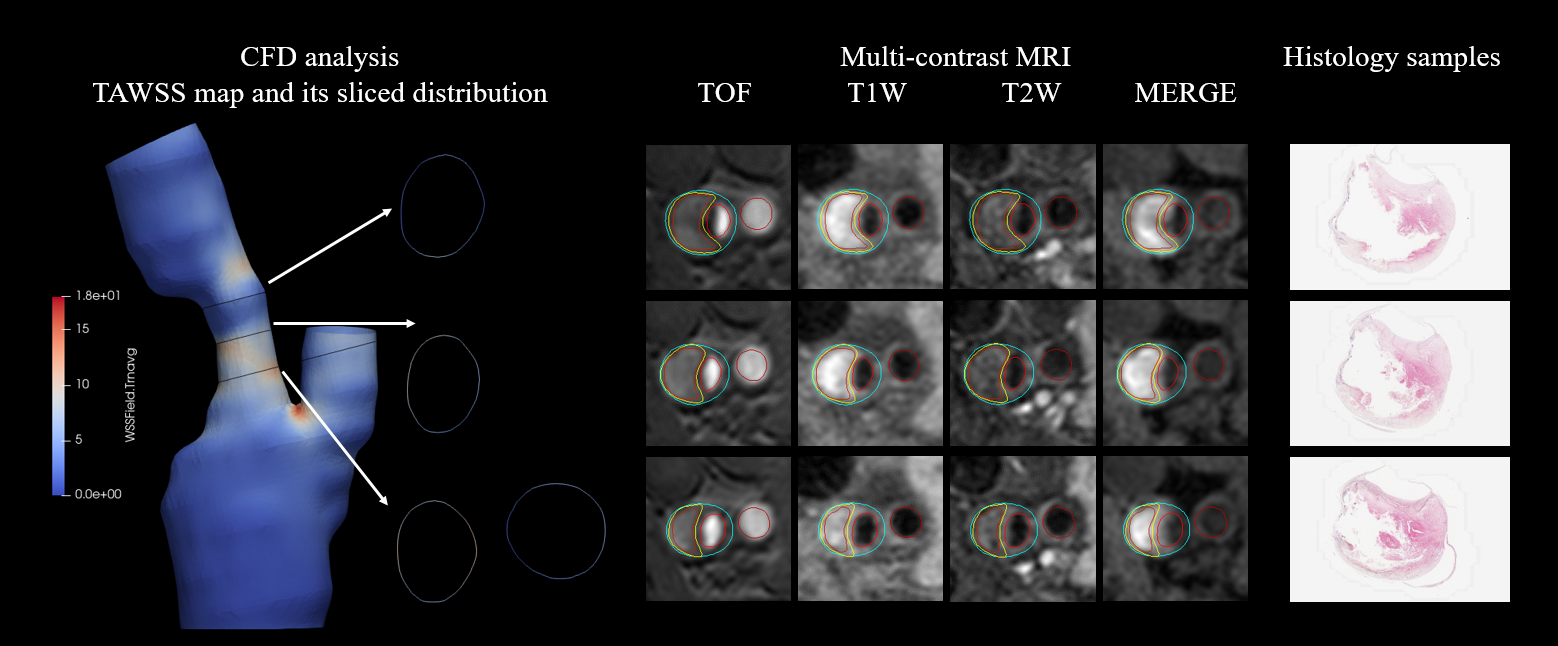
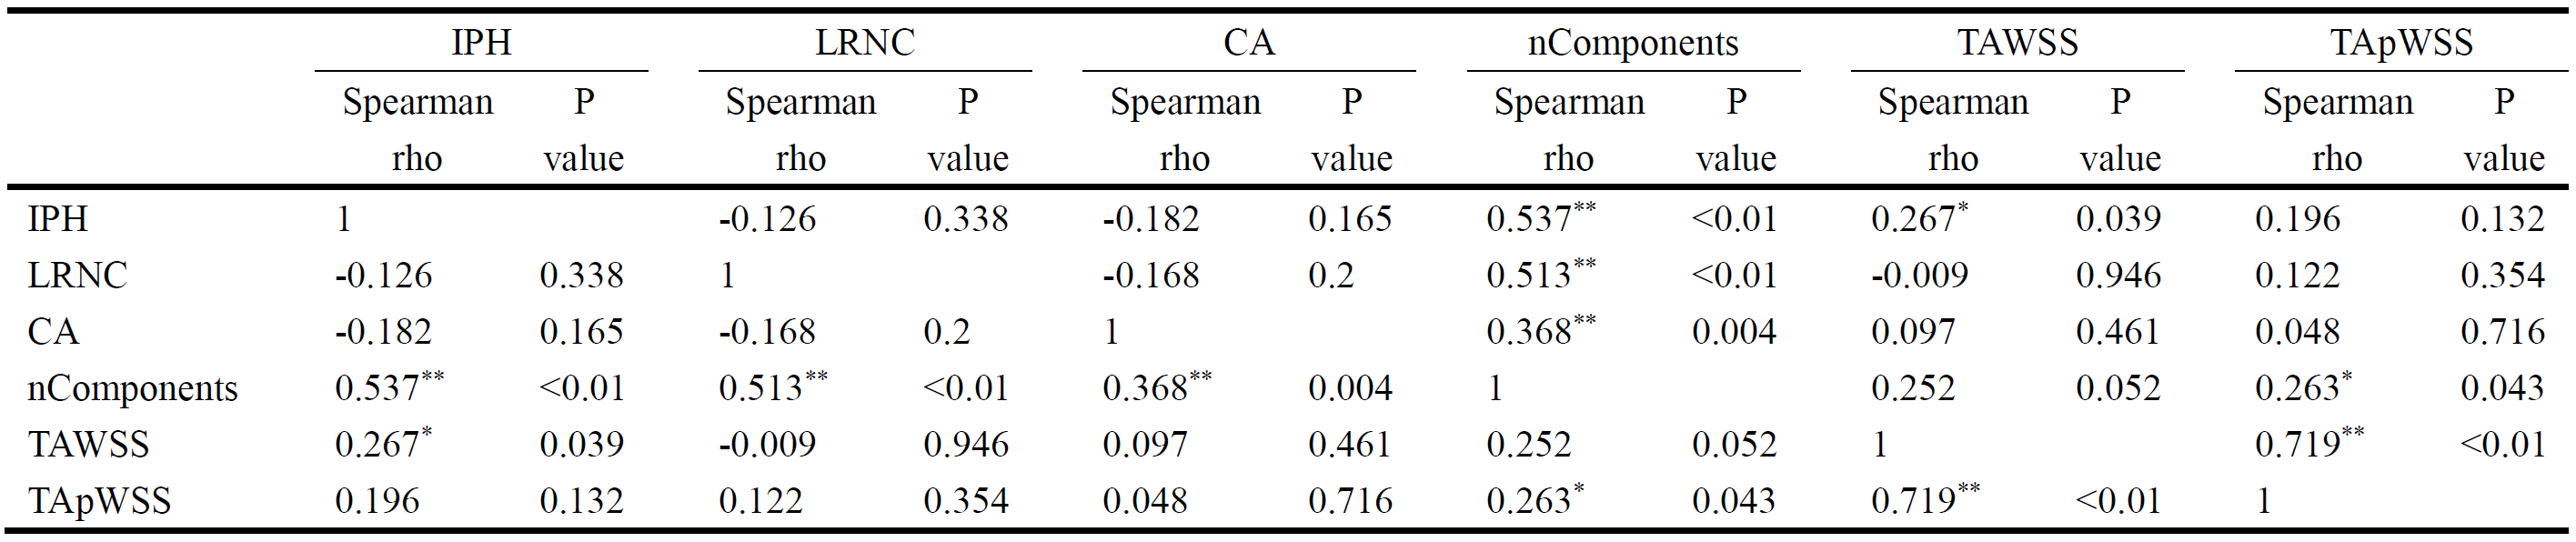
Table 2. Correlation between plaque components and CFD analytical parameters.
IPH, intra-plaque hemorrhage; LRNC, lipid necrotic core; CA, calcification; TAWSS, time-averaged wall shear stress; TApWSS, time-averaged value of peak wall shear stress.
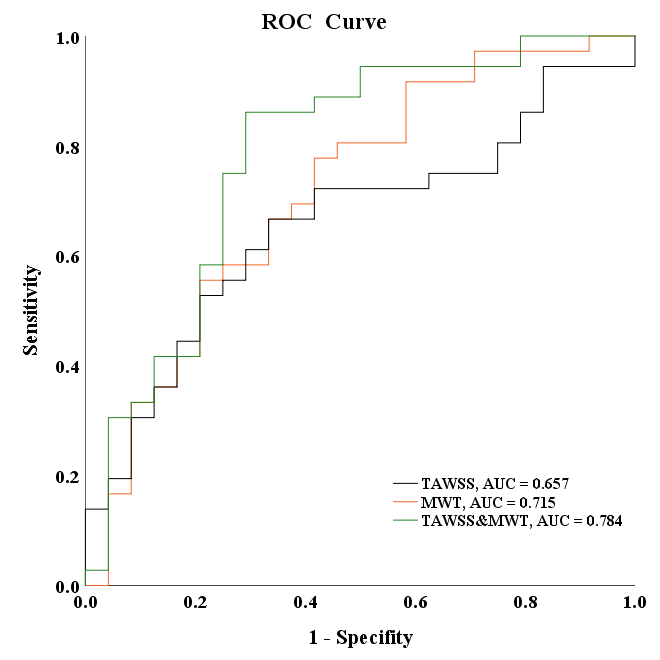
Figure 2. ROC curves of TAWSS combined with max wall thickness (MWT) and normal wall index (NWI) in discriminating IPH.
(The black line represents the ROC curves for predicting IPH with TAWSS. The orange and green lines represent the ROC curves for predicting IPH with TAWSS of combined MWT and of combined NWI.)