3615
Clinical validation of a dedicated motion correction algorithm for cardiac MOLLI series using a quantitative metric1GE Healthcare, Barcelona, Spain, 2Universitat de Barcelona, Barcelona, Spain, 3Hospital Clínic de Barcelona, Barcelona, Spain
Synopsis
Cardiac T1-mapping methods often require motion correction. The contrast changes intrinsic to the inversion recovery series often used for this purpose can occasionally cause registration errors, resulting in inaccurate T1 values. It has been shown, using a large database of clinical cases, that accounting for those contrast changes markedly increases the robustness of the correction. A new metric of cardiac anatomy alignment had to be defined, in order to automate the quantitative analysis of the database. This metric was shown to correlate with the visual scoring of misalignment in MOLLI series.
Introduction
Myocardial tissue T1 constitutes a reliable indicator of heart diseases related to extracellular changes (oedema, fibrosis, etc.) as well as fat, iron and amyloid content1,2. Quantitative T1 mapping delivers repeatable, objective diagnostic criteria based on non-invasive tissue characterization.T1-mapping is typically achieved by exponential fitting of a series of inversion or saturation recovery measurements. Good anatomical alignment between these measurements is essential for accurate T1 estimation. In practice, however, this alignment is limited by such factors as patient motion and gating accuracy.
Post-reconstruction image registration is usually applied to improve alignment. However, in the case of inversion recovery sequences3, registration is compromised by the intrinsic contrast variation between frames.
We present the evaluation of a dedicated motion correction method for MOLLI series, on a large database of cardiac clinical cases. To automate the quantitative analysis of registration results, a custom metric was defined and validated.
Methods
A cohort of 186 patients (115 M / 71 F; weight 75±15 Kg; age 55±16), referred for a clinically indicated cardiac scan, was included in this study. Scans were performed on a 3.0T GE Signa Architect at Hospital Clínic (Barcelona). The acquisition protocol included one or more MOLLI sequences, with target parameters: 2D bSSFP, 160x148, pFOV 0.8-1.0, 1.4x1.4mm², ST 8mm, TE 1.4ms, TR 3.0ms, FA 35deg, NEX 1, BW 100kHz, 2x ASSET, 5(3s)3, Body 48.Three reconstruction methods were applied retrospectively, prior to T1 mapping: Standard Cartesian reconstruction; Cartesian reconstruction with motion correction, as implemented in the scanner; Cartesian reconstruction combined with a new correction algorithm, based on a similarity criterion that accounts for the intensity changes caused by T1 relaxation. The algorithm consisted on an iterative approach, alternating polarity estimation, T1 fitting, relaxation series simulation and frame-by-frame registration.
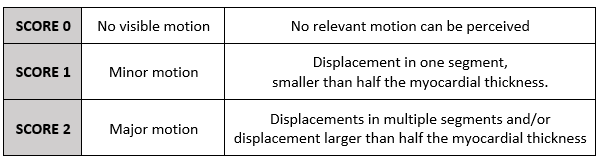
Due to the large number of cases being analyzed, a framework for automated quantitative evaluation had to be implemented. For this purpose, a metric of anatomical alignment was defined as the percentage of cardiac pixels T1 fitting coefficient of determination greater than 95%. This metric was validated by comparison with the qualitative scoring of 200 MOLLI series, using the three-class data alignment scale defined in table 1.
Results
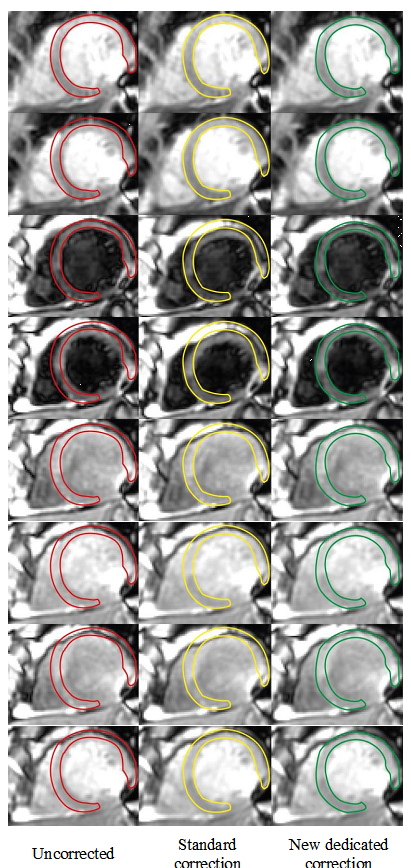
All data were successfully reconstructed, resulting in a total of 1133 MOLLI series for each method. A representative example is shown in figure 1. Series were independently analysed and T1 maps automatically generated.On average, the percentage of cardiac pixels showing good T1 fit (R²>0.95) went up from 85%±9% with standard motion correction to 90%±7% with the dedicated method. In comparison to uncorrected series, the percentage improved by +3%±8% with standard motion correction and by +9%±8% with the dedicated correction.
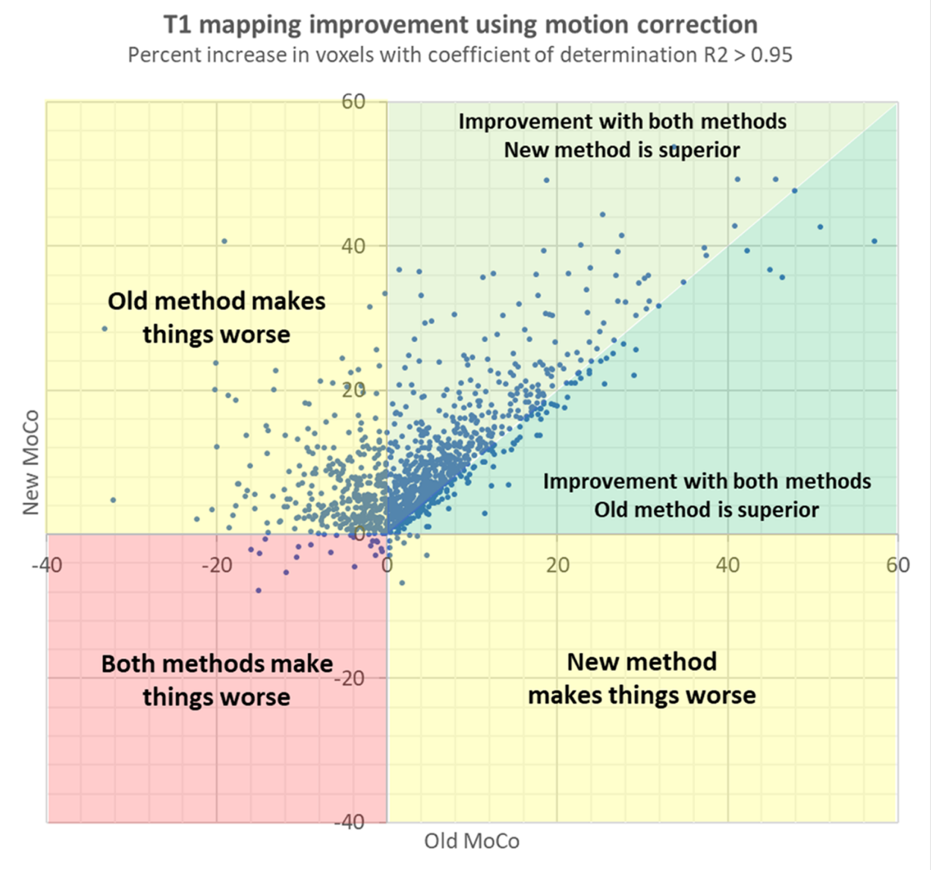
The new similarity criterion was found to limit the incidence of registration failures, defined as those cases where motion correction decreased alignment by 5% or more. Failures went down to 0.3% of cases with the new method, compared to 12% with standard motion correction. The relative performance of the different methods can be appreciated in figure 2.
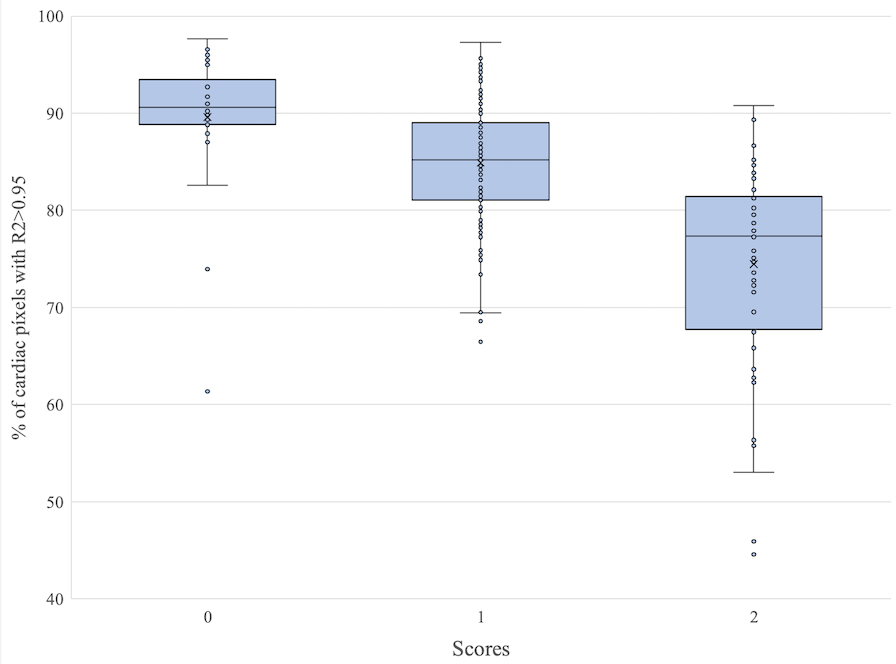
The results of the qualitative analysis are shown in figure 3. The mean value for each of the three alignment classes was, respectively: 90%±7%, 85%±7% and 75%±11%. These were found to be statistically significant with P<10-2.
Discussion
Cardiac T1 mapping is a valuable and widely accepted diagnostic tool, but remains sensitive to patient motion and triggering inaccuracies, being particularly vulnerable to arrhythmia episodes. Multiple instances of misalignment leading to partially inaccurate T1 maps were identified in the database collected for this study.In clinical practice, the orientation and parameters of MOLLI acquisitions for T1 mapping vary greatly, depending on factors such as patient condition, use of contrast agents, etc. Similarly, image quality is strongly dependent on patient condition and compliance. For this reason, this study aimed at evaluating our motion correction on a large, representative set of clinical cases.
The results of the quantitative evaluation show that accounting in the similarity criterion for the contrast changes caused by inversion recovery markedly decreases registration failures. The validity of the alignment metric used for this purpose was confirmed by the results of the qualitative analysis.
Conclusion
A dedicated motion correction method for cardiac MOLLI series has been evaluated on a large clinical database, demonstrating increased robustness. Quantitative measurements have been automatically extracted using a metric designed to reflect the impact of anatomical alignment on cardiac T1 maps. This metric has been validated by comparison with the qualitative ranking of a subset of the available datasets.Acknowledgements
No acknowledgement found.References
1. Jellis, C. L. & Kwon, D. H. Myocardial T1 mapping: modalities and clinical applications. Cardiovasc Diagn Ther 4, 126–137 (2014).
2. Radenkovic, D., Weingärtner, S., Ricketts, L., Moon, J. C. & Captur, G. T1 mapping in cardiac MRI. Heart Fail Rev 22, 415–430 (2017).
3. Messroghli, D. R. et al. Modified Look-Locker inversion recovery (MOLLI) for high-resolution T1 mapping of the heart. Magn Reson Med 52, 141–146 (2004).
Figures