3613
Myocardial tissue characterization by T2 mapping in thalassemia major1MRI Unit, Fondazione G. Monasterio CNR-Regione Toscana, Pisa, Italy, 2Università degli Studi di Pisa, Pisa, Italy, 3Presidio Ospedaliero "Giovanni Paolo II" - Distretto AG2 di Sciacca, Sciacca (AG), Italy, 4Ospedale San Martino di Oristano, Oristano, Italy, 5Azienda Ospedaliero - Universitaria Careggi, Firenze, Italy, 6Policlinico S. Orsola "L. e A. Seragnoli", Bologna, Italy, 7Ospedale "San Donato", Arezzo, Italy
Synopsis
The T2 mapping does not offer any advantage over the T2* technique in terms of sensitivity for myocardial iron overload assessment. However, more than half of patients with thalassemia major had an increased T2 value, that may be caused by the presence of myocardial inflammation and/or edema.
Introduction
The presence of iron deposits results in a significant reduction in all magnetic resonance imaging (MRI) relaxation times (T1, T2 and T2*).1 In the clinical setting the T2* technique is the method of choice for cardiac iron quantification and it has revolutionized the management of patients with hemoglopinopathies.2We aimed to compare myocardial T2 against T2* in patients with thalassemia major (TM) for myocardial iron characterization.
Methods
133 TM patients (79 females, 38.4±11.3 years) enrolled in the Extension Myocardial Iron Overload in Thalassemia (eMIOT) Network were considered.T2 and T2* images were acquired, respectively, with multi-echo fast-spin-echo and gradient-echo sequences.3 Global heart T2 and T2* values were obtained by averaging the values in all 16 myocardial segments.
The normal T2 range was established as mean±2 standard deviations on data acquired on 80 healthy volunteers (males: 48-56 ms and females: 50-57 ms). The lower limit of normal for global heart T2*, established on the same healthy population, was 32 ms.
Results
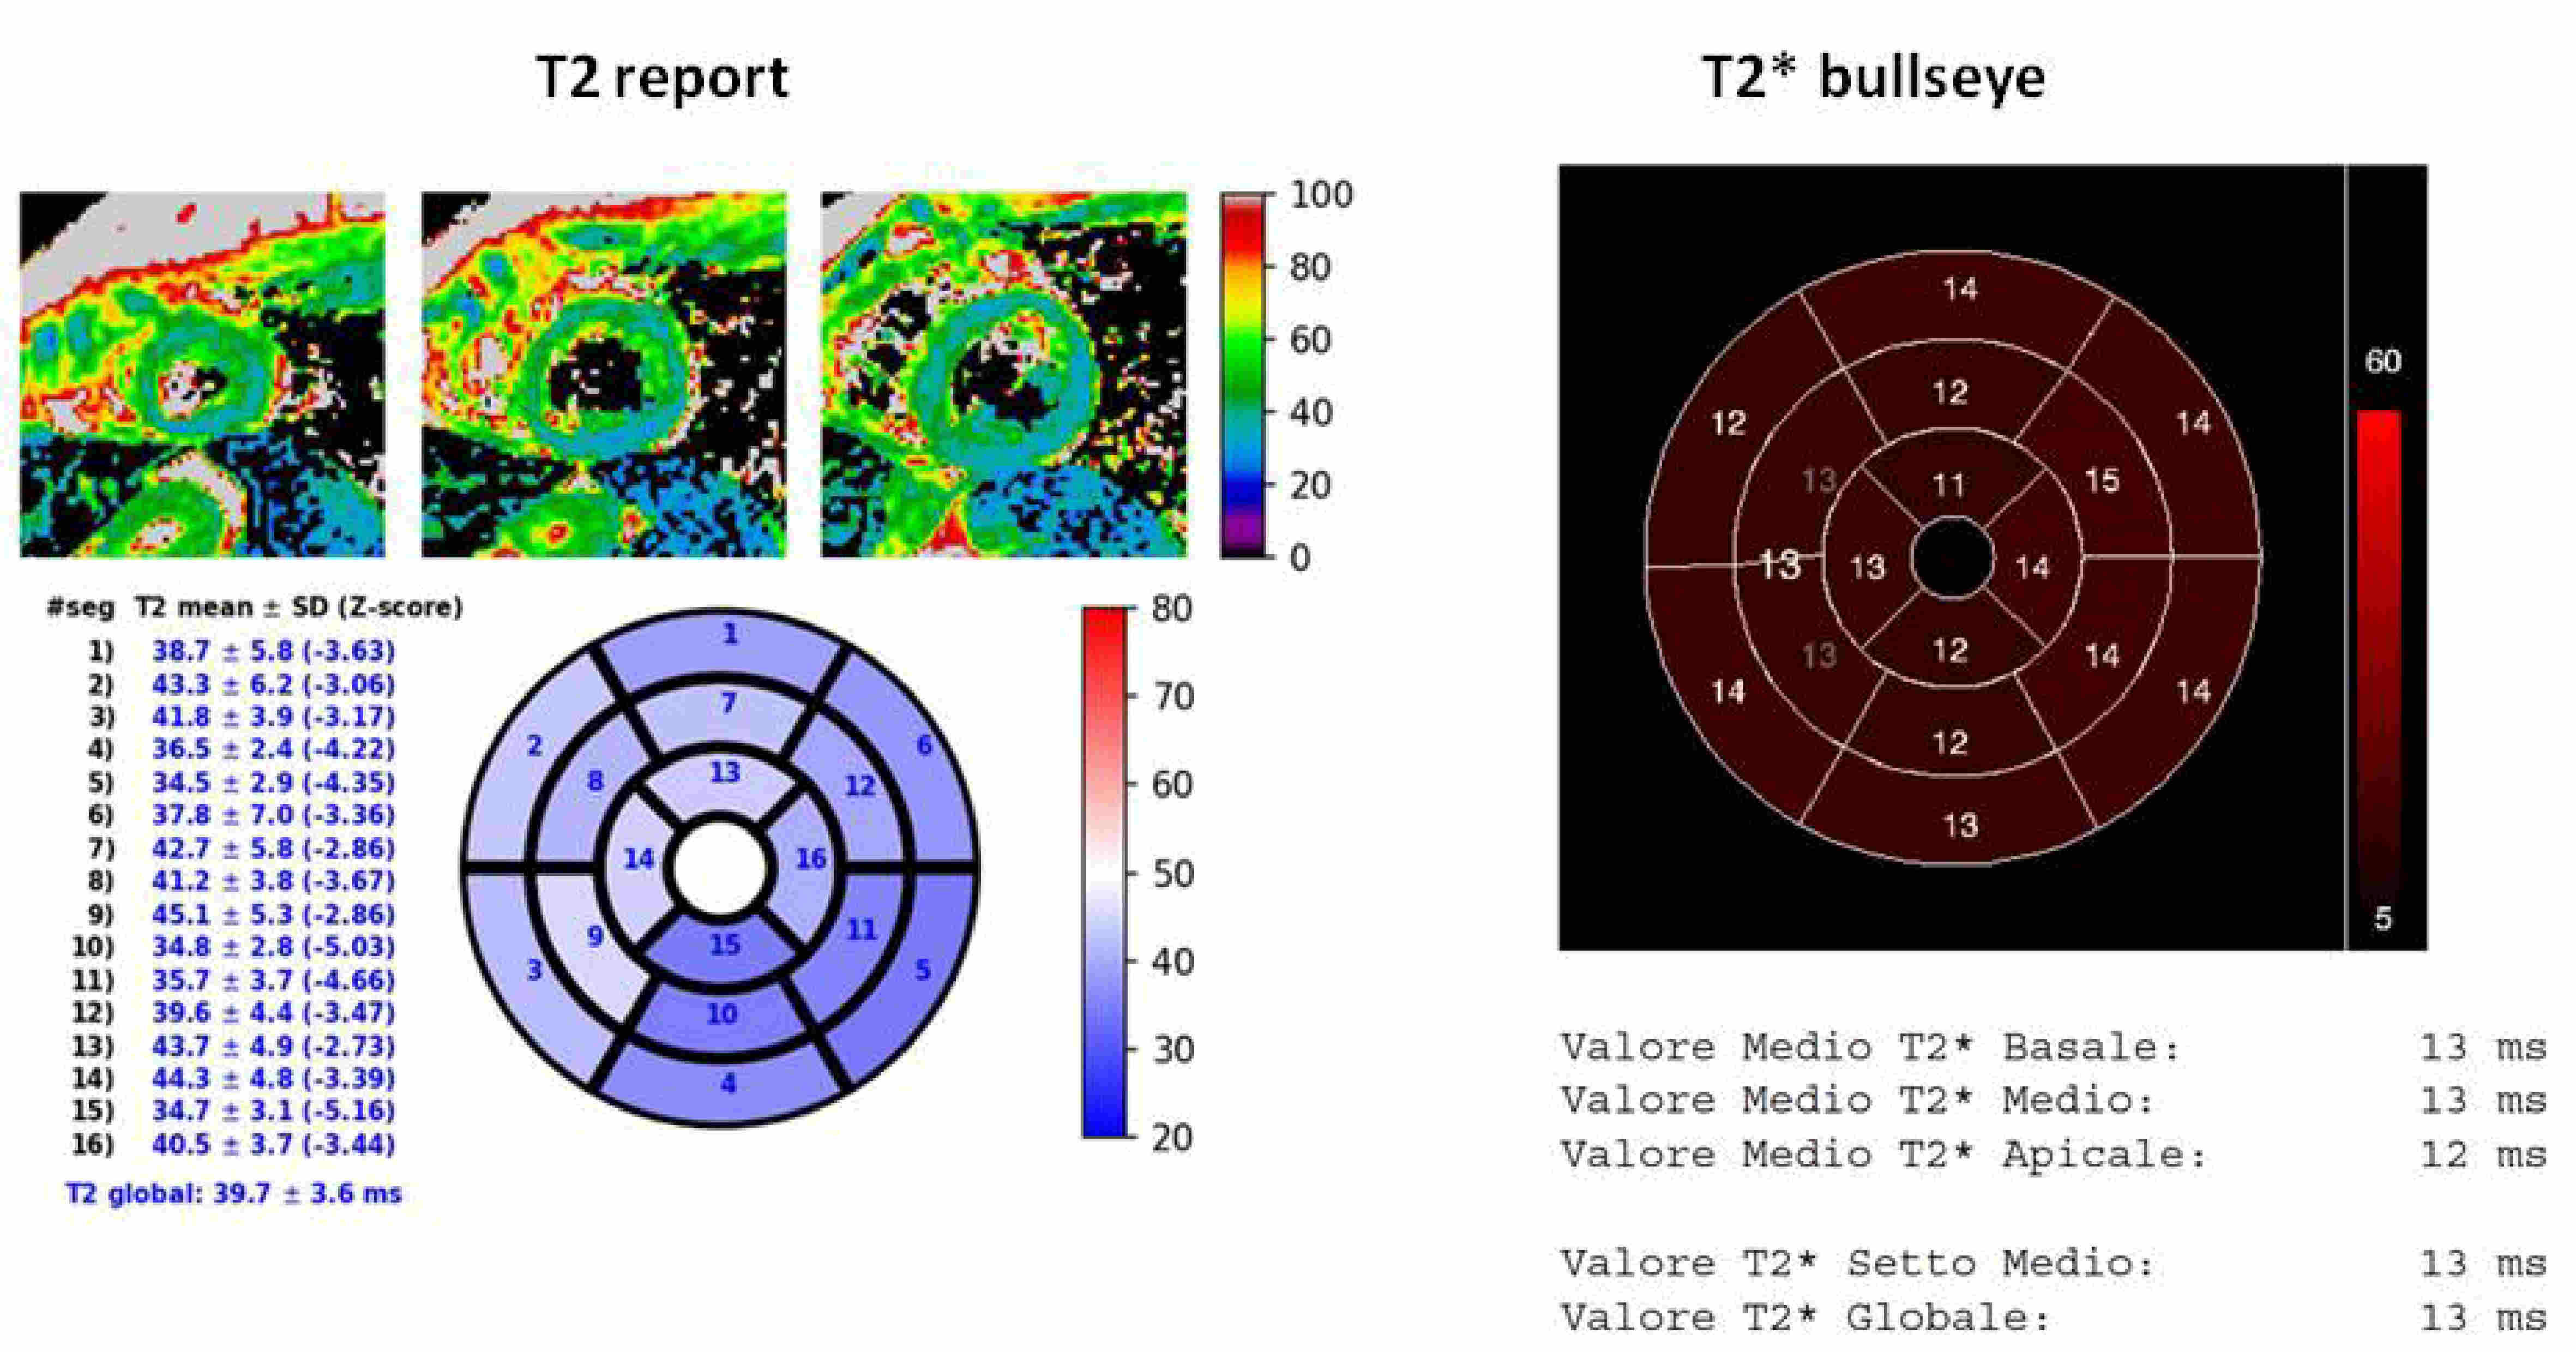
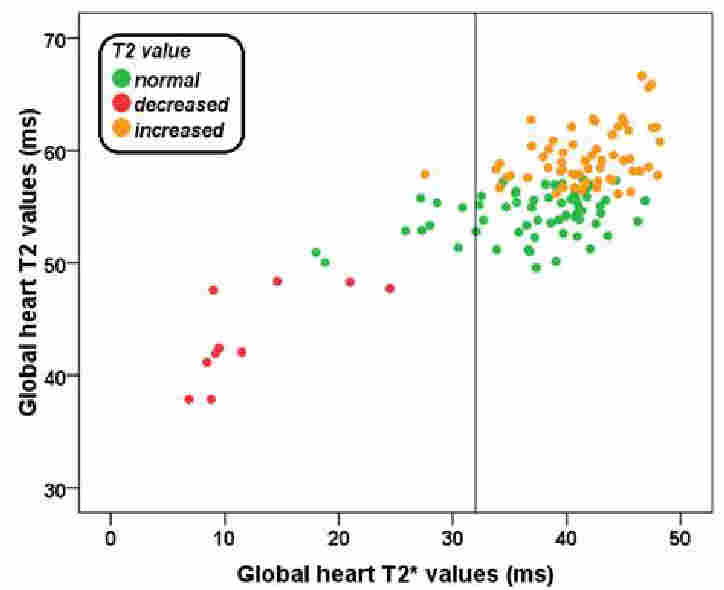
Figure 1 shows an example of T2 and T2* reports for one patient with both reduced global heart T2 and T2* values.A significant correlation was detected between global heart T2 and T2* values (R=0.577; P<0.0001) (Figure 2).
Out of the 113 (84.9%) patients with a normal global heart T2* value, none had a decreased global heart T2 value, while 58 (51.3%) had an increased T2 value. Out of the 20 patents with a decreased global heart T2* value, only 10 (50%) had also a reduced T2 value. Conversely, 9 (45.0%) had a normal global heart T2 value and one (4.5) showed an increased T2 value.
The 59 patients with increased global heart T2 value were significantly older than the remaining patients (40.8±10.5 vs 36.4±11.6 years; P=0.019)
Conclusions
All patients with decreased T2 value had also a decreased T2* value and in half of the patients iron load was undetected by T2, suggesting that T2 mapping does not offer any advantage in terms of sensitivity for MIO assessment. However, more than half of TM patients had an increased T2 value, that may be caused by the presence of myocardial inflammation and/or edema. So, T2 mapping could reveal subclinical myocardial involvement in TM patients.Acknowledgements
We would like to thank all the colleagues involved in the E-MIOT project (https://emiot.ftgm.it/). We thank Claudia Santarlasci for her skillful secretarial work and all patients for their cooperation.References
1. Wood JC, Otto-Duessel M, Aguilar M, et al. Cardiac iron determines cardiac T2*, T2, and T1 in the gerbil model of iron cardiomyopathy. Circulation 2005;112(4):535-543.
2. Pennell DJ, Udelson JE, Arai AE, et al. Cardiovascular function and treatment in beta-thalassemia major: a consensus statement from the American Heart Association. Circulation 2013;128(3):281-308.
3. Meloni A, Positano V, Pepe A, et al. Preferential patterns of myocardial iron overload by multislice multiecho T*2 CMR in thalassemia major patients. Magn Reson Med 2010;64(1):211-219.
Figures