3611
Visualization of Coronary Myocardial Chemoablation: Comparison of Ethanol and Acetic Acid1NHLBI, Division of Intramural Research, National Institutes of Health, Bethesda, MD, United States, 2Biophysics and Biochemistry Branch, Division of Intramural Research, NHLBI, NIH, Bethesda, MD, United States, 3Division of Cardiology, Department of Medicine, Johns Hopkins University School of Medicine, Baltimore, MD, United States, 4Department of Cardiology, Medstar Washington Hospital Center, Washington, DC, United States
Synopsis
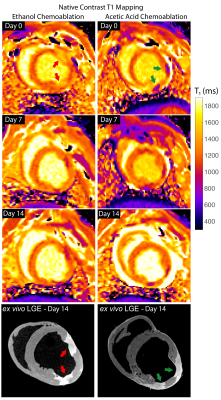
In this work, we visualize chemoablation lesions created by intracoronary injection as used in alcohol septal ablation for the treatment of hypertrophic obstructive cardiomyopathy. 3D native contrast and gadolinium-enhanced MRI were examined. Two chemoablation agents were used: standard ethanol and a potential alternative agent, glacial acetic acid. In swine, both 3D native contrast and gadolinium-enhanced imaging clearly delineated lesion extent acutely and up to two weeks post ablation. Acutely, chemoablation with ethanol induced a 22% increase in T1 within lesion cores and acetic acid yielded a 36% decrease.
Introduction
Alcohol septal ablation is a one of the therapies used for septal wall debulking in symptomatic drug-refractory hypertrophic obstructive cardiomyopathy(HOCM).(1) The technique involves the injection a small amount of desiccated alcohol into an appropriate septal perforator artery, which results in myocardial necrosis and scarring, subsequent septal shrinking, and ultimately in the reduction of the pressure gradient across the outflow tract of the left ventricle and symptomatic relief. (2-4) Previous work has demonstrated the use of CMR assessment in pre- post-septal ablation using 2D techniques including cine and late gadolinium enhancement (e.g.(5)). To our knowledge, the potential benefits of visualization of post-septal ablation lesions taking advantage of 3D imaging techniques or using native T1-weighted and T2-weighted imaging have not been assessed. Hence, in this work we visualize chemoablation by intracoronary injection with MRI using both ethanol and a potential alternative agent, glacial acetic acid.Methods
As approved by the local IACUC, N=4 swine underwent intracoronary chemoablation under X-ray guidance. Each animal received two 0.5-1 ml injections of either 50% glacial acetic acid diluted with saline or 100% ethanol. Obtuse marginal and diagonal arteries were selected and occluded with an angiography balloon. Agents were infused through the balloon guidewire lumen. Balloon inflation was maintained for 3 min to prevent backflow. Animals were imaged on days 0, 7 and one final time at 2 weeks post ablation (10-14 days) before sacrifice and ex-vivo MRI.Imaging was performed at 1.5 T (Aera, Siemens Healthineers) using standard body arrays. Ex-vivo MRI was performed in using a 32-channel head coil. In-vivo 3D imaging included: bright-blood T2-weighted spoiled gradient echo (SPGR) with T2-preparation (T2Prep TE=45ms), (6) native contrast 3D T1-weighted inversion recovery (IR) imaging with a long inversion time (TI=900ms) and 2RR triggering, (7-9) and 3D late gadolinium enhancement (LGE, 0.2 ml/kg, Gadavist, Bayer). In addition, 2D breath-hold T1 mapping was carried out with a modified version of saturation recovery single-shot acquisition (SASHA), (10) to determine changes in T1.
High-resolution ex-vivo LGE MRI was carried out on immediately after excision and included an additional dose of gadolinium-based agent. Tissues were preserved for histological analysis including large-format H&E and Perls DAB stain for iron to correlate imaging with lesion extent.
Results
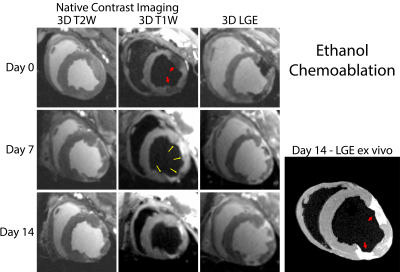
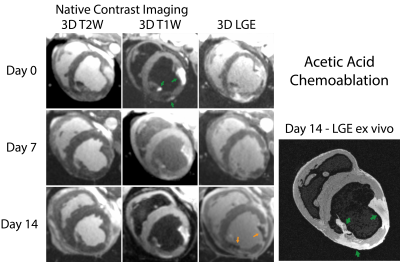
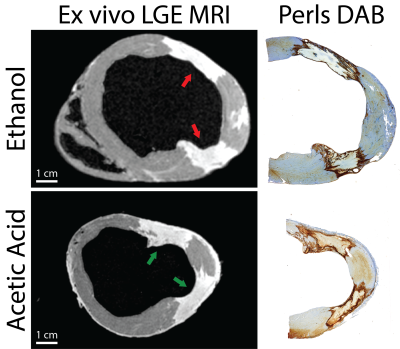
Lesions were well visualized in all animals. In general, ethanol-based ablation resulted in more heterogeneous signal from ablation lesions. Figures 1 and 2 display T2-W, T1-W and LGE images from all three time points for alcohol and acetic acid chemoablation, respectively. Figure 3 displays the results of T1 mapping from all three time points. Figure 4 displays the comparison of scar observed 2 weeks post ablation with histology to assess the extent if necrosis.Discussion
The extent of intracoronary chemoablation lesions was well visualized on the day of ablation up to two weeks after by 3D imaging techniques. For ethanol chemoablation lesions (Fig. 1), T1-W imaging and LGE both depicted significant hypointensity on the day of ablation. After, both T1-W and T2-W imaging and LGE showed well circumscribed lesions that correlated well with ex-vivo imaging and histology. On Day 0, LGE exhibited more heterogeneous signal intensities likely due to microvascular obstruction (i.e. lack of contrast agent within lesion) as well as likely peripheral edema.For acetic acid chemoablation lesions (Fig. 2), T1-W displayed significant enhancement of lesion cores on Day 0. Due to the use of SPGR, an inherently T1-W imaging sequence, T2-W imaging suffered from cross contamination of signal and did not yield acceptable assessment of lesion extent. For Days 7+, both T1-W imaging and LGE yielded excellent visualization of lesion cores relative to ex-vivo LGE and histology. LGE was able to depict extent of the lesions at all time points and for both chemoablation agents. However, as shown here and previously,(5) the presence of edema acutely can complicate the depiction of the extent of potential necrosis.
Acute assessment of septal chemoablation in the treatment of HOCM could help predict procedural outcome. Previous work has demonstrated that failure of septal chemoablation is related to the actual territory that is ablated, resulting in variable results when the basal septum is spared, and the outflow tract restriction is not addressed (5). T1-W imaging was able to visualize the extent of necrosis from acetic acid chemoablation acutely and without exogenous agents. This could be important for post-procedural assessment of septal chemoablation, which, unlike surgical myectomy, does not result in immediate reduction of the pressure gradient observed in the outflow tract that is associated with symptoms. The native T1 contrast generated by acetic acid chemoablation potentially makes it a better agent for septal ablation to be assessed by MRI, and though the mechanism of is currently unknown, it and merits further study.
Conclusion
This work demonstrates that visualization of intracoronary chemoablation lesions with 3D MRI is feasible and can assess the extent of necrosis with both ethanol and acetic acid chemoablation. Both native contrast imaging and LGE were able to visualize extent of injury. Interestingly, only acetic acid chemoablation produced a significant T1 shortening, resulting in acute enhancement on T1-W imaging. Hence, acetic acid septal ablation could be an acceptable alternative to standard alcohol septal ablation without the need for exogenous contrast agents.Acknowledgements
We are grateful to Katherine Lucas from the NHLBI Division of Intramural Research Animal Surgery and Resources Core for their talented assistance with in vivo experiments.References
1. Veselka J, Anavekar NS, Charron P. Hypertrophic obstructive cardiomyopathy. Lancet. 2017;389(10075):1253-67.2. Jensen MK, Prinz C, Horstkotte D, van Buuren F, Bitter T, Faber L, et al. Alcohol septal ablation in patients with hypertrophic obstructive cardiomyopathy: low incidence of sudden cardiac death and reduced risk profile. Heart. 2013;99(14):1012-7.
3. Sigwart U. Non-surgical myocardial reduction for hypertrophic obstructive cardiomyopathy. Lancet. 1995;346(8969):211-4.
4. Sorajja P, Ommen SR, Holmes DR, Jr., Dearani JA, Rihal CS, Gersh BJ, et al. Survival after alcohol septal ablation for obstructive hypertrophic cardiomyopathy. Circulation. 2012;126(20):2374-80.
5. Valeti US, Nishimura RA, Holmes DR, Araoz PA, Glockner JF, Breen JF, et al. Comparison of surgical septal myectomy and alcohol septal ablation with cardiac magnetic resonance imaging in patients with hypertrophic obstructive cardiomyopathy. J Am Coll Cardiol. 2007;49(3):350-7.
6. Brittain JH, Hu BS, Wright GA, Meyer CH, Macovski A, Nishimura DG. Coronary angiography with magnetization-prepared T2 contrast. Magn Reson Med. 1995;33(5):689-96.
7. Guttman MA, Tao S, Fink S, Kolandaivelu A, Halperin HR, Herzka DA. Non-contrast-enhanced T1 -weighted MRI of myocardial radiofrequency ablation lesions. Magn Reson Med. 2018;79(2):879-89.
8. Tao S, Guttman MA, Fink S, Elahi H, Patil KD, Ashikaga H, et al. Ablation Lesion Characterization in Scarred Substrate Assessed Using Cardiac Magnetic Resonance. JACC Clin Electrophysiol. 2019;5(1):91-100.
9. Guttman MA, Tao S, Fink S, Tunin R, Schmidt EJ, Herzka DA, et al. Acute enhancement of necrotic radio-frequency ablation lesions in left atrium and pulmonary vein ostia in swine model with non-contrast-enhanced T1 -weighted MRI. Magn Reson Med. 2020;83(4):1368-79.
10. Chow K, Flewitt JA, Green JD, Pagano JJ, Friedrich MG, Thompson RB. Saturation recovery single-shot acquisition (SASHA) for myocardial T(1) mapping. Magn Reson Med. 2014;71(6):2082-95.
Figures


