3610
Improving T1 mapping robustness by automatic segmentation of myocardial tissue in MOLLI series1Universitat Pompeu Fabra, Barcelona, Spain, 2Hospital Clínic de Barcelona, Barcelona, Spain, 3GE Healthcare, Barcelona, Spain
Synopsis
In this study, an image processing pipeline based on Deep Learning is presented to identify myocardial tissue in MOLLI series. The main goal is to provide an automated tool to evaluate the impact of motion correction on cardiac T1 mapping.
Introduction
Myocardial T1 values have been shown to correlate with changes in tissue properties, such as extracellular water, fat and amyloid content. Therefore, T1 mapping can be a powerful tool in the diagnosis and prognosis of different cardiovascular conditions (oedema, fibrosis, …)1,2.Cardiac T1 mapping with MOLLI sequences3 requires accurate registration between the measurements, performing motion correction when needed. Otherwise, the estimated T1 values could be wrong, leading to misdiagnosis4.
It would be desirable to implement a metric reflecting the anatomical alignment of the MOLLI data and its impact on T1 mapping. Furthermore, this metric should be restricted to the region of diagnostic interest, the heart.
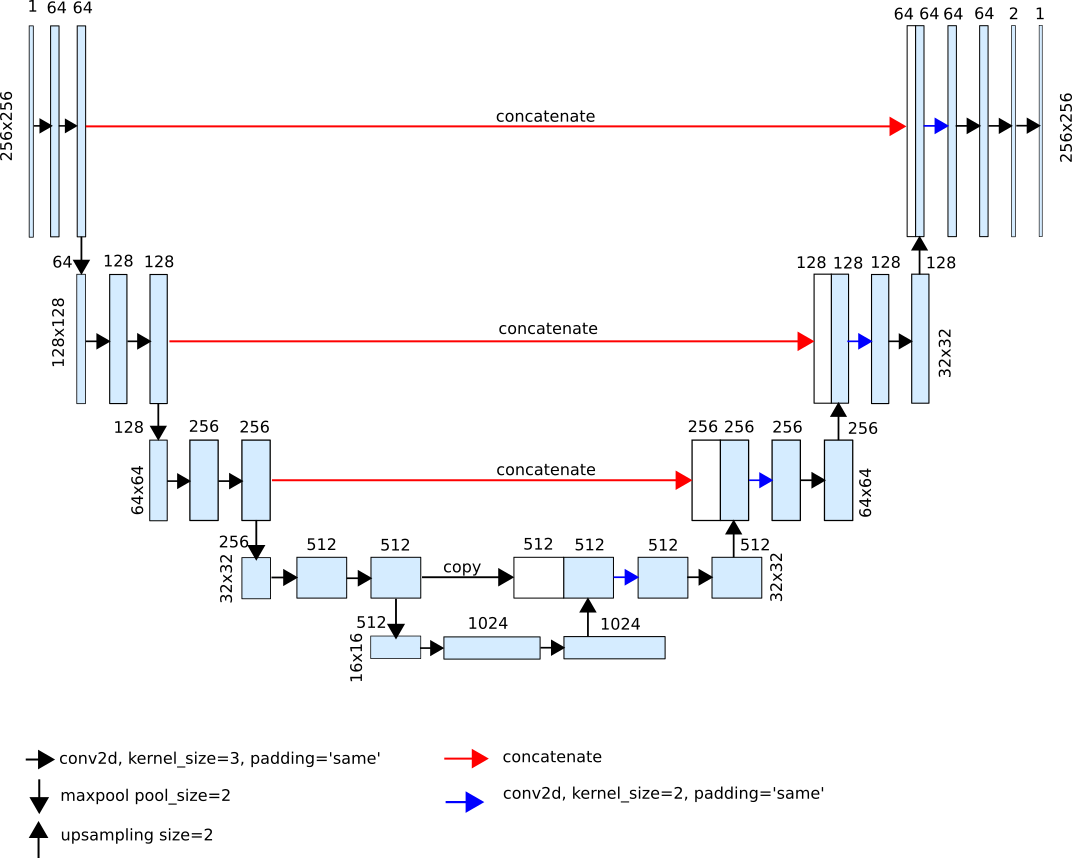
In the present study, the region of interest is automatically identified with a combination of two U-net convolutional neural networks (CNN)5,6: An initial network to extract the whole heart mask; and a subsequent one to detect the blood pool.
Methods
A cohort of 186 patients (115M/71F; weight 75±15Kg; age 55±16), referred for a clinically indicated cardiac scan, was included in this study. Scans were performed on a 3.0T GE Signa Architect. The acquisition protocol included T1 mapping MOLLI sequences: 2D bSSFP, 160x148, 1.4x1.4mm², ST 8mm, TR 3.0ms, FA 35deg, NEX 1, BW 100kHz, 2x ASSET, 5(3s)3.The code was developed in Python, with Tensorflow and Keras. The pipeline for obtaining both masks (whole heart and blood pool) was the same, only changing the ground truth for training in each case.
The network architecture, based on the U-net, is shown in Figure 1. For model training, binary cross entropy was selected as loss function, with ADAM as optimizer. As pre-processing, images were normalized based on the soft tissue histogram peak.
Manually segmented MOLLI frames (n=1137) were used to train the model (90% train, 10% test). Data augmentation was carried out on-the-fly. A post-processing based on connected component analysis was applied to eliminate regions outside the heart.
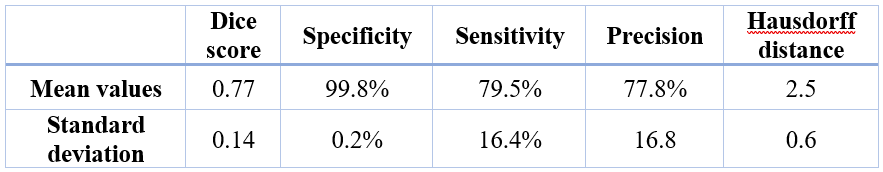
The evaluation of the results was done with Dice score, specificity, sensitivity, precision and Hausdorff distance, as well as qualitatively.
Results
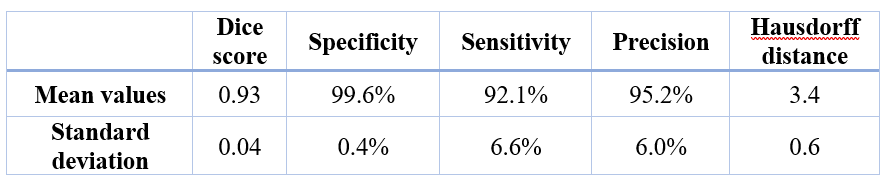
The evaluation metrics obtained for the whole heart and blood pool segmentations are shown in Table 1 and Table 2, respectively.On average, it takes 0.13 seconds to infer the segmentation of an image (including the post-processing step) when run with NVIDIA GTX 1050 GPU.
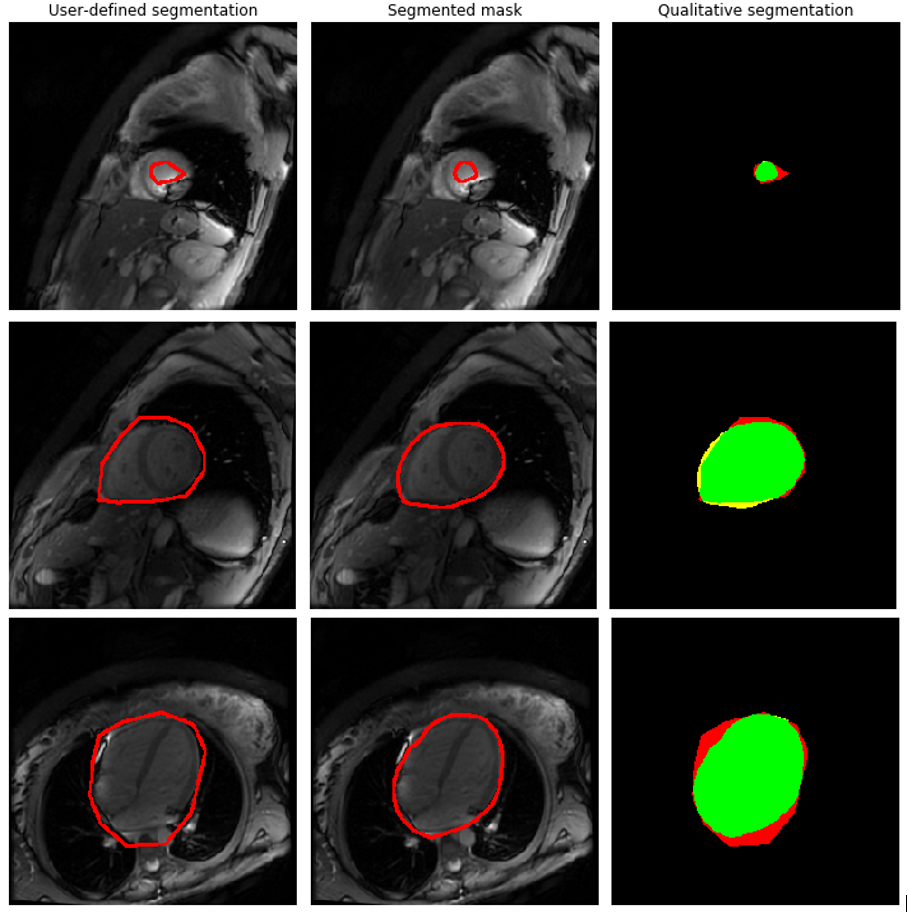
To asses qualitatively the obtained results, Figure 2 shows representative inferred heart and blood pool masks, with their corresponding user-defined masks, and a color-coded representation of over-, under- and correct segmentation. Notice how the inferred masks are closer to the actual heart than those used to train the model, which are user-defined and intentionally coarse.
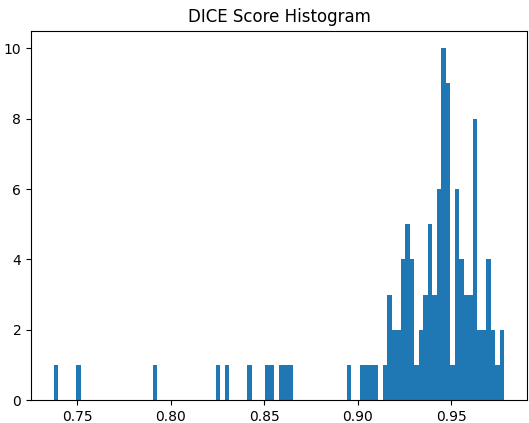
Finally, a histogram of the Dice scores between the ground truth and the generated masks of the whole heart is provided in Figure 3.
Discussion
There is a need to quantify the impact of motion correction on T1 mapping accuracy. To increase its clinical relevance, the measurement should be focused on the cardiac region of interest. Since manual segmentation can be tedious and time-consuming, automatic segmentation would be ideal.From the evaluation metrics, it can be concluded that the segmentation goal has been successfully achieved. However, although the heart masks obtained are good enough for the proposed problem, they could be further improved by training separately pre- and post-contrast images, since most of the segmentations that obtained poor Dice scores are post-contrast images.
Regarding the performance of blood pool segmentations, it should be further improved by optimizing the input frame derived from the MOLLI series to increase blood-to-myocardium contrast.
Conclusion
In the present study, a pipeline for myocardial segmentation from MOLLI sequences was successfully implemented and tested, to enable the implementation of an automated anatomical alignment metric over this region of interest.Acknowledgements
No acknowledgement found.References
[1] Valentina O. Puntmann, Elif Peker, Y. Chandrashekhar, Eike Nagel. “T1 Mapping in Characterizing Myocardial Disease. A Comprehensive Review”. Circulation Research. 119, 277–299 (2016)
[2] von Knobelsdorff-Brenkenhoff and Schulz-Menger, "Role of Cardiovascular Magnetic Resonance in the Guidelines of the European Society of Cardiology". Journal of Cardiovascular Magnetic Resonance. 18, 6 (2015)
[3] Messroghli et al., “Modified Look-Locker Inversion Recovery (MOLLI) for High-Resolution T1 Mapping of the Heart”. Magn Reson Med 52, 141-6 (2004)
[4] Kellman, P., Herzka, D.A., Arai, A.E. et al. “Influence of Off-resonance in myocardial T1-mapping using SSFP based MOLLI method”. J Cardiovasc Magn Reson 15, 63 (2013)
[5] O. Bernard, A. Lalande, C. Zotti, F. Cervenansky, X. Yang, P.-A. Heng, I. Cetin, K. Lekadir, O. Camara, M. A. G. Ballester, et al., “Deep learning techniques for automatic MRI cardiac multi-structures segmentation and diagnosis: is the problem solved?,” IEEE transactions on medical imaging. 37, 2514–2525 (2018)
[6] O. Ronneberger, P. Fischer, and T. Brox, “U-net: Convolutional networks for biomedical image segmentation,” in International Conference on Medical image computing and computer-assisted intervention, 234–241 (2015)
Figures