3608
Altered T1 and T2 relaxation times in leg muscles are linked to hemodynamic and ambulatory parameters in patients with Peripheral Artery Disease.
Constance J Mietus1, Yue Gao1, Mariano G Uberti2, Nicholas G Lambert1, Panagiotis Koutakis3, Evlampia Papoutsi3, Jonathan R Thompson1, Holly K DeSpiegelaere4, Michael D Boska2, Sara A Myers5, George P Casale1, Iraklis I Pipinos1,4, and Balasrinivasa R Sajja2
1Department of Surgery, University of Nebraska Medical Center, Omaha, NE, United States, 2Department of Radiology, University of Nebraska Medical Center, Omaha, NE, United States, 3Department of Biology, Baylor University, Waco, TX, United States, 4Department of Surgery and VA Research Service, VA Nebraska-Western Iowa Health Care System, Omaha, NE, United States, 5Department of Biomechanics, University of Nebraska Omaha, Omaha, NE, United States
1Department of Surgery, University of Nebraska Medical Center, Omaha, NE, United States, 2Department of Radiology, University of Nebraska Medical Center, Omaha, NE, United States, 3Department of Biology, Baylor University, Waco, TX, United States, 4Department of Surgery and VA Research Service, VA Nebraska-Western Iowa Health Care System, Omaha, NE, United States, 5Department of Biomechanics, University of Nebraska Omaha, Omaha, NE, United States
Synopsis
Understanding the quantitative MRI features of the myopathy of Peripheral Artery Disease (PAD) may aid in grading disease severity, treatment response, and potentially predicting favorable response to exercise or revascularization surgery. In this study we explored the relationship between T1 and T2 relaxation times and measurements of hemodynamic and ambulatory performance in patients with PAD. T1 relaxation time positively correlated with ankle brachial index and peak plantar flexion and inversely correlated with claudication onset time. T2 relaxation time correlated positively with peak plantar flexion and inversely correlated with ischemic window, claudication onset time, and peak walking time.
Background
Peripheral Artery Disease (PAD) is caused by atherosclerotic narrowing of the arteries supplying the legs. PAD produces ischemia and myopathy in the leg muscles in association with severe walking disability. PAD myopathy is characterized by myofiber degeneration, fibrosis, and alterations of microvascular architecture. 1, 2 Quantitative magnetic resonance imaging (qMRI) studies have demonstrated features of large vessel occlusion and diminished perfusion during exercise in PAD legs as compared to healthy controls. 3-5 However, the quantitative imaging characteristics of PAD myopathy and their relationship to hemodynamic and ambulatory parameters remain undefined. In this study, we tested the hypothesis that alterations in T1 and T2 relaxation times are associated with worsening lower extremity hemodynamics and ambulatory restrictions in patients with PAD.Methods
Twenty-three male patients with Fontaine Stage II PAD (age: 65.2 $$$\pm$$$ 5.7 years) were recruited in this study with IRB approval. Hemodynamic parameters (Ankle brachial index (ABI) and ischemic window (IW)) and ambulatory parameters (peak plantar flexion (PPF), claudication onset time (COT) and peak walking time (PWT)) were measured for each patient. MRI exams were performed on a 1.5 T clinical MRI scanner. Data for relaxation times mapping were acquired with the following parameters. Spin echo (SE) with multiple TRs (T1 mapping): TR=200, 500, 1000, and 4000 ms; TE=7 ms; Multi-echo SE (T2 mapping): TR=6500 ms; 16 echoes with TEn = 13 x n (n=1, …16) ms. Common parameters for both the sequences: slices=27; image size=128x128; FOV = 160x160 mm2; slice thickness=3 mm; spacing between slices=3.0 mm; averages = 1. Relaxation times maps were computed with in-house developed computer programs written in Interactive Data Language (IDL; Harris Geospatial Solutions Inc., Broomfield, CO, USA). For ROI analysis, medial gastrocnemius (MG), lateral gastrocnemius (LG), and soleus (SOL) muscle regions were manually drawn on all slices of reference MRI volumes. Masks were translated onto the T1- and T2-map volumes to extract corresponding values from ROIs. The patient’s leg (left vs. right) with the lower ABI was included in the analysis. Mean and standard deviation (SD) of T1 and T2 values from these ROI were calculated. Linear regression analysis was performed to study the correlations between T1 and T2 relaxation times and hemodynamic and ambulatory parameters.Results
Figure 1 shows a representative overlay of ROI (MG, LG, and SOL) on a T2-weighted slice and the corresponding T1 and T2 maps of that cross-section. Mean T1 and T2 values in MG, LG, and SOL muscles are shown in Table 1. Mean and SD of ABI was 0.49 $$$\pm$$$ 0.17. As ABI decreased, T1 values decreased in the MG (R = 0.45, p = 0.03) and SOL (R = 0.46, p = 0.03) (figure 2 (upper panel)). LG showed a similar trend, but was statistically non-significant (p = 0.09). An inverse relationship was observed between IW and T2 relaxation time in the SOL (R = -0.48, p = 0.02) and LG (R = -0.46, p = 0.03), but was non-significant in the MG (figure 2 (lower panel)). As the duration of PPF increased, T1 relaxation time increased in the SOL (R = 0.54, p = 0.01) and LG (R = 0.56, p = 0.01) (figure 3). A positive association was also observed between PPF and T2 relaxation time in the MG (R = 0.61, p = 0.003) and the LG (R = 0.56, p = 0.006) (figure 3). As COT increased, T1 relaxation time decreased in the MG (R = -0.44, p = 0.04) and T2 relaxation time decreased in the LG (R = -0.48, p = 0.03) (figure 4). With greater PWT, patients had decreased T2 values in the LG (R = -0.44, p = 0.04).Discussion
Alterations in T1 and T2 relaxation times are associated with hemodynamic and ambulatory parameters in patients with PAD. T1 values correlated with ABI, demonstrating that structural changes of PAD muscle can be observed in patients with worsening large vessel occlusion, likely reflecting worsening myopathy. We observed that T2 relaxation time decreased in patients with worsening IW, suggesting that T2 relaxometry may be of diagnostic utility in assessing the severity of damage in PAD muscles. We also observed relationships between T1 and T2 relaxation times and parameters of ambulatory performance. Worsening PPF was associated with decreasing T1 and T2 values and more robust relationships were observed in T2 relative to T1 values across the muscle groups analyzed. COT was associated with T1 and T2 values, whereas the most robust findings in PWT were related to T2 values. Variation across muscle groups in our studies in both T1 and T2 values may reflect muscle composition (i.e. fiber type, fatty infiltration), as observed amongst healthy volunteers6, as well as fibrosis. Additional analysis directly comparing histological and qMRI features will aid in the validation of MRI in characterizing the severity of PAD myopathy. Future studies may utilize imaging features to quantify and potentially predict patient response to treatment paradigms, including supervised exercise therapy and/or revascularization surgery.Conclusion
T1 and T2 relaxation times were associated with several parameters of hemodynamic and ambulatory performance. Quantitative MRI of PAD myopathy may aid in determining PAD severity and may be of utility in assessing treatment responses in patients with PAD.Acknowledgements
This work was supported with resources and the use of facilities at the VA Nebraska-Western Iowa Health Care System and funding by NIH grants R01 AG034995 and R01 AG049868.References
- P. Koutakis, S.A. Myers, K. Cluff, D.M. Ha, G. Haynatzki, R.D. McComb, K. Uchida, D. Miserlis, E. Papoutsi, J.M. Johanning, G.P. Casale, Pipinos, II, Abnormal myofiber morphology and limb dysfunction in claudication, J Surg Res 196(1) (2015) 172-9.
- C.J. Mietus, T.J. Lackner, P.S. Karvelis, G.T. Willcockson, C.M. Shields, N.G. Lambert, P. Koutakis, M.A. Fuglestad, H. Hernandez, G.R. Haynatzki, J.K.S. Kim, H.K. DeSpiegelaere, Pipinos, II, G.P. Casale, Abnormal Microvascular Architecture, Fibrosis, and Pericyte Characteristics in the Calf Muscle of Peripheral Artery Disease Patients with Claudication and Critical Limb Ischemia, J Clin Med 9(8) (2020).
- B. Versluis, W.H. Backes, M.G. van Eupen, K. Jaspers, P.J. Nelemans, E.V. Rouwet, J.A. Teijink, W.P. Mali, G.W. Schurink, J.E. Wildberger, T. Leiner, Magnetic resonance imaging in peripheral arterial disease: reproducibility of the assessment of morphological and functional vascular status, Invest Radiol 46(1) (2011) 11-24.
- W.C. Wu, E. Mohler, 3rd, S.J. Ratcliffe, F.W. Wehrli, J.A. Detre, T.F. Floyd, Skeletal muscle microvascular flow in progressive peripheral artery disease: assessment with continuous arterial spin-labeling perfusion magnetic resonance imaging, J Am Coll Cardiol 53(25) (2009) 2372-7.
- A.W. Pollak, C.H. Meyer, F.H. Epstein, R.S. Jiji, J.R. Hunter, J.M. Dimaria, J.M. Christopher, C.M. Kramer, Arterial spin labeling MR imaging reproducibly measures peak-exercise calf muscle perfusion: a study in patients with peripheral arterial disease and healthy volunteers, JACC Cardiovasc Imaging 5(12) (2012) 1224-30.
- N.F. Schwenzer, P. Martirosian, J. Machann, C. Schraml, G. Steidle, C.D. Claussen, F. Schick, Aging effects on human calf muscle properties assessed by MRI at 3 Tesla, J Magn Reson Imaging 29(6) (2009) 1346-54.
Figures
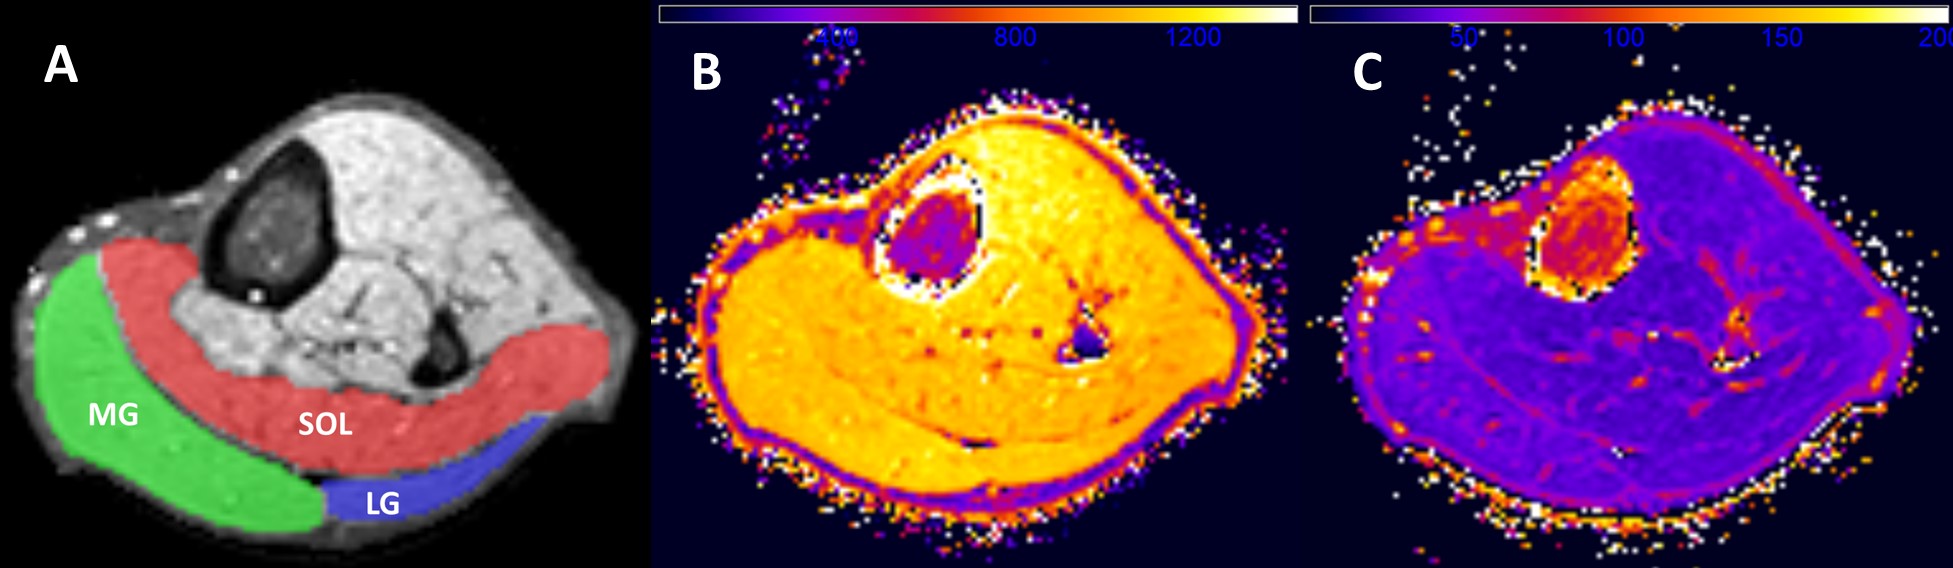
Figure
1: A) Overlay of manually drawn regions on T2-weighted cross-section. B & C)
Corresponding T1 and T2 relaxation time maps.
MG = medial gastrocnemius, LG = lateral gastrocnemius, and SOL = soleus
muscle regions.
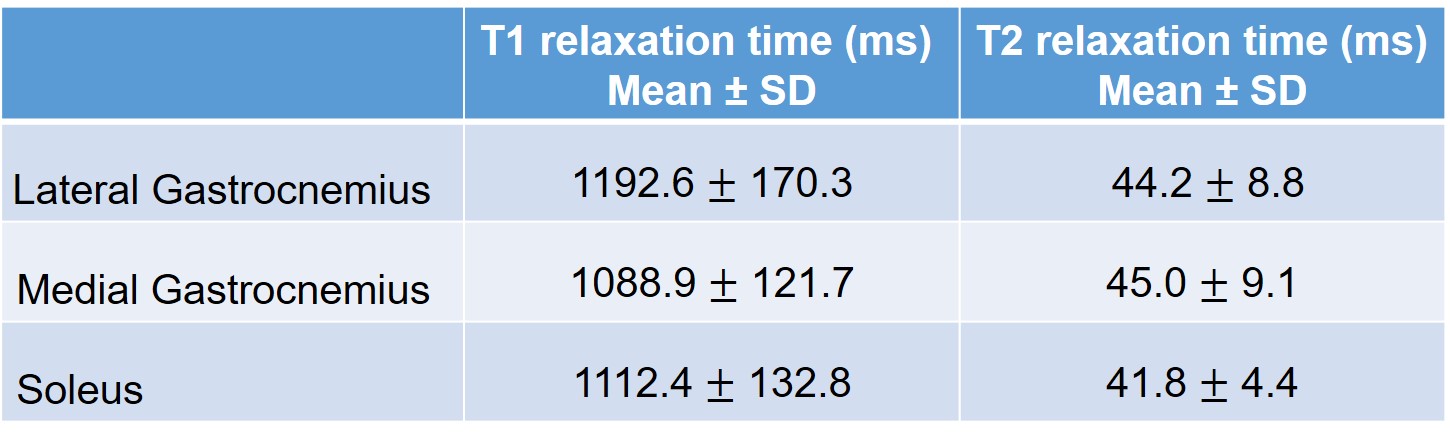
Table
1: T1 and T2 values (Mean ± SD) in LG, MG, and SOL muscles in PAD patients.
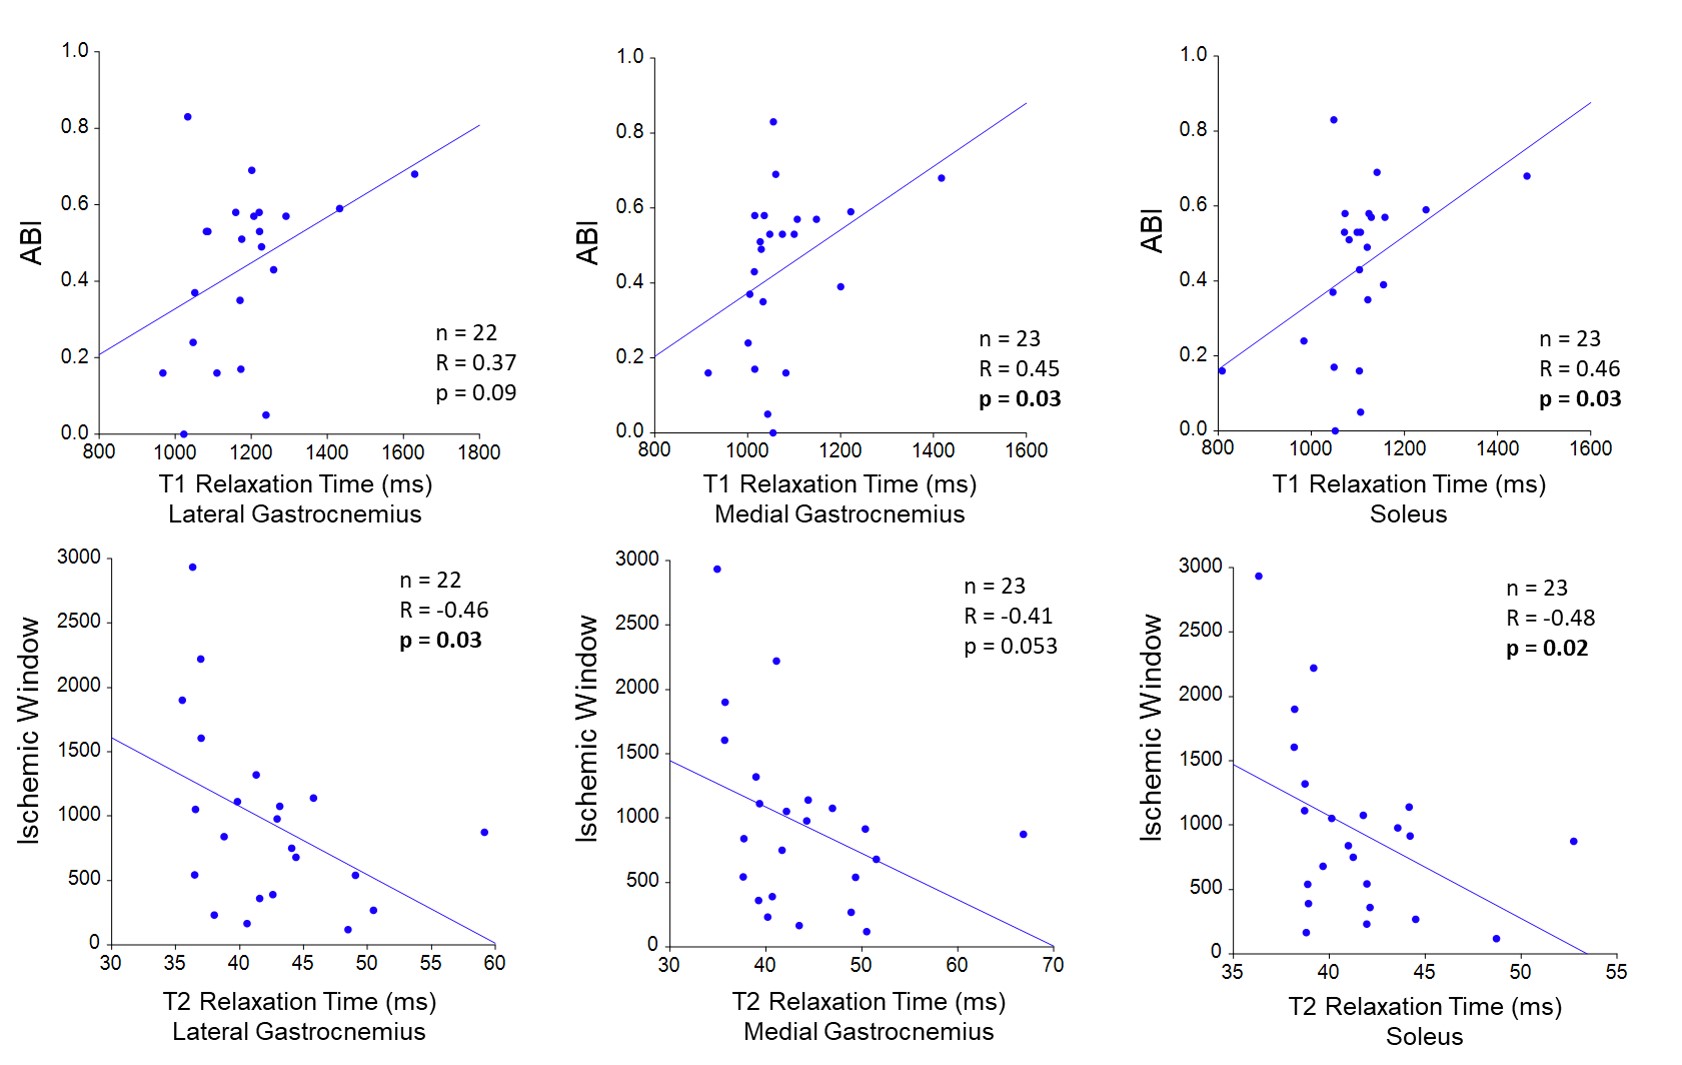
Figure 2: Ankle Brachial Index (ABI) is positively
correlated with T1 relaxation time in the medial gastrocnemius and soleus (upper panel). Decreasing ABI reflects
worsening arterial blockages. Ischemic
window is negatively correlated with T2 relaxation time in the soleus and
lateral gastrocnemius (lower panel). Increasing ischemic window reflects worsening
arterial blockages.
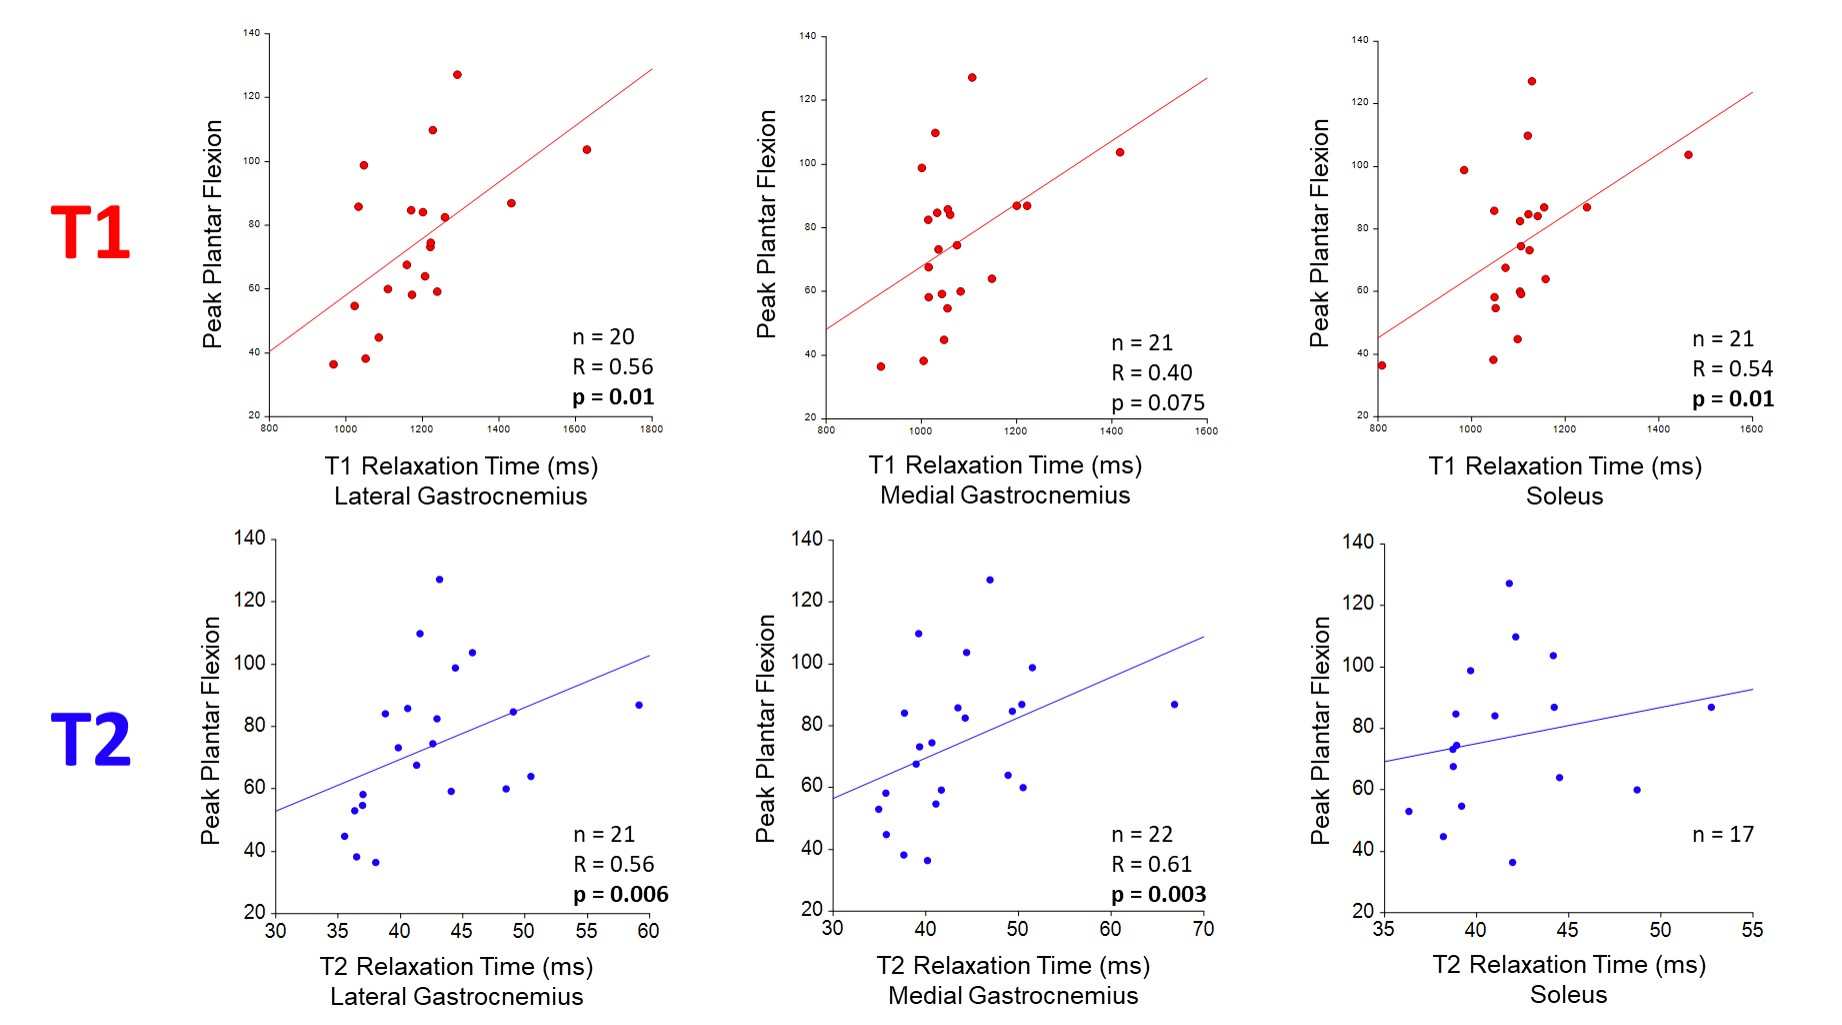
Figure
3: Peak plantar flexion is positively
correlated with both T1 and T2 relaxation time in the calf muscles of patients
with PAD. Decreasing peak plantar
flexion reflects worsening muscle/leg performance.
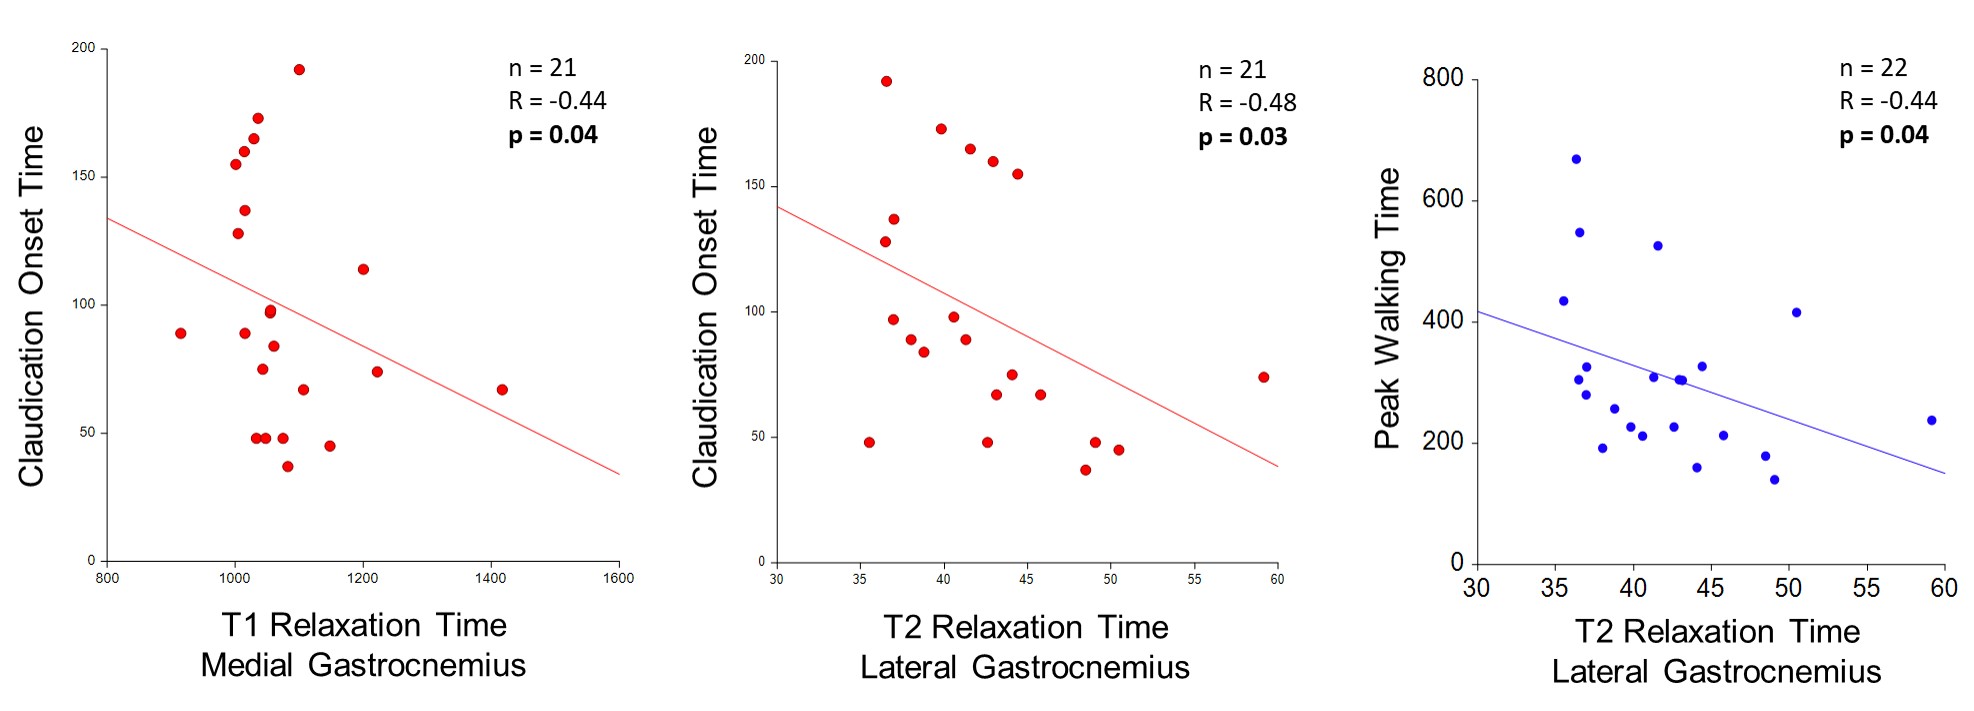
Figure
4: Claudication onset time is inversely correlated
to both T1 and T2 relaxation times and peak walking time is inversely
correlated with T2 relaxation time in the calf muscles of patients with PAD. Decreasing claudication onset time and peak
walking time reflect worsening muscle/leg performance.