3606
Right ventricular T1 mapping using a novel STEAM-based approach: STEAM-SASHA1National Heart and Lung Institute, Imperial College London, London, United Kingdom, 2Cardiovascular Magnetic Resonance Unit, Royal Brompton Hospital, London, United Kingdom
Synopsis
Here we propose a new method to reduce the influence of blood and epicardial fat on right ventricular T1 mapping. This is achieved by leveraging the excellent blood and fat suppression provided by the stimulated echo acquisition mode (STEAM) EPI sequence in a novel saturation recovery based (SASHA) single-shot T1 mapping sequence. The novel (STEAM-SASHA) approach is evaluated and compared to a standard modified Look-Locker imaging sequence in both phantom and in vivo measurements in the septum and right ventricle.
Introduction
Despite substantial interest in T1 mapping of the right ventricle (RV)1–3, current acquisition methods are often limited by partial volume effects. Signal from the blood pool and epicardial fat frequently contaminates the myocardial signal using both saturation and inversion recovery-based methods, which is particularly problematic in the thin highly-mobile RV. Here we leverage the excellent blood and fat suppression provided by the stimulated echo acquisition mode (STEAM)4 sequence to facilitate dark blood fat-suppressed saturation recovery based (SASHA)5 single-shot T1 mapping (STEAM-SASHA).Methods
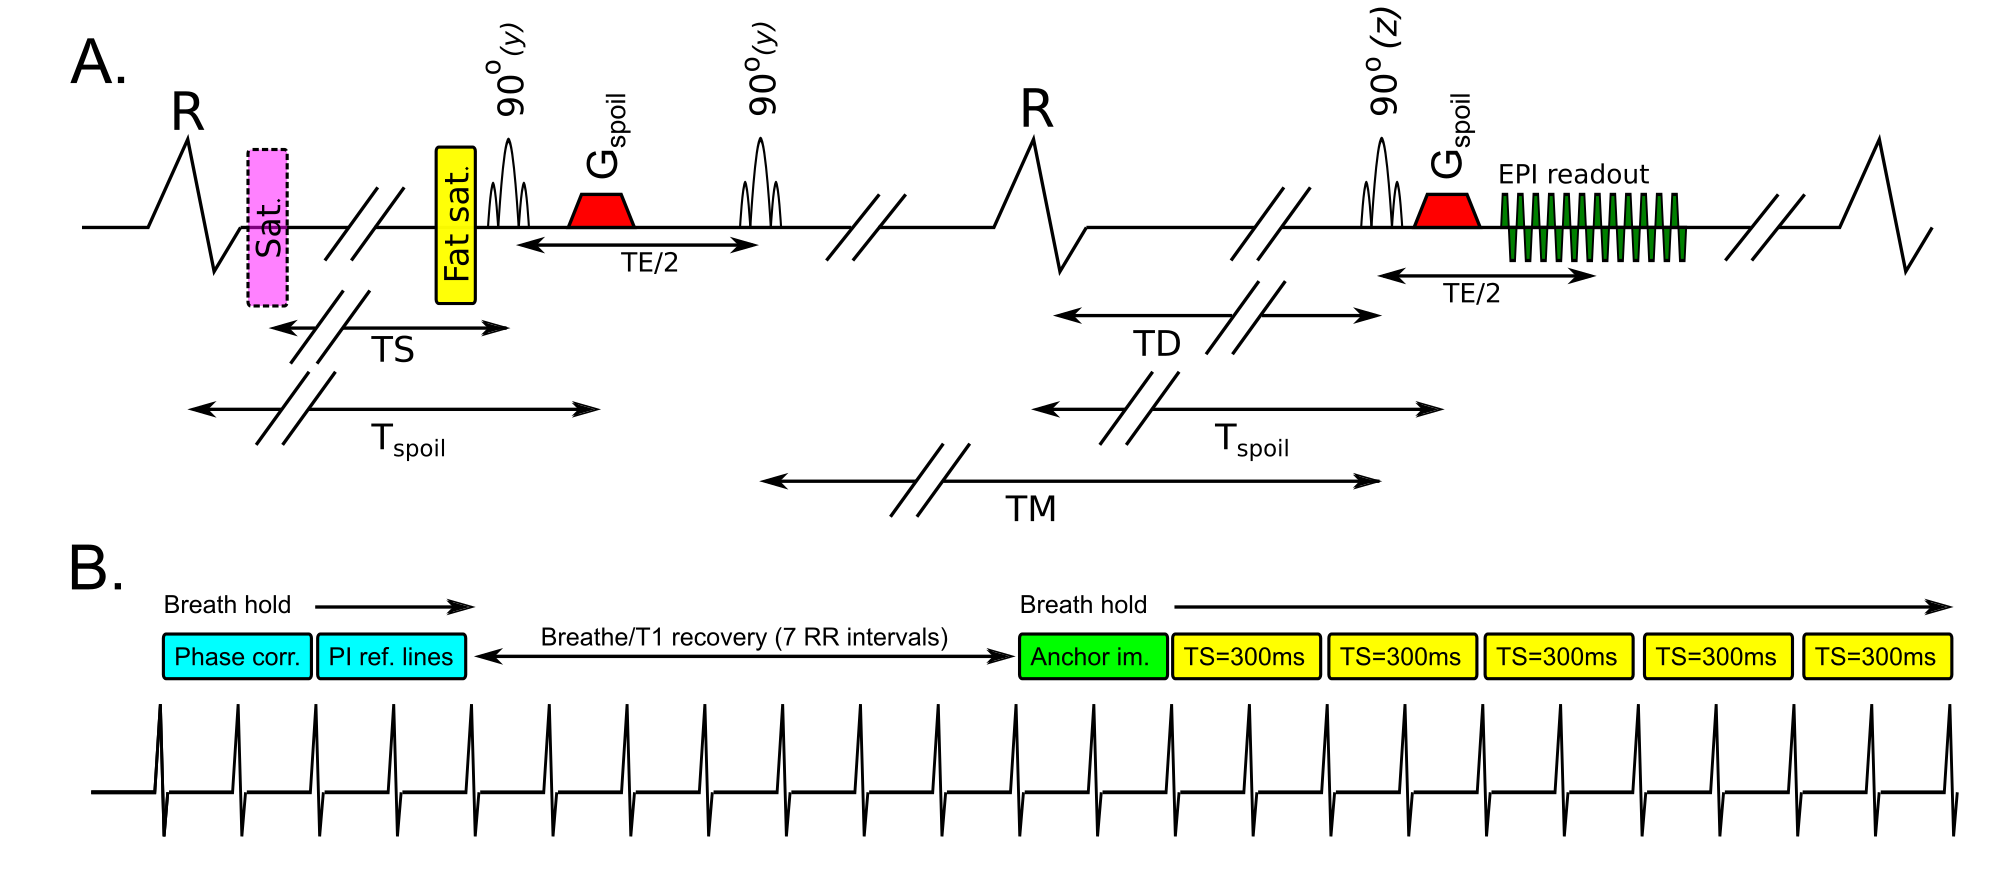
The STEAM-SASHA sequence splits preparation for each single-shot EPI readout over two consecutive cardiac cycles (Figure 1.A). The first two RF pulses and a spoiler gradient are run in the first heartbeat and the third RF pulse is run in the next heartbeat, followed by another spoiler gradient run at the same delay from the R-wave (Tspoil) as in the first cardiac cycle. The first two RF pulses are slice selective in the phase encode direction, reducing the field of view contributing to the stimulated echo and the third is slice selective through plane.The spoiler gradients eliminate gradient echo signal from the third RF pulse leaving only the stimulated echo. Blood signal is minimised via the spoiler gradients and the outflow of blood during the mixing time (TM) between the second and third RF pulses. Fat signal is suppressed via a fat suppression pulse before the first RF pulse and the T1 decay of fat during TM.
Each acquisition consisted (Figure 1.B) of two stimulated echoes (4 RR-intervals) for EPI phase correction and parallel imaging reference during breath holding, followed by 7 RR-intervals T1 recovery time (1 breathing cycle), and then during breath hold, an anchor image (2 RR-intervals) and 5 images (10 RR-intervals) with a saturation pulse applied a time TS before the first RF pulse of the stimulated echo 6.
Data was acquired in the T1MES phantom7 and 6 volunteers (5 male) using the STEAM-SASHA and 5b(3b)3b product MOLLI sequence (Siemens Vida 3T). Mid-ventricular short-axis data was acquired at peak systole using 2 repeats of both acquisitions. Breath hold MOLLI data was acquired with a minimum TI=100ms (increment 80ms), bSSFP readout, TE=1.0ms, TR=2.4ms, flip angle=20˚, acquired resolution 2.4x2.0x8mm3, 7/8ths partial Fourier, GRAPPA x2. STEAM-SASHA used TE=36ms, TR=2RR-intervals, acquired resolution 2.8x2.8x8mm3, field of view 360x270mm2, SENSE x2, and TS=300ms (fixed).
Pixelwise T1 maps were generated using the online (“Myomaps”) product image reconstruction for MOLLI and using:
$$T1 = {-TS \over ln(1-S_{TS} / S_{anchor})}$$
for the STEAM-SASHA data after averaging the anchor (intensity Sanchor) and TS=300ms images (STS).
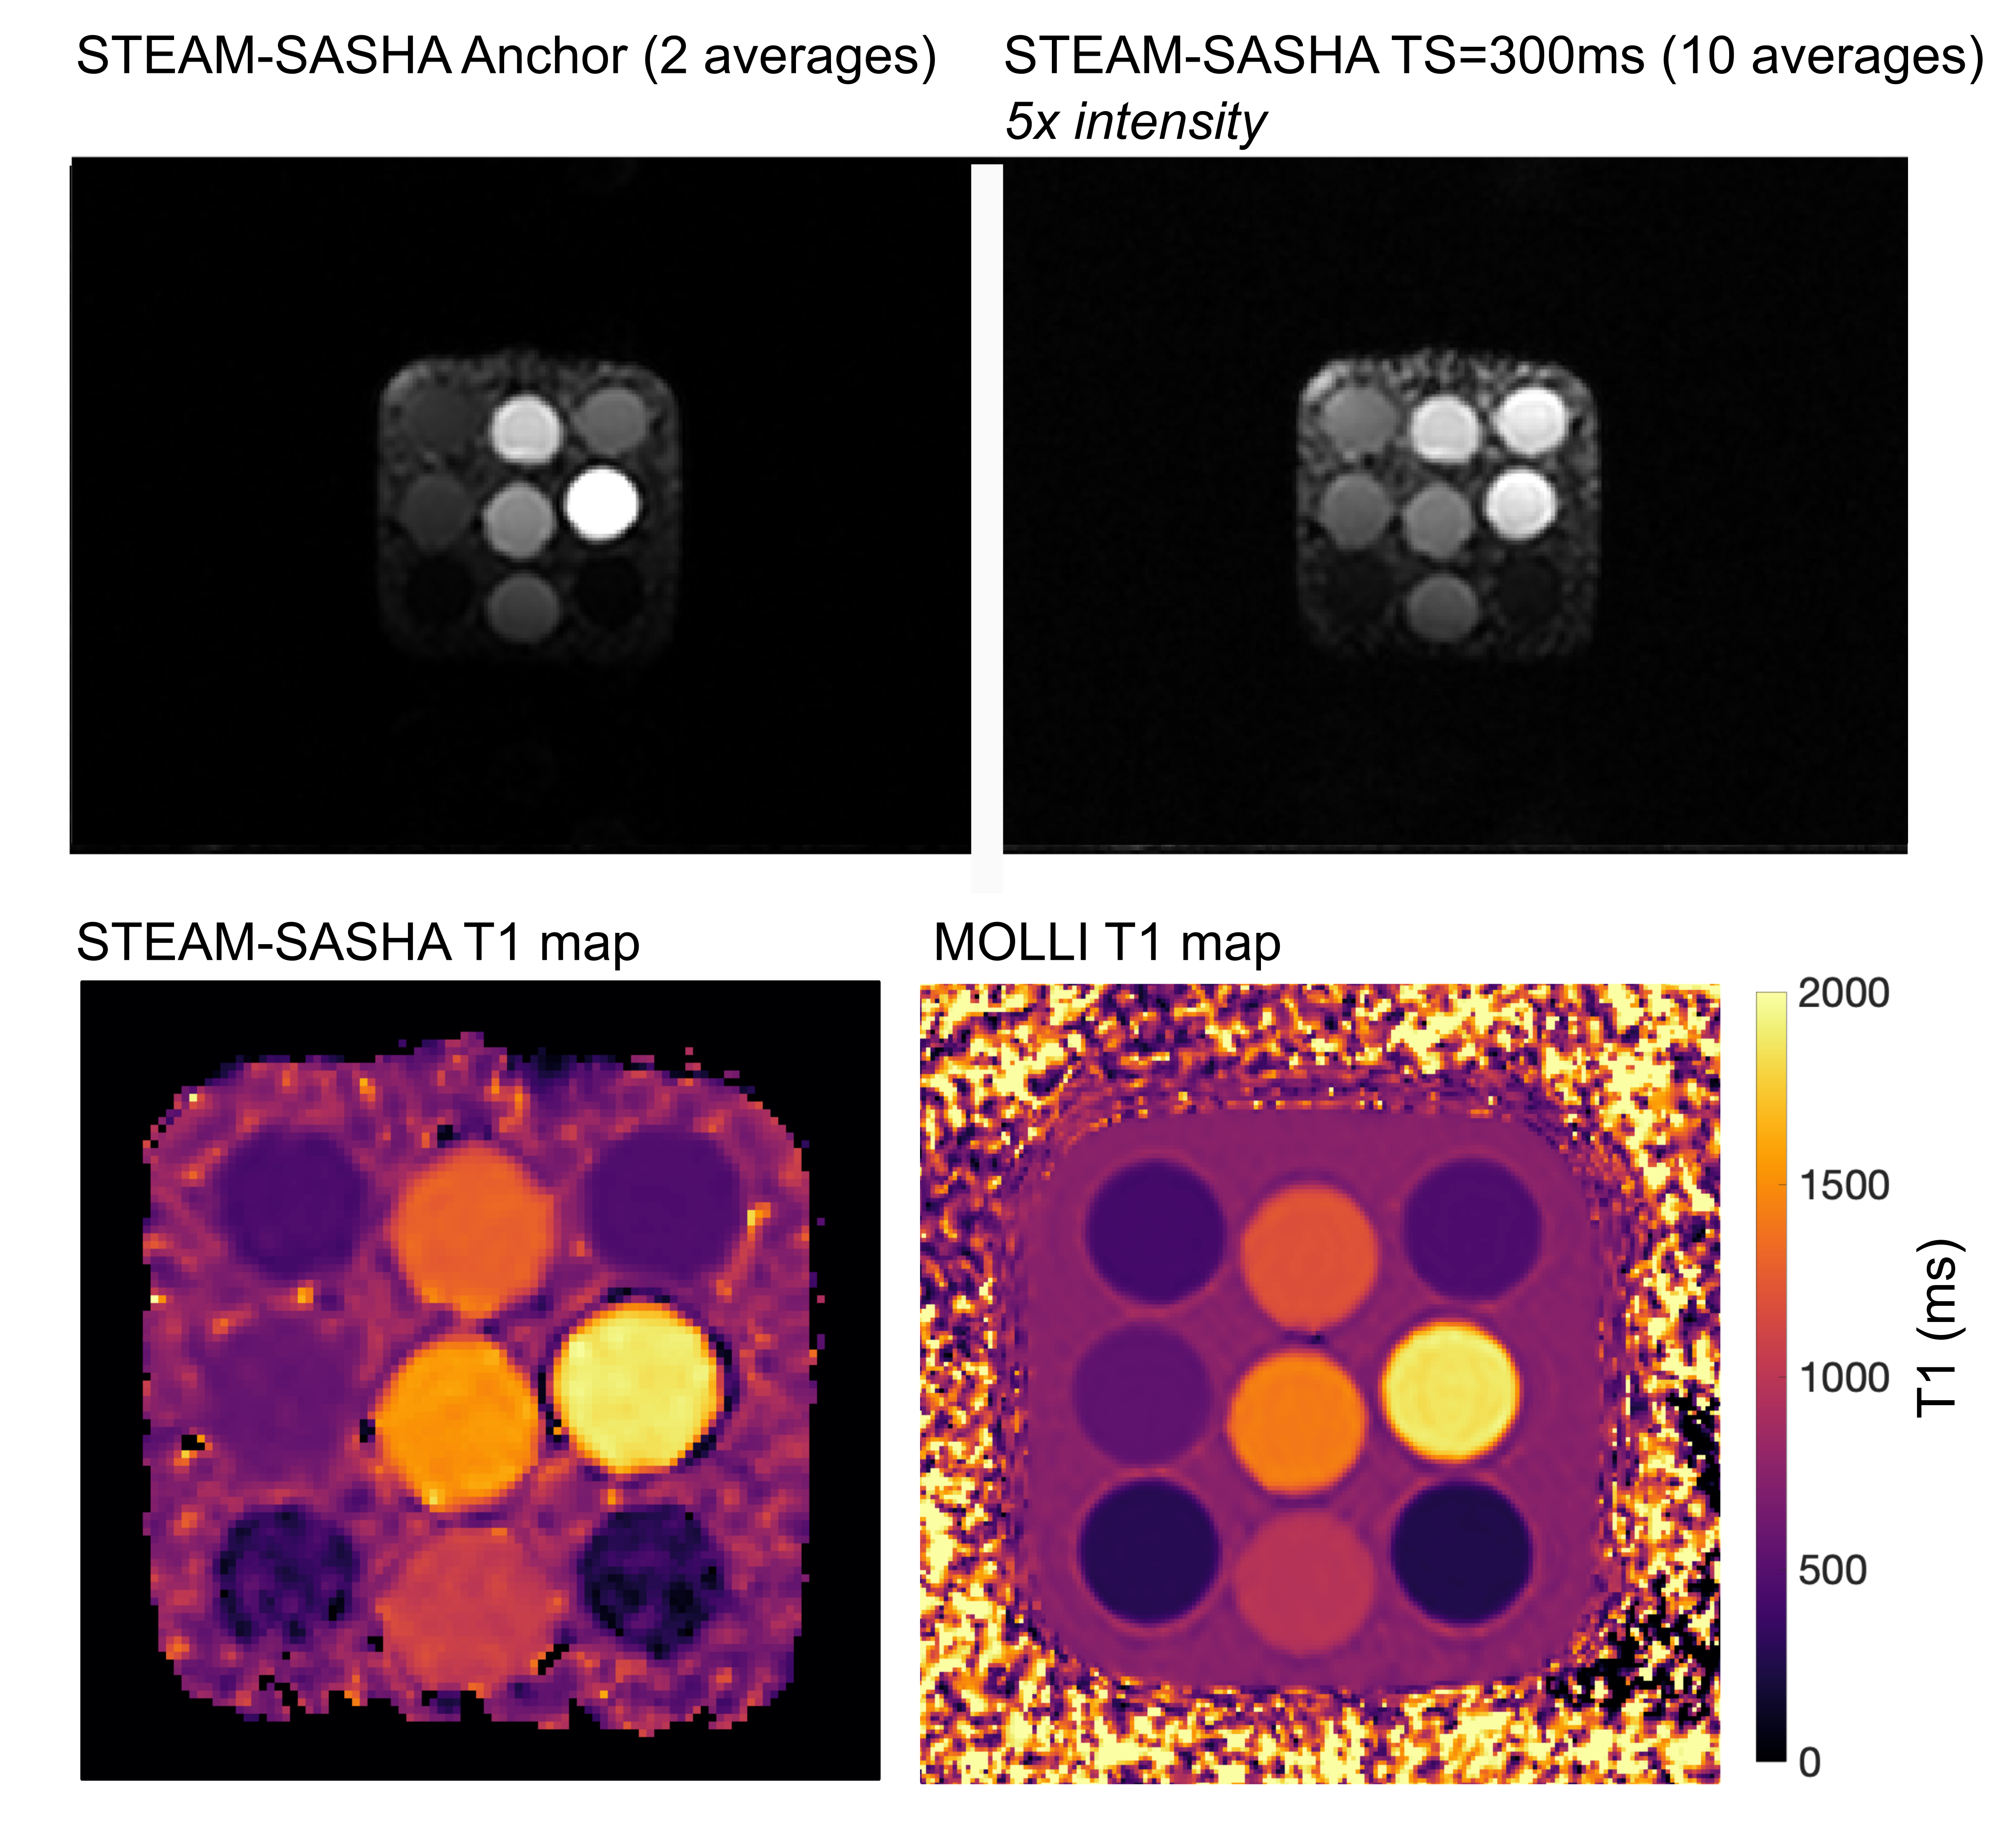
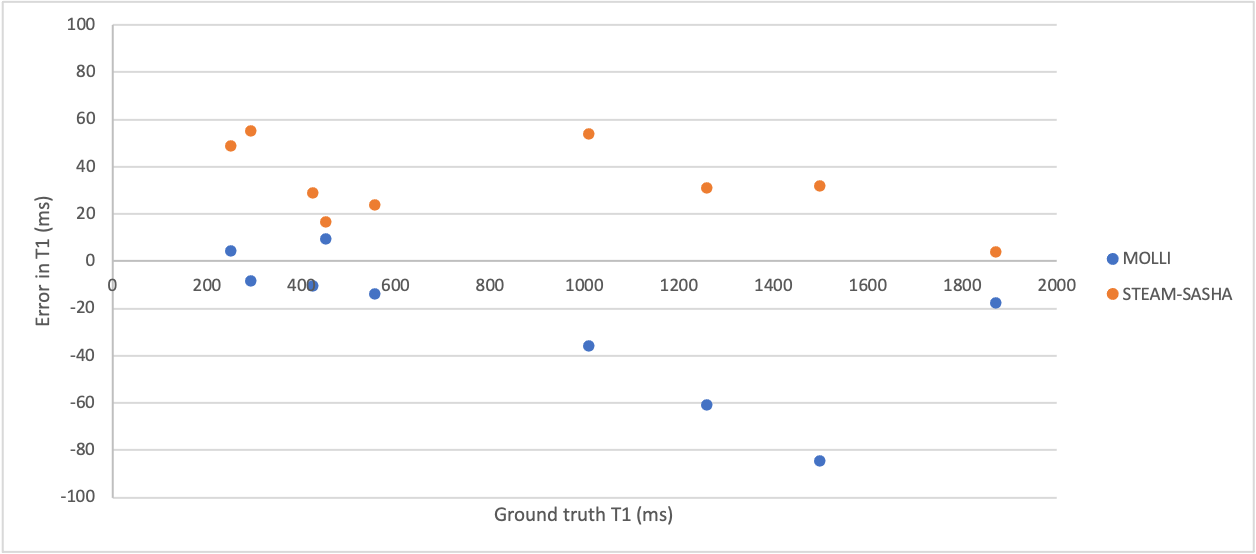
Results
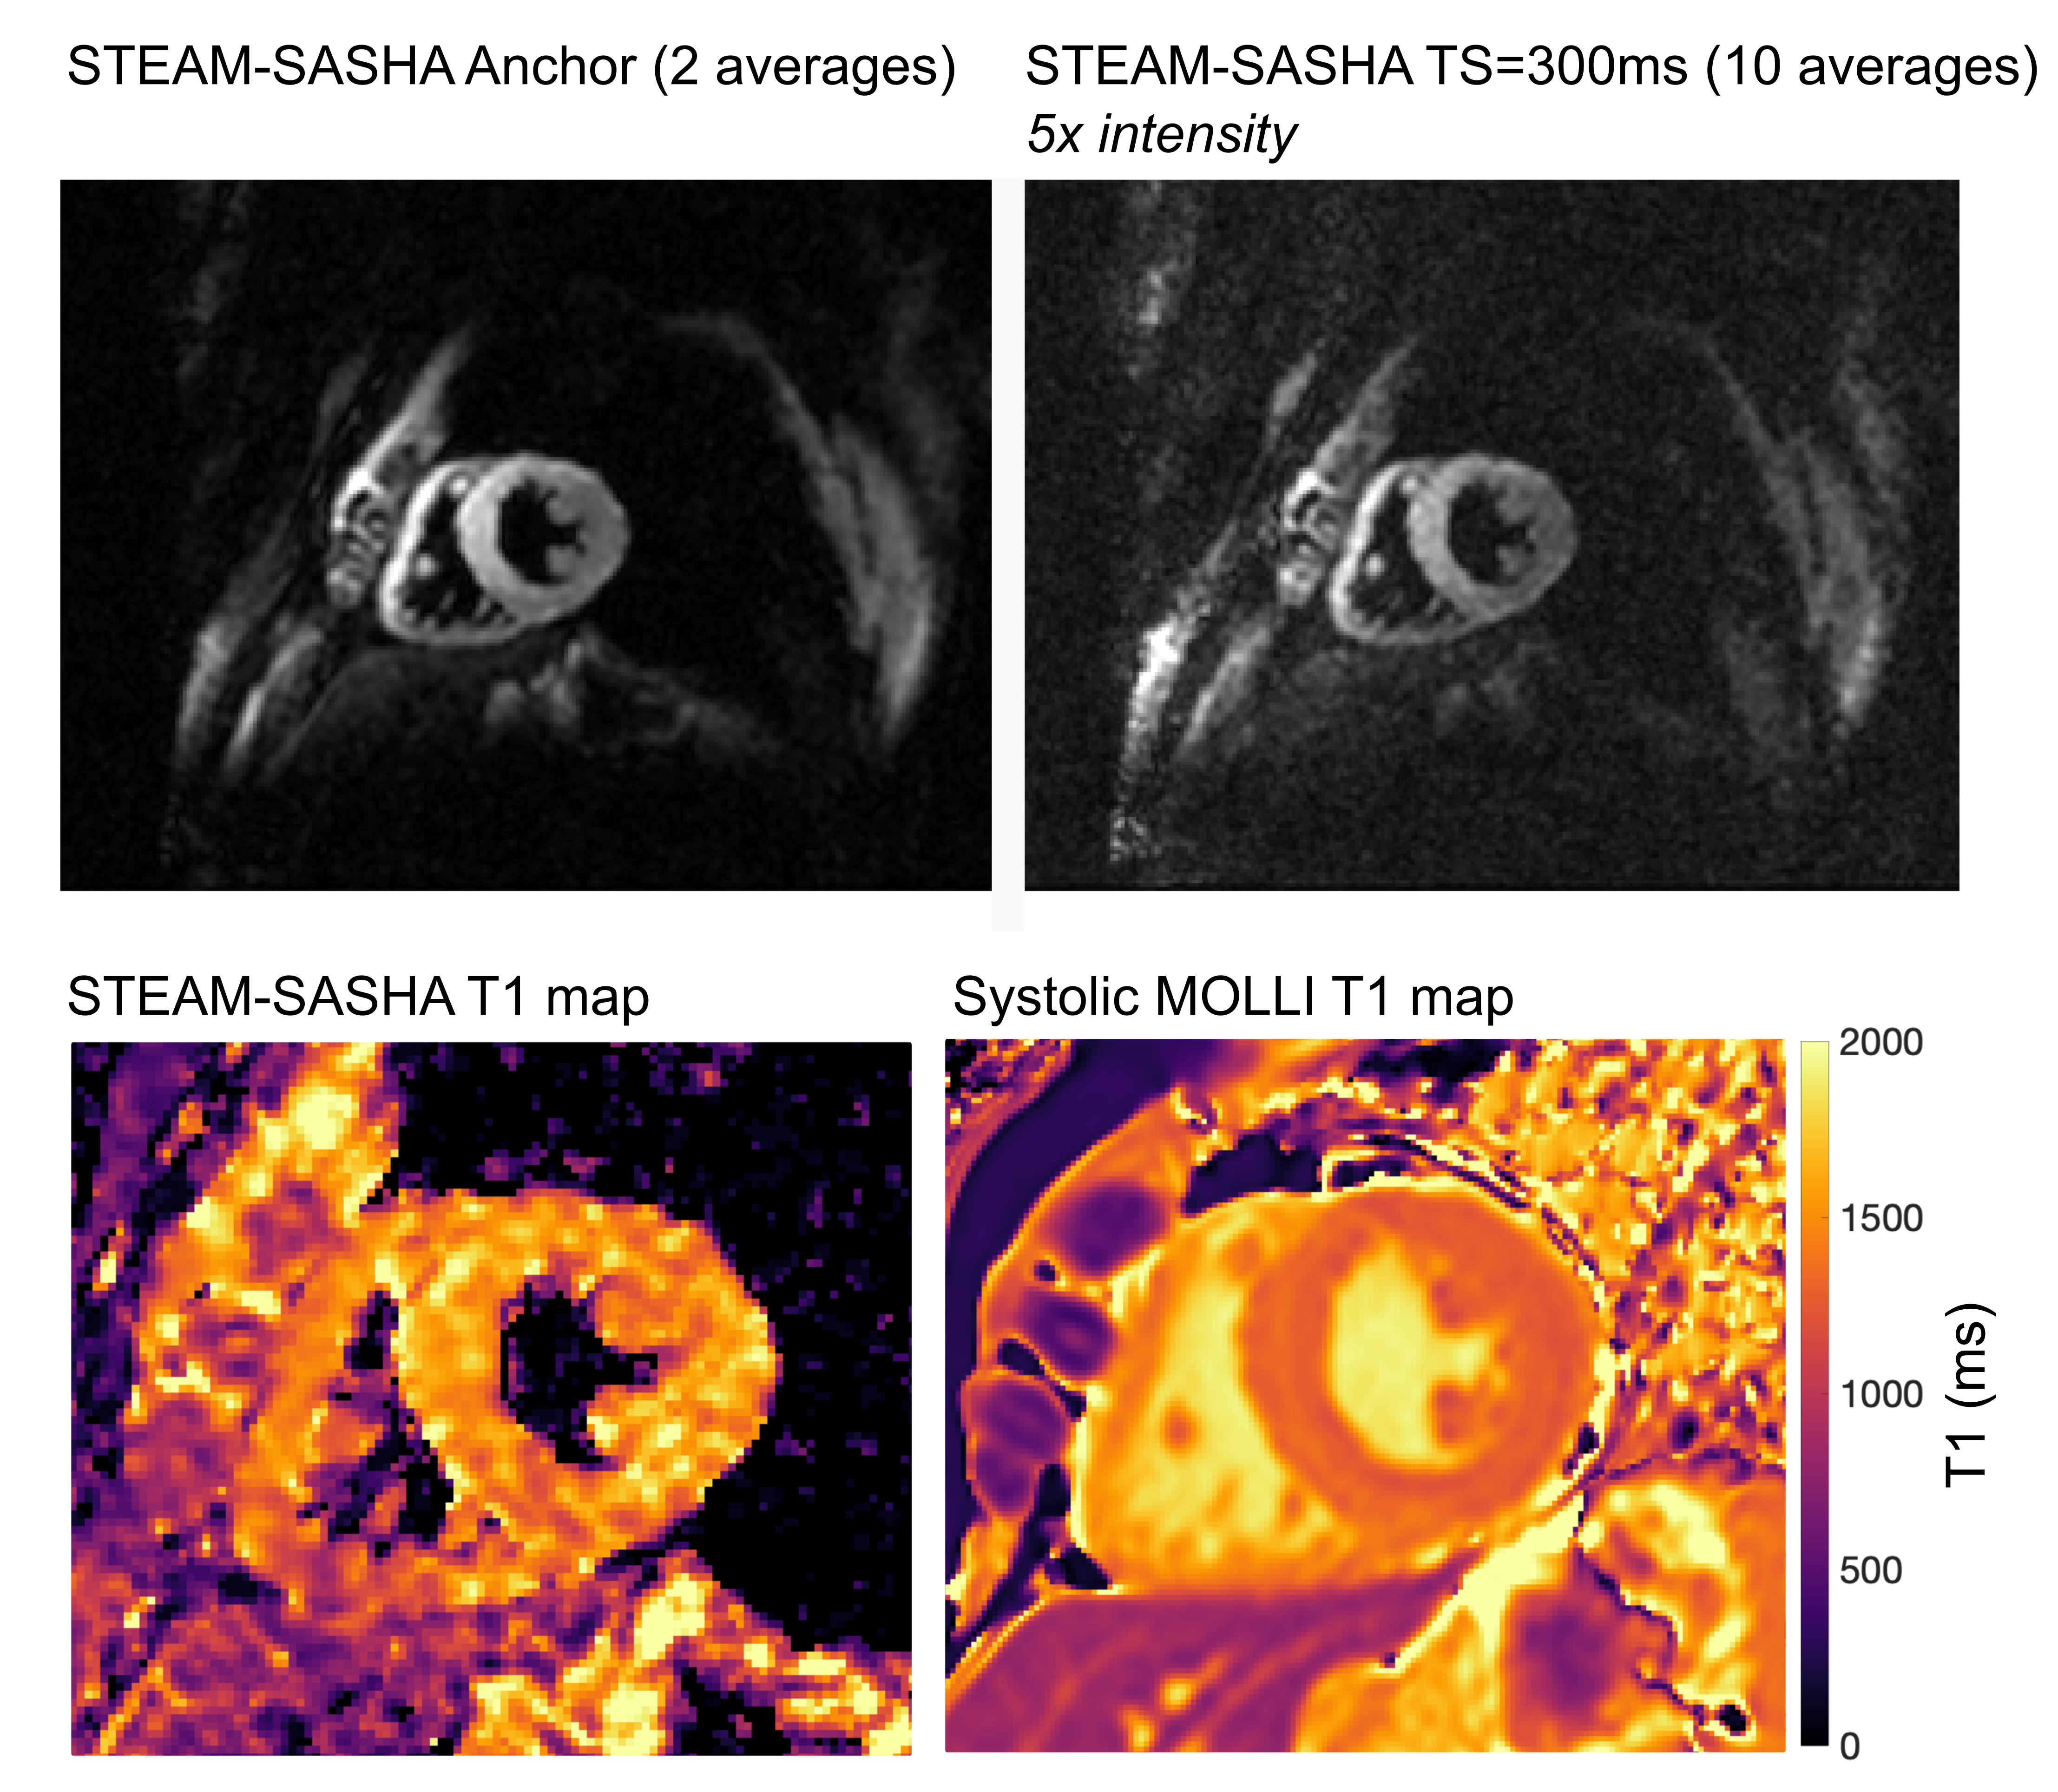
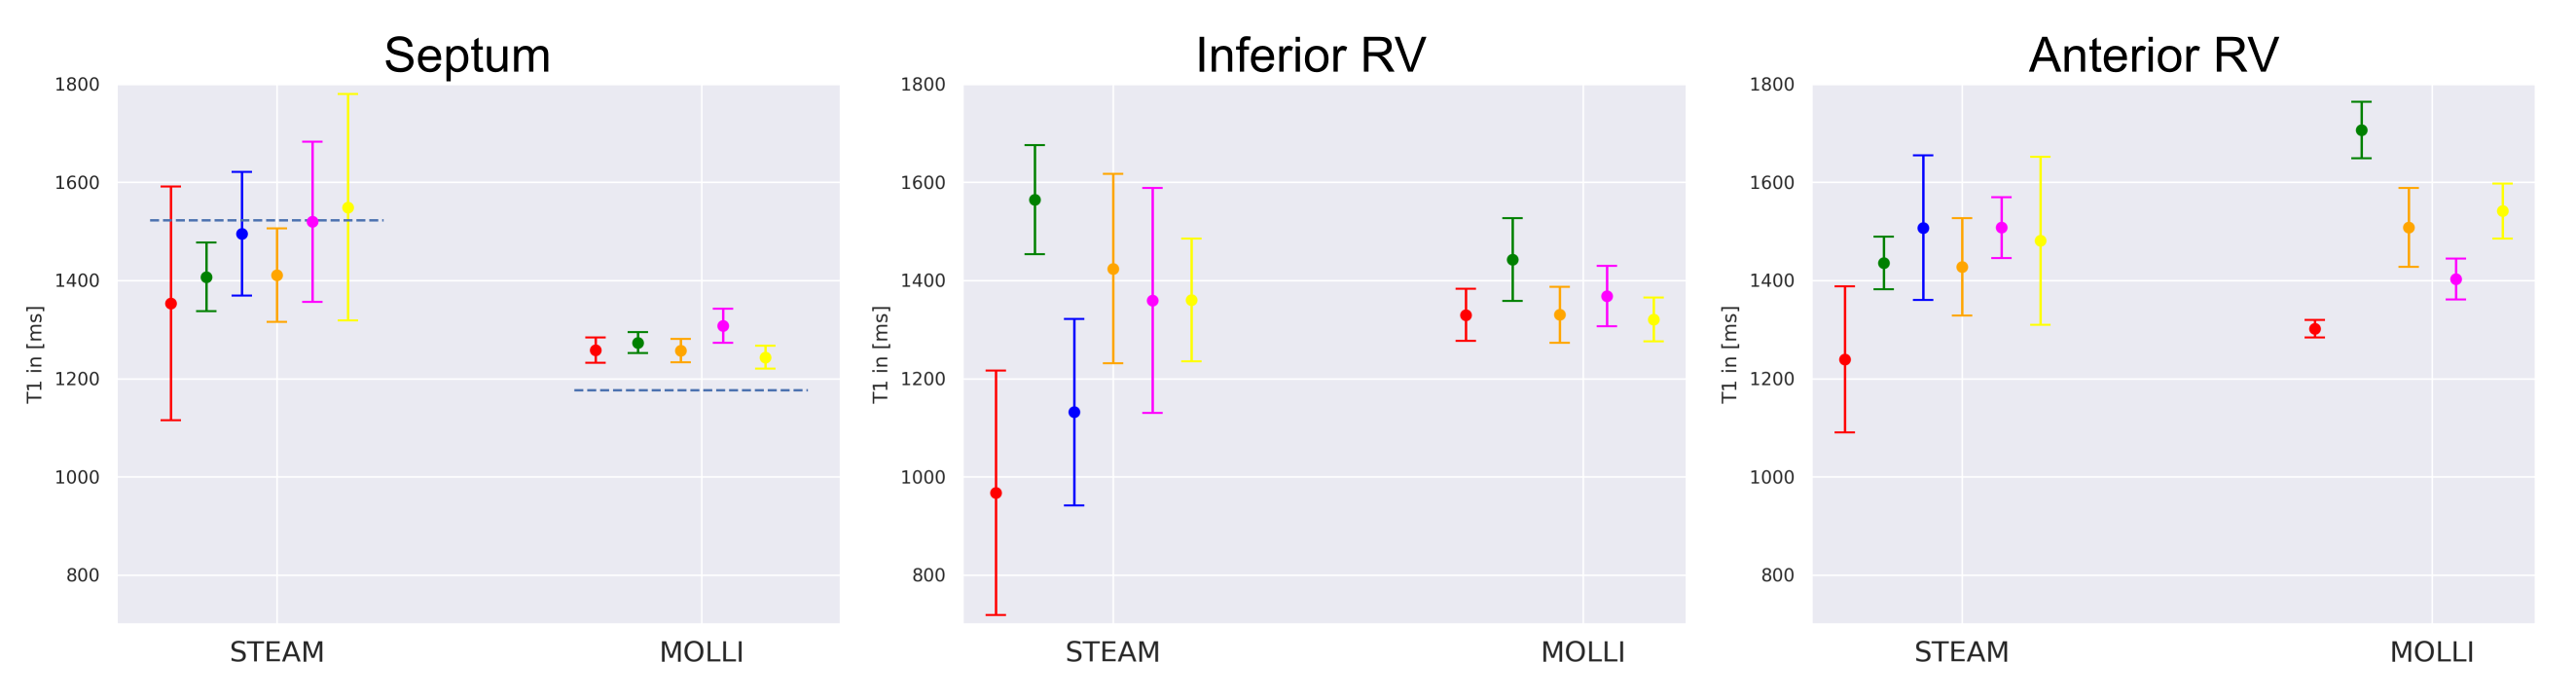
Figure 2 shows example STEAM-SASHA images and T1 maps from both sequences in the T1MES phantom. On average, MOLLI underestimated while STEAM-SASHA overestimated T1 with mean absolute error 3.0% and 7.0% respectively compared to the published 3T T1MES values7. At typical 3T T1 for in-vivo myocardium (T1>1200ms), STEAM-SASHA provides results closer to ground truth7 than MOLLI (figure 3), with errors of <2.5%.STEAM-SASHA data was successfully acquired in all subjects and STEAM-SASHA T1 maps show the RV clearly with good blood suppression (see Figure 4). Figure 5 compares T1 values from mesocardial regions of interest in the septum, anterior and inferior RV.
Over the 6 subjects (5 for systolic MOLLI), median [IQR] T1 in the septum (STEAM-SASHA vs. MOLLI) was 1452[106]ms vs. 1259[14]ms; 1458[71]ms vs. 1509[155]ms in the anterior RV; and 1360[123]ms vs. 1354[64]ms. While there was a larger standard deviation within the STEAM-SASHA ROIs, and the interquartile range of the means was less for MOLLI in the septum and inferior RV, the interquartile range of STEAM-SASHA T1 is less in the anterior RV than for MOLLI.
Discussion
We have demonstrated a saturation recovery STEAM sequence (STEAM-SASHA) provides T1 maps with excellent blood and fat suppression. Results in a phantom demonstrated that STEAM-SASHA provides accurate T1 values, particularly in the expected native T1 range, where it was more accurate than MOLLI. In-vivo, STEAM-SASHA provides septal T1 results close to results obtained using SASHA at 3T8 and initial results in the RV suggest that STEAM-SASHA may have less inter-subject variability in the anterior RV than MOLLI, possibly due to reduced blood and fat contamination of the signal.As with other saturation based T1 mapping methods, STEAM-SASHA appears to be less precise than MOLLI, due to the reduced dynamic range after a saturation pulse in comparison to an inversion pulse9. The 50% loss of SNR inherent in a STEAM sequence is likely to also reduce precision, but additional signal averages can mitigate this at the expense of time. During TM of the STEAM sequence the stored magnetisation decays with T1 and heartrate variations during an acquisition would result in errors in calculated T1. Furthermore, the STEAM sequence is sensitive to diffusion during the mixing time (effective diffusion weighting b=100smm-2) and variations in heart rate would also result in errors in measured T1, but heart rate variability induced errors could be minimised in future using an RR-interval based correction.
Conclusion
STEAM-SASHA provides dark blood, fat suppressed T1 maps, eliminating partial volume related errors caused by blood and fat and is a promising alternative to established T1 mapping methods for application in the challenging RV myocardium.Acknowledgements
This work was funded by British Heart Foundation Grants:
RG/19/1/34160
FS/16/40/32167
FS/11/38/28864
References
1.Kawel-Boehm N, Buser TD, Greiser A, Bieri O, Bremerich J, Santini F. In-vivo assessment of normal T1 values of the right-ventricular myocardium by cardiac MRI. Int J Cardiovasc Imaging. 2014. doi:10.1007/s10554-013-0326-3
2.Shiina Y, Inai K, Taniguchi K, Takahashi T, Nagao M. Potential Value of Native T1 Mapping in Symptomatic Adults with Congenital Heart Disease: A Preliminary Study of 3.0 Tesla Cardiac Magnetic Resonance Imaging. Pediatr Cardiol. 2020. doi:10.1007/s00246-019-02227-8
3.Mehta BB, Auger DA, Gonzalez JA, et al. Detection of elevated right ventricular extracellular volume in pulmonary hypertension using Accelerated and Navigator-Gated Look-Locker Imaging for Cardiac T1 Estimation (ANGIE) cardiovascular magnetic resonance. J Cardiovasc Magn Reson. 2015. doi:10.1186/s12968-015-0209-y
4.Nielles-Vallespin S, Mekkaoui C, Gatehouse P, et al. In vivo diffusion tensor MRI of the human heart: reproducibility of breath-hold and navigator-based approaches. Magn Reson Med. 2013;70(2):454-465. doi:10.1002/mrm.24488
5.Chow K, Flewitt JA, Green JD, Pagano JJ, Friedrich MG, Thompson RB. Saturation recovery single-shot acquisition (SASHA) for myocardial T 1 mapping. Magn Reson Med. 2014. doi:10.1002/mrm.24878
6.Kellman P, Xue H, Chow K, Spottiswoode BS, Arai AE, Thompson RB. Optimized saturation recovery protocols for T1-mapping in the heart: influence of sampling strategies on precision. J Cardiovasc Magn Reson. 2014. doi:10.1186/s12968-014-0055-3
7.Captur G, Gatehouse P, Keenan KE, et al. A medical device-grade T1 and ECV phantom for global T1 mapping quality assurance - the T1 Mapping and ECV Standardization in cardiovascular magnetic resonance (T1MES) program. J Cardiovasc Magn Reson. 2016. doi:10.1186/s12968-016-0280-z
8.Weingärtner S, Meßner NM, Budjan J, et al. Myocardial T1-mapping at 3T using saturation-recovery: reference values, precision and comparison with MOLLI. J Cardiovasc Magn Reson. 2016. doi:10.1186/s12968-016-0302-x
9.Kellman P, Hansen MS. T1-mapping in the heart: Accuracy and precision. J Cardiovasc Magn Reson. 2014. doi:10.1186/1532-429X-16-2
Figures