3605
The suggested possibility of the T2rho contrast in the modified Look-Locker MRI technique used for the T1 quantification1Radiology, University of Colorado Anschutz Medical Campus, Aurora, CO, United States
Synopsis
The modified Look-Locker imaging (MOLLI) technique is widely used in cardiac imaging for T1 mapping. When the MOLLI technique is performed, the B1 field, perpendicular to the magnetization, is continually applied during the steady state imaging. Hence, the relaxation of the magnetization during this time may be linked to the T2rho (the T2 relaxation time constant in the rotating frame) contrast, sensitive to the iron content. Here, the theoretical background and a preliminary phantom imaging results are presented to explore the possibility of extracting T2rho contrast from the MOLLI sequence.
Introduction
For iron overloading MRI, the quantification of T2* using the gradient echo imaging is widely used and has been clinically successful in the liver (1). The T2rho (T2ρ) relaxation, i.e. the T2 relaxation in the rotating frame, is also known to be sensitive to iron content changes in MRI (2, 3). Having less dependency of a local susceptibility variation that may be attributable to many other factors than the iron content change, the T2rho contrast may be useful to improve the specificity of detecting iron overload in the target organ. In addition, trying to obtain the information on the iron content based on the T2rho contrast may be quite useful when it can be extracted from another commonly performed clinical sequence that would be run routinely for another specific purpose. One example of such sequences is the modified Look-Locker inversion recovery (MOLLI) (4) sequence commonly performed for cardiac T1 mapping.Additionally, as the MRI relaxometry may keep playing a continued role (especially in a high field) in detecting, due to the iron deposition, the amyloid plaque that is linked to the Alzheimer’s disease (AD) (2, 3), the MOLLI technique, if proven useful to extract T1 and T2rho contrast at the same time, could be a good in vivo imaging technique to further investigate for detecting and studying neurodegenerative diseases. Here, the theoretical background and a preliminary phantom imaging results to explore the possibility of extracting T2rho contrast from the MOLLI sequence are presented.
Methods
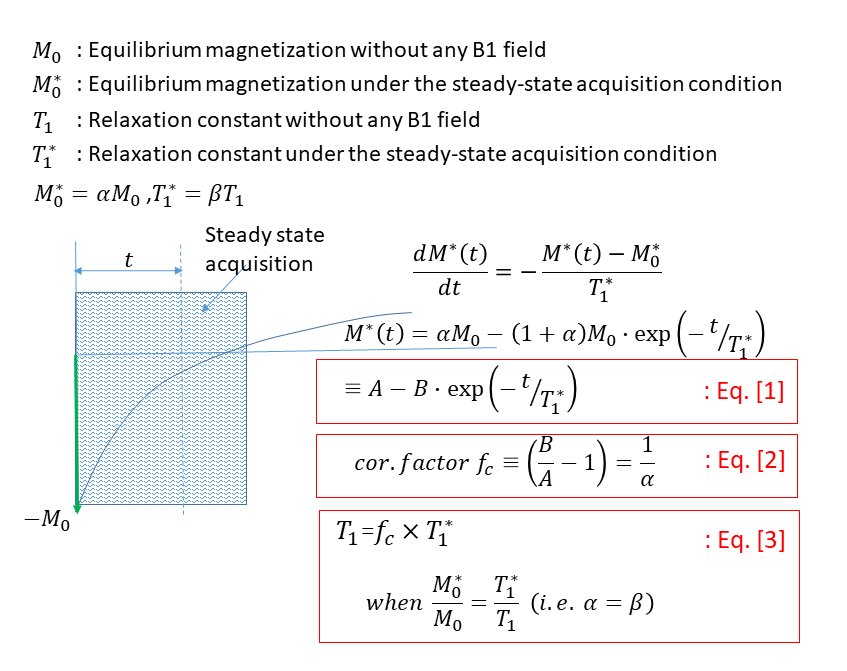
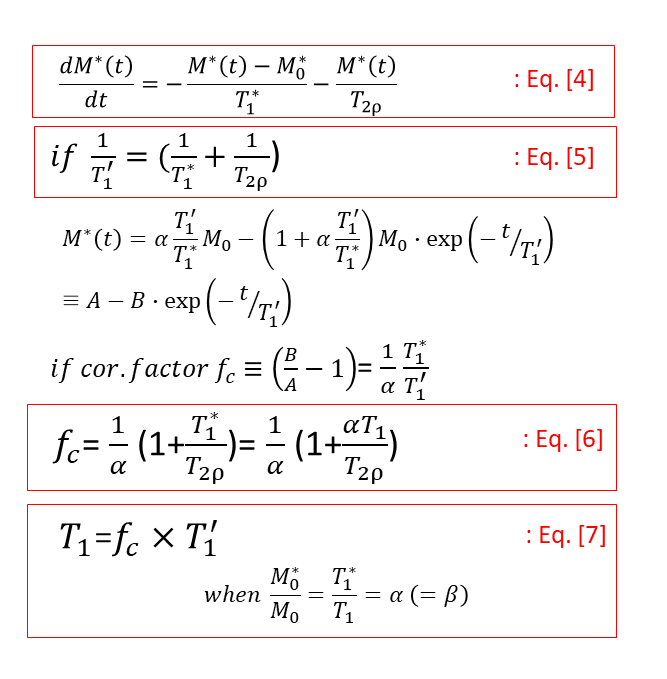
Theory: As shown in Fig. 1, the MOLLI signal is typically modeled by Eq. 1, which, once determined by a curve fitting, can generate the correction factor (Eq. 2) that, when multiplied to the “apparent” T1 (i.e. T1*), would result in the actual T1 (Eq. 3). When the B1 field is applied to repeatedly flip the magnetization in a certain degree back and forth, the longitudinal component, as shown in Eq. 4 of Fig. 2, could be assumed changing by the T2rho relaxation, in addition to the apparent T1 relaxation. In this case, the MOLLI signal can be modeled as similar to Eq. 1, with the only exception being the new apparent T1 (i.e. T1’) containing a T2rho component (Eq. 5). As shown in Eq. 6 & Eq. 7, the correction factor and the actual T1 are also similarly obtained, but notably the correction factor, Eq. 6, contains the T2rho component.Phantom test: In this preliminary study, a T2rho effect, whether detectable in the MOLLI data analysis or not, was tested by acquiring a few MOLLI sequences while varying only the flip angle (FA) values. The assumption was that the apparent T1 (before the correction factor was applied), and the correction factor would have the effects from the varied FA values, while the corrected actual T1 would not have any effects from the varied FA values. The MOLLI sequence was performed at 1.5 T (Philips Ingenia) with a native acquisition scheme, i.e., 5s(3s)3s, for a home-made T1 phantom containing vials, whose reference T1 ranged approximately from 200 ms to 2000 ms. The reference T1 values were obtained by the inversion-recovery sequence for each experiment. All the data analysis was done by an in-house MATLAB (MathWorks, MA) program.
Results
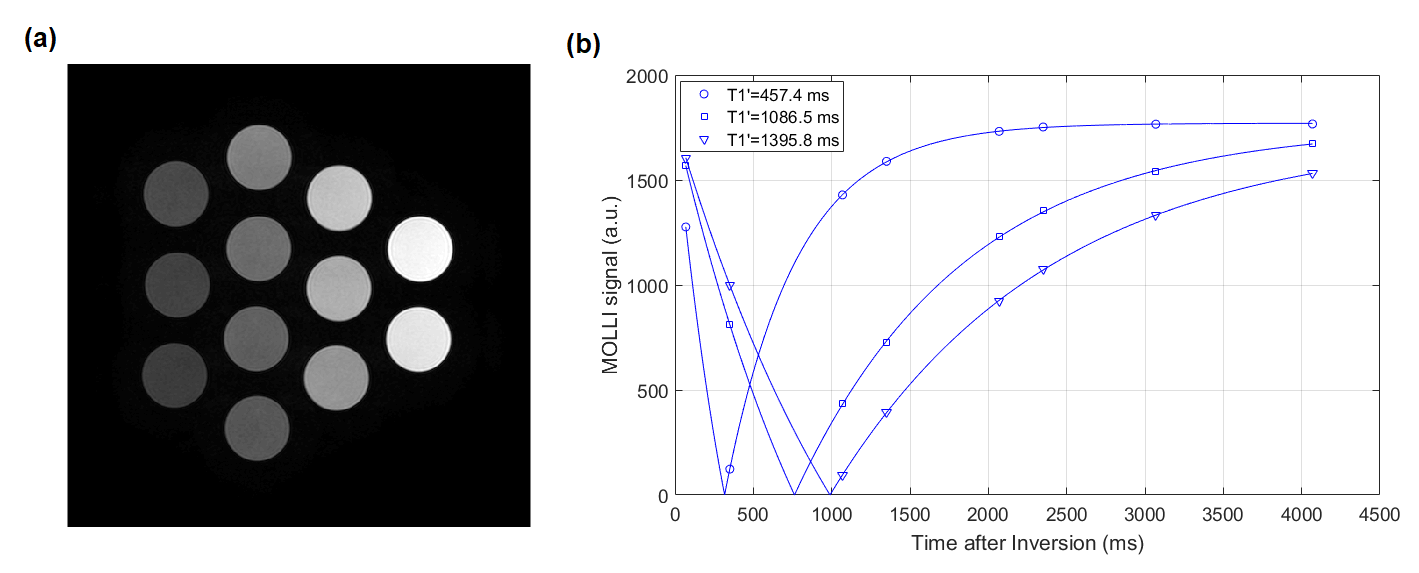
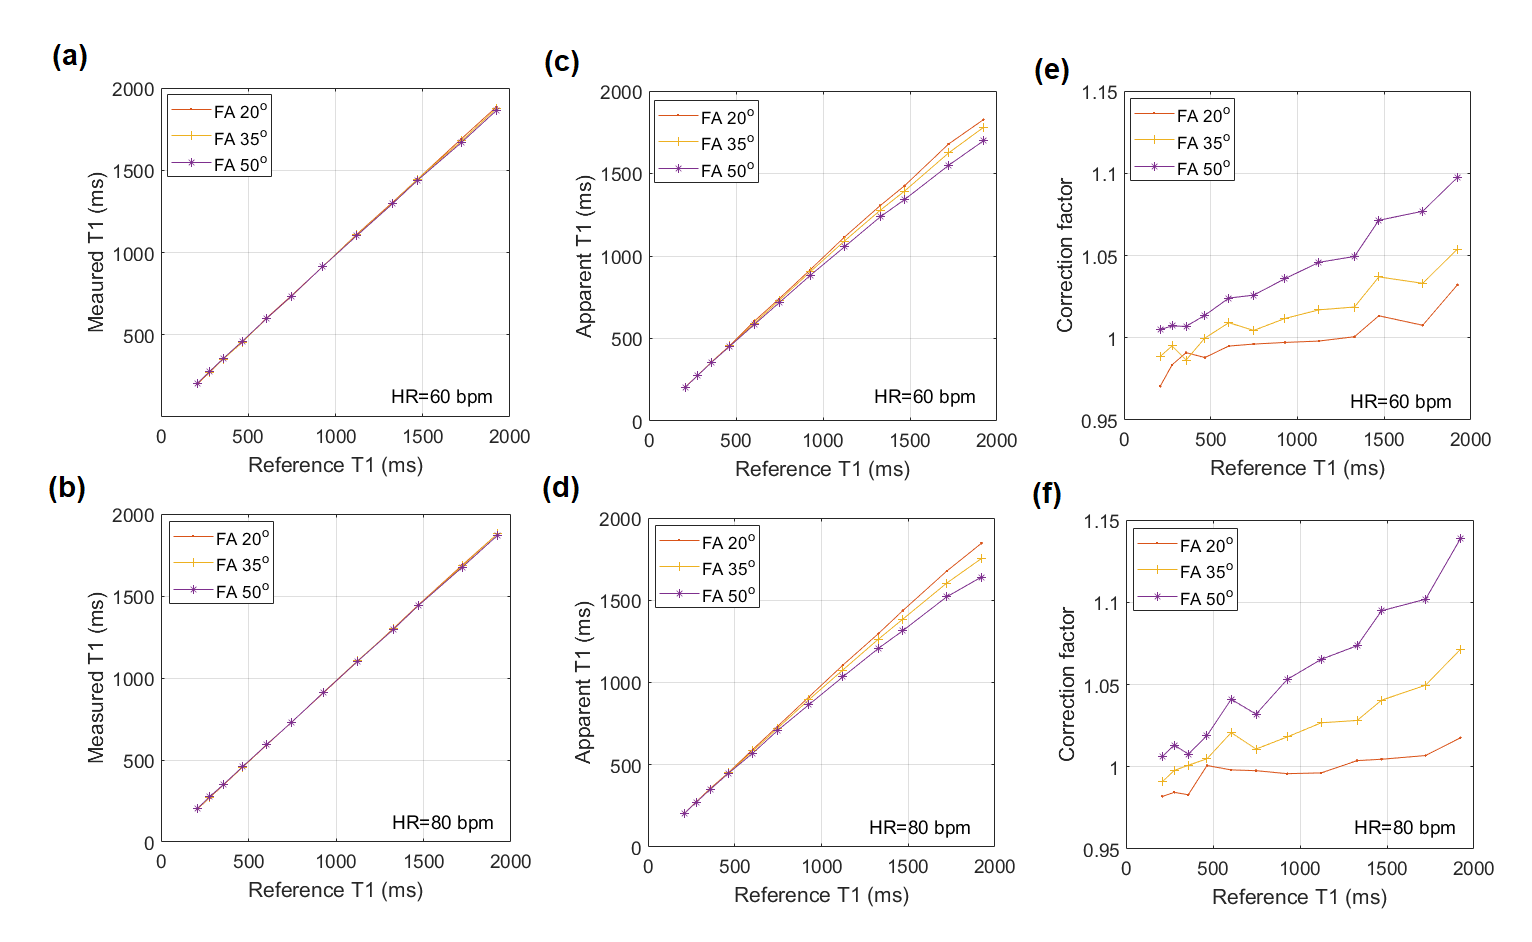
The T1-weighted MRI image covering the 12 vials of different T1 values is shown in Fig. 3(a). The MOLLI signal curves for a few vials are shown in Fig. 3(b) to illustrate the quality of data and their curve fitting. In Fig. 4(a) & (b), the actual T1 values measured by the MOLLI technique are compared to the reference values measured by the IR technique. Notably, the actual measured T1 values were not affected by the FA change, but the apparent T1 values, in (c) and (d), and the correction factors, in (e) and (f), were affected by the FA change.Discussion
The results shown in Fig. 4 suggest that, while the actual T1 values measured by the MOLLI technique were not affected by the change of the FA value (the B1 field), the apparent T1 values and the correction factors were affected by the change of the B1 field. Hence, this suggests the relaxation possibly due to the B1 field (i.e. T2rho) may be encoded in the MOLLI technique. Also noted is that, as the FA increases, the apparent T1 decreases away from the reference, which suggests the effect of T2rho is getting significant with the increasing B1 field.Conclusion
The apparent T1 and the correction factor, obtained but often overlooked in the MOLLI technique, may have some information about the relaxation under the B1 field, hence, the T2rho, which is sensitive to the iron content. As a relaxometry MRI tool, the MOLLI may be worthwhile to be explored to use in other applications including amyloid plaque detection.Acknowledgements
No acknowledgement found.References
1. Labranche R, et al. Liver Iron Quantification with MR Imaging: A Primer for Radiologists. RadioGraphics 38:2, 392-412 (2018)
2. Michaeli S, et al., Exchange-Influenced T2rho Contrast in Human Brain Images Measured with Adiabatic Radio Frequency Pulses, Magn Reson in Med 53:823–829 (2005)
3. Nestrasil S, et al., T1rho and T2rho MRI in the evaluation of Parkinson’s disease, J Neurol 257:964–968 (2010)
4. Messroghli DR, et al. Modified Look-Locker inversion recovery (MOLLI) for high-resolution T1 mapping of the heart. Magn Reson Med;52(1):141-146 (2004)
Figures