3604
Native T1 and T2 mapping cardiovascular magnetic resonance for detection of cardiac allograft vasculopathy after heart transplantation1Tokyo Women’s Medical University, Tokyo, Japan, 2Philips Japan, Tokyo, Japan
Synopsis
We investigate the diagnostic performance of native T1 and T2 mapping cardiovascular magnetic resonance imaging (CMR) for cardiac allograft vasculopathy (CAV) after heart transplantation, using myocardial flow reserve (MFR) estimated by 13N-ammonia (NH3) positron emission tomography (PET) as reference. Non-contrast native T1 mapping is a minimally invasive and effective method for monitoring CAV. In contrast, the effectiveness of T2 mapping could not be demonstrated.
Synopsis
We investigate the diagnostic performance of native T1 and T2 mapping cardiovascular magnetic resonance imaging (CMR) for cardiac allograft vasculopathy (CAV) after heart transplantation, using myocardial flow reserve (MFR) estimated by 13N-ammonia (NH3) positron emission tomography (PET) as reference. Non-contrast native T1 mapping is a minimally invasive and effective method for monitoring CAV. In contrast, the effectiveness of T2 mapping could not be demonstrated.Introduction
Cardiac allograft vasculopathy (CAV) is a leading cause of graft failure and death after heart transplantation. Absolute myocardial blood flow (MBF) quantification using 13N-ammonia (NH3) positron emission tomography (PET) enables evaluation of diffuse epicardial and microvascular disease in CAV1. On the other hand, tissue characterization by T1 and T2 mapping cardiovascular magnetic resonance imaging (CMR) is being clinically used to myocardial inflammation and edema in cardiomyopathy and myocarditis2. We aimed to evaluate native T1 and T2 mapping detection of CAV depicted by NH3-PET.Methods
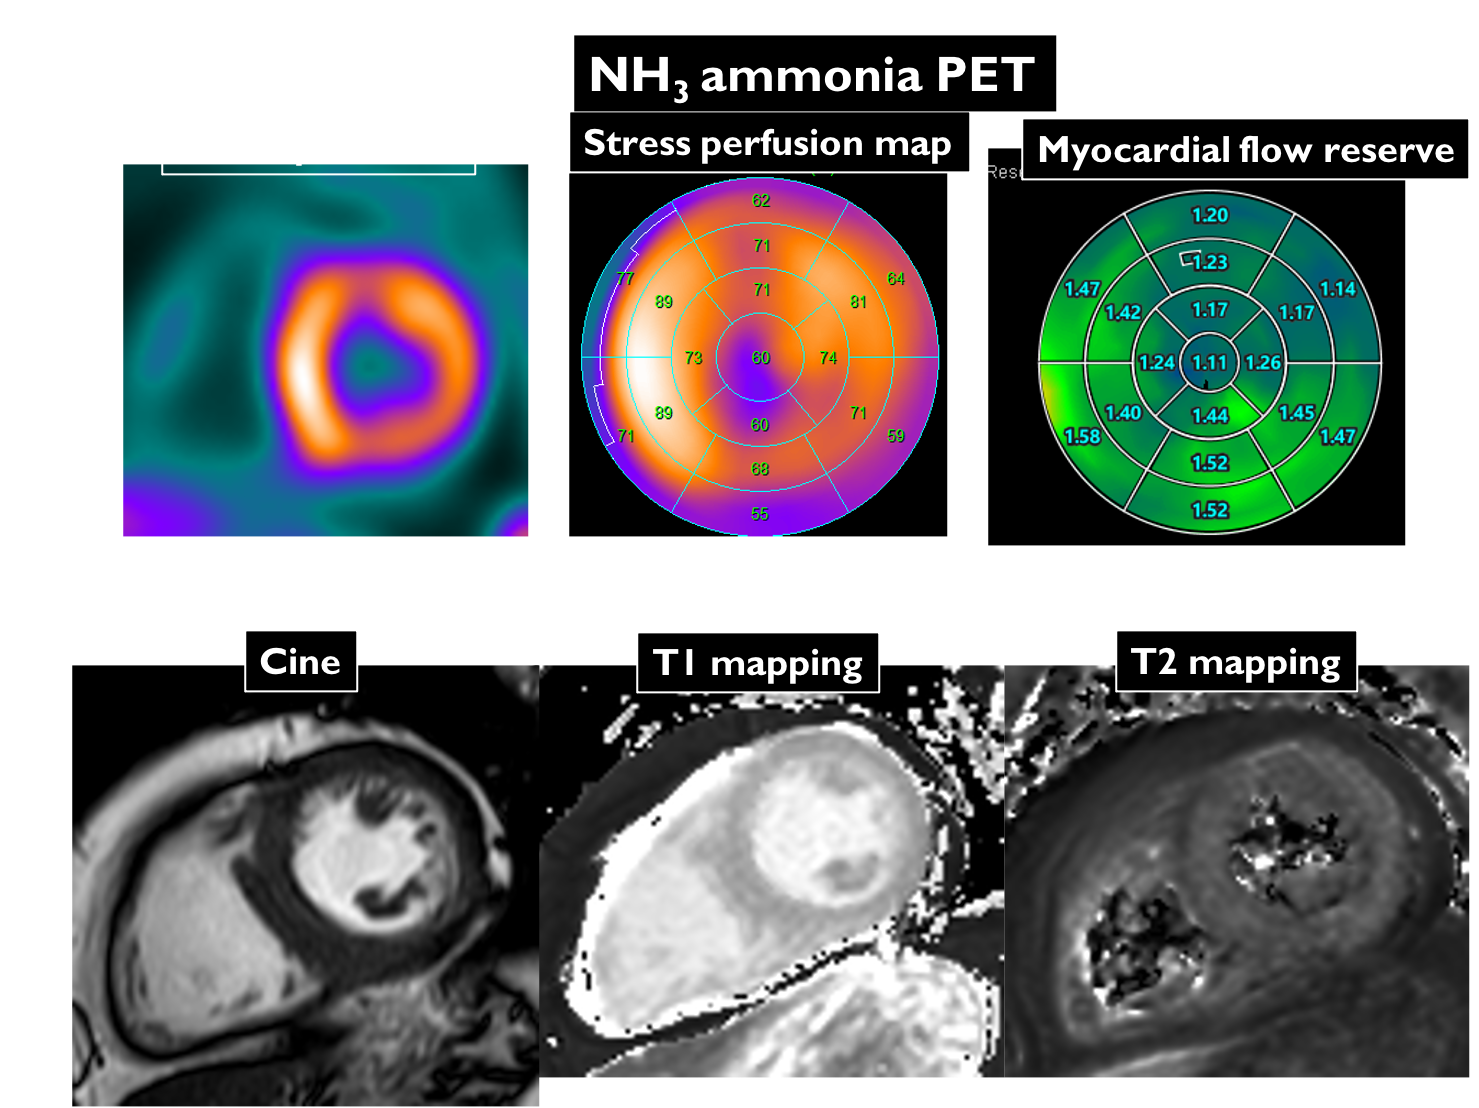
11 patients (mean age, 43 years; mean duration post transplantation, 15 years) after heart transplantation who underwent CMR with 3 tesla scanner (Ingenia 3T CX, Philips Healthcare) and NH3-PET were enrolled in this study. NH3-PET quantified the MBF at rest, hyperemia-induced adenosine, and myocardial flow reserve (MFR) as well as the ratio of MBF at stress to that at rest. MFR for the major vessels were calculated and MFR <2.0 was identified as the positive of CAV. CMR protocol consisted of standard cine imaging, T1 (modified Look-Locker inversion recovery sequence with a 3(3)5 scheme, MOLLI) and T2 mapping (hybrid gradient- and spin-echo multi-echo sequence, GraSE). T1 and T2 values in the anterior, septal, inferior, and lateral segments on mid-ventricular short-axis T1 and T2 mapping were measured. The presence or absence of CAV in each segment was determined based on the MFR.Results & Discussion
CAV was seen in 12 territories of 3 patients (27%). T1 value was significantly longer in territories with CAV than territories without CAV (1307±31ms. Vs. 1268±38ms, p<0.005). Using the cutoff 1301ms. of T1 value could distinguish territories with CAV from territories without CAV, with AUC of 0.80, a sensitivity of 67%, and a specificity of 78%. There was no significant difference in T2 value between territories with and without CAV (50.3±3.2ms. vs. 47.5±4.8ms, p=0.06) (Fig. 1).Myocardial fibrosis and edema associated with CAV in the long-term after transplantation reflected in native T1 prolongation. On the other hand, there are few cases with active inflammation due to rejection during this period. Even with CAV, the inflammation was minor and did not show a significant prolongation in T2 value. Native T1 mapping has high potential for clinical use in terms of non-invasive, with no contrast and radiation exposure required. A limitation of this study is that the association between pathological fibrosis and T1 values has not been investigated. The comparison of pathological findings and T1 and T2 mapping will be the next research theme.Conclusion
Native T1 mapping has high diagnostic accuracy for CAV, with potential noninvasive evaluation after heart transplantation. In contrast, the effectiveness of T2 mapping could not be demonstrated.Acknowledgements
This work was supported by the Japan Society for the Promotion of Science (JSPS) KAKENHI (19K08209).References
1. Chih S, Chong AY, Erthal F, et al. PET assessment of epicardial intimal disease and microvascular dysfunction in cardiac allograft vasculopathy. Jacc 2018; 71: 1444-56.2.
2. Bohnen S, Radunski UK, Lund GK, et al. Tissue characterization by T1 and T2 mapping cardiovascular magnetic resonance imaging to monitor myocardial inflammation in healing myocarditis. Eur Heart J Cardiovasc Imaging 2017; 18: 744-751.
Figures