3600
A novel MOLLI T1 analysis method with data matching for reduced T1 underestimation1Faculty of Health Sciences, Kyorin University, Mitaka-shi, Tokyo, Japan
Synopsis
Myocardial T1 mapping using the modified Look-Locker inversion recovery (MOLLI) method shows good precision of T1 measurements, but their underestimation has long remained a problem in accurate T1 estimation. We developed a novel T1 analysis method by applying a data-matching strategy to the MOLLI method. The analysis method we propose estimates the T1 map by matching the MOLLI signals of a subject to dictionary data pixel-wise, which are the Look-Locker signals calculated in advance for various tissue parameters. The proposed method sufficiently reduces T1 underestimation of the MOLLI method and obtains more accurate T1 values.
Introduction
Myocardial T1 mapping allows for quantitative evaluation of myocardial tissue characteristics1, 2. Currently, the most common myocardial T1 mapping method is the modified Look-Locker inversion recovery (MOLLI) method proposed by Messroghli et al.2. While this method shows good precision of T1 measurements, their underestimation has long remained a problem in accurate T1 estimation1. In recent years, a new parameter-mapping concept using dictionary data matching called magnetic resonance fingerprinting3 has been introduced. It has been reported that the technique enables robust analysis of various factors that affect parameter mapping. We developed a novel T1 analysis method that enables us to overcome the problem of underestimation of the MOLLI method by applying the data-matching strategy to the MOLLI method and evaluated its feasibility.Methods
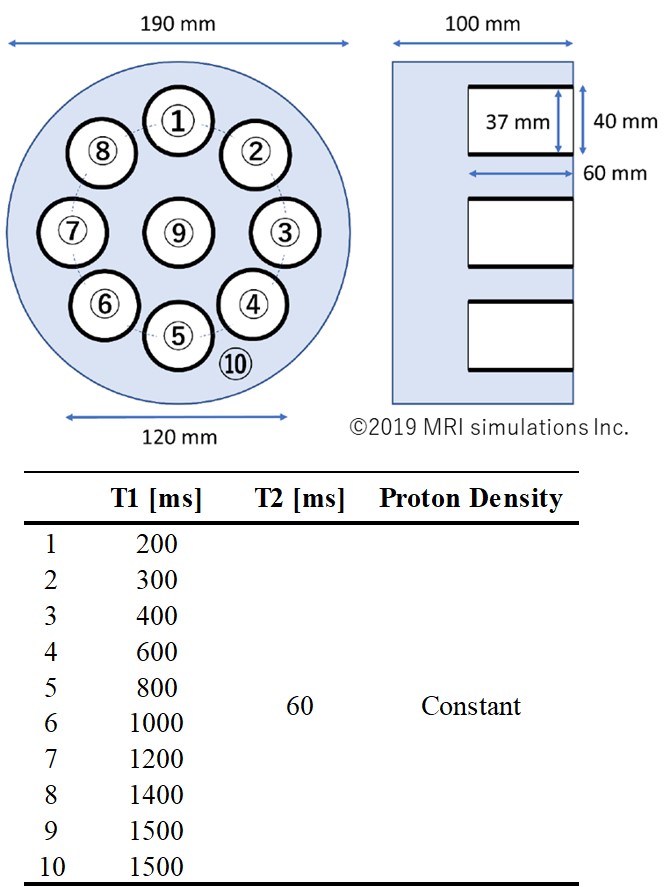
All data were acquired using a magnetic resonance imaging (MRI) simulator called BlochSolver4, which generates signals according to the Bloch equation. The signals were generated according to the setting conditions of the input digital phantom and pulse sequence code written in Python language. The scheme of the proposed T1 analysis was as follows. First, dictionary data for data matching were obtained in advance using BlochSolver. These were Look-Locker signals using the MOLLI sequence corresponding to various tissue parameters (T1 and T2). In this study, these parameters of the dictionary phantom were set in 10-ms increments from 50 ms to 2050 ms for T1 values. The proton density and T2 values were set to be constant. The subject phantom used for T1 measurements was a CAGN T1 phantom (Kato Medience Inc.) at a 3T, digitized for the use of Blochsolver. The phantom was scanned using the same MOLLI sequence used to acquire dictionary data. Figure 1 shows the structure of the phantom and its tissue parameters. The proton density and T2 values were set to be constant as well for T1 measurements in this study. Finally, data matching was performed between the Look-Locker signals of the subject phantom and dictionary data, and a T1 map was obtained with the tissue parameters (T1) of the subject phantom estimated in a pixel-wise manner. The MOLLI sequence implemented in BlochSolver was a fast low-angle shot (FLASH) base pulse sequence with the radiofrequency-spoiled gradient echo. The scanning conditions of the MOLLI sequence for TR/TE, FA and the matrix were 3.9/1.8 ms, 10°, and 120×176, respectively. We used the MOLLI protocol of 5(3)3 with TI settings at 140 ms. The data matching was performed with L2 regularization between the subject data and dictionary data. For comparison, conventional analysis, which uses the 3-parameter fit model for estimating A, B, and T1*, was also used. The equation was as follows: S (TI) = A - B exp (-TI / T1*). T1 values were calculated from A, B, and T1*: T1 = T1*(B/A - 1).Results
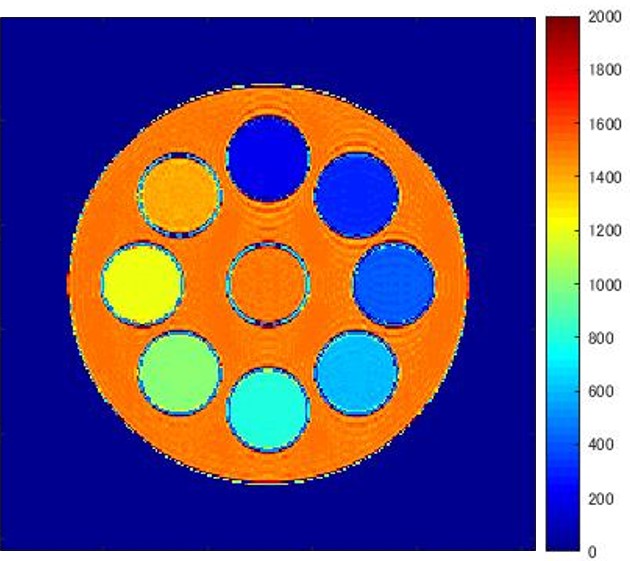
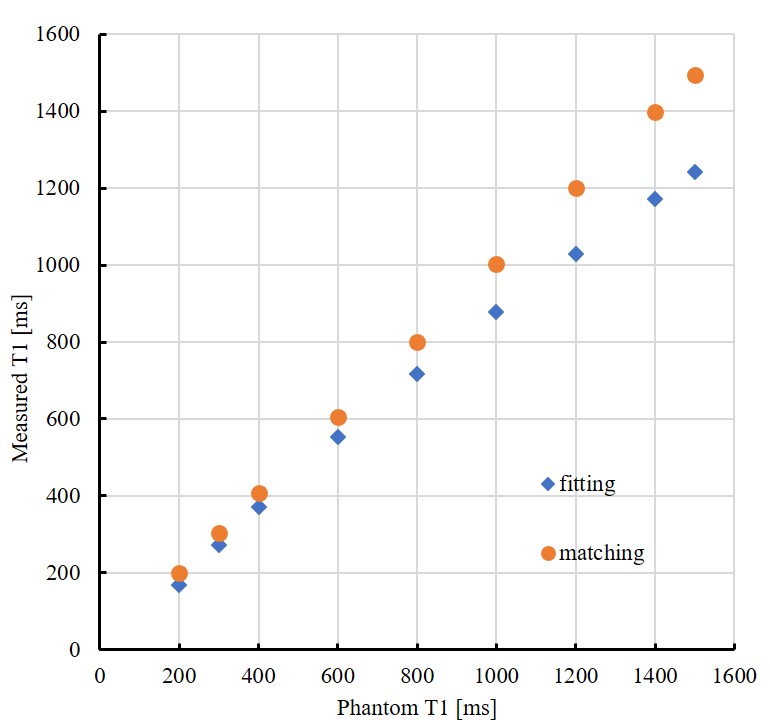
Figure 2 shows the T1 map obtained using the proposed data-matching analysis method. Figure 3 shows a comparison of the measured T1 values obtained using the conventional and data-matching analysis methods. In the analysis using the conventional three-parameter fit model, the measured T1 values were underestimated to the true T1 values, and the maximum error was 17% for T1 values of 1500 ms. Meanwhile, the proposed analysis method using data matching for dictionary data showed good measurement accuracy for the true value, and the error was less than 1% at maximum.Discussion and Conclusion
The results showed that the proposed analysis method reduces underestimation of the T1 values measured using the MOLLI method compared to those obtained using the conventional analysis method. Although further investigation in MRI scanners is needed for clinical use, this proposed method is expected to be beneficial for clinical use because it can be used to acquire more accurate T1 measurements using the widely used MOLLI method without a special pulse sequence such as magnetic resonance fingerprinting.Acknowledgements
None.References
1. Peter Kellman, Michael S Hansen. T1-mapping in the heart: accuracy and precision. J Cardiovasc Magn Reson 2014;16:2
2. Daniel R Messroghli, et al. Modified look-locker inversion recovery (MOLLI) for high- resolution T1 mapping of the heart. Magn Reson Med 2004;52:141-146
3. Dan Ma, et al. Magnetic resonance fingerprinting. Nature 2013;495:187-192
4. Ryoichi Kose, Katsumi Kose. BlochSolver: a GPU-optimized fast 3D MRI simulator for experimentally compatible pulse sequences. J Magn Reson 2017;281:51-65
Figures