3599
ProMyoT1: Open-source Inversion recovery myocardial T1 mapping sequence for fast prototyping1Institute for Systems and Robotics - Lisboa and Department of Bioengineering, Instituto Superior Técnico, Universidade de Lisboa, Lisboa, Portugal, 2Hospital da Luz Learning Health, Lisboa, Portugal
Synopsis
T1 mapping is a crucial technique for myocardial tissue characterization. T1-mapping MOLLI sequences are widely used in the clinic but fast prototyping for concept testing and improvements is challenging and time consuming as it requires knowledge of the vendor specific programming environment. The use of an open-source framework would enable faster sequence prototyping, and facilitate reproducibility studies of new T1 mapping techniques. The aim of this work is to develop an open-source Prototype of Myocardial T1 mapping (ProMyoT1) using Pulseq to implement an inversion recovery T1 mapping sequence based on the MOLLI inversion/triggering scheme.
Introduction
T1 mapping is a crucial technique for myocardial tissue characterization, for which MOLLI is one of the most clinically used methods due to it’s high precision.1 Still, it suffers from a few drawbacks, such as limited anatomical coverage, which warrant further sequence improvements. Unfortunately, these require access and proficiency in the vendor specific programming environment. The use of an open-source framework would enable faster sequence prototyping, facilitating reproducibility studies across vendors and centers. We employ Pulseq, an open source tool which allows generating a sequence file describing all events (e.g. gradient and RF pulses, as well as triggering and data collection), readable at present by Bruker, Siemens and GE equipment.2The aim of this work is to develop an open-source Prototype of Myocardial T1 mapping (ProMyoT1) using Pulseq2 to implement an inversion recovery T1 mapping sequence based on the MOLLI inversion/triggering scheme to: 1) improve accessibility to cardiac T1 mapping and enable faster implementation and testing of sequence modifications; 2) allow inter-scanner and cross-vendor reproducibility studies to be performed more easily.
Methods
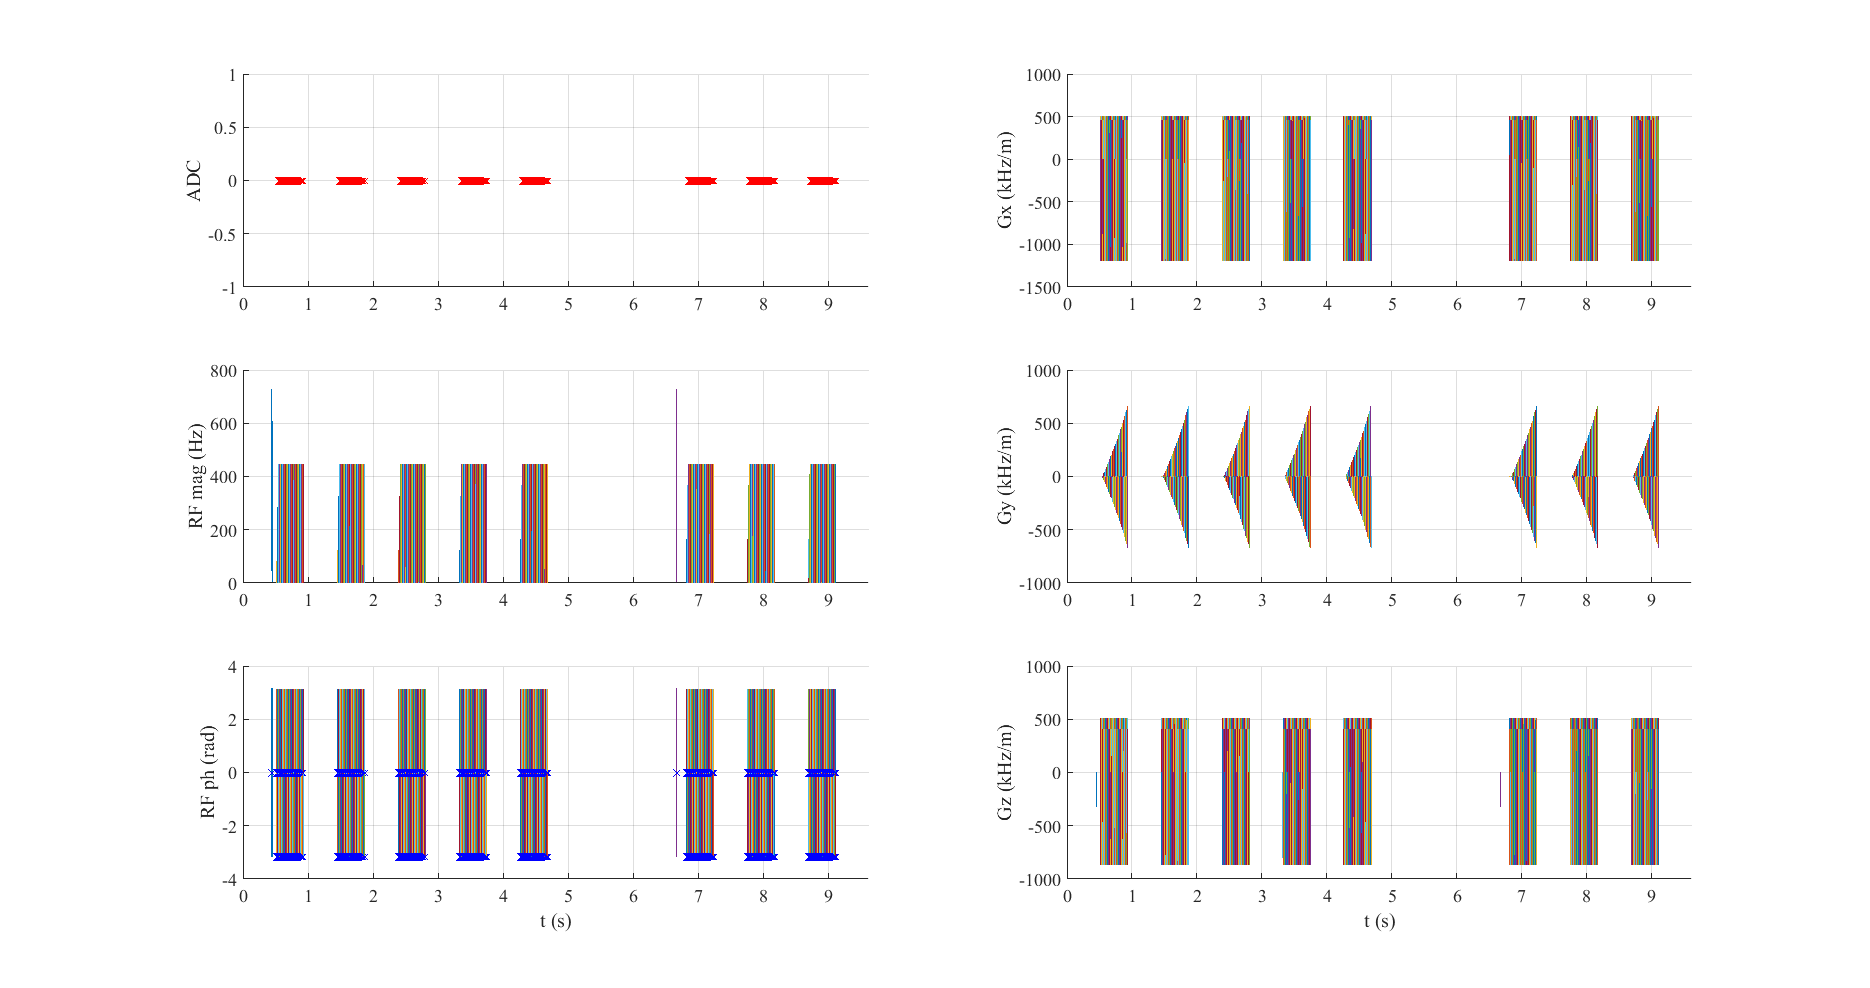
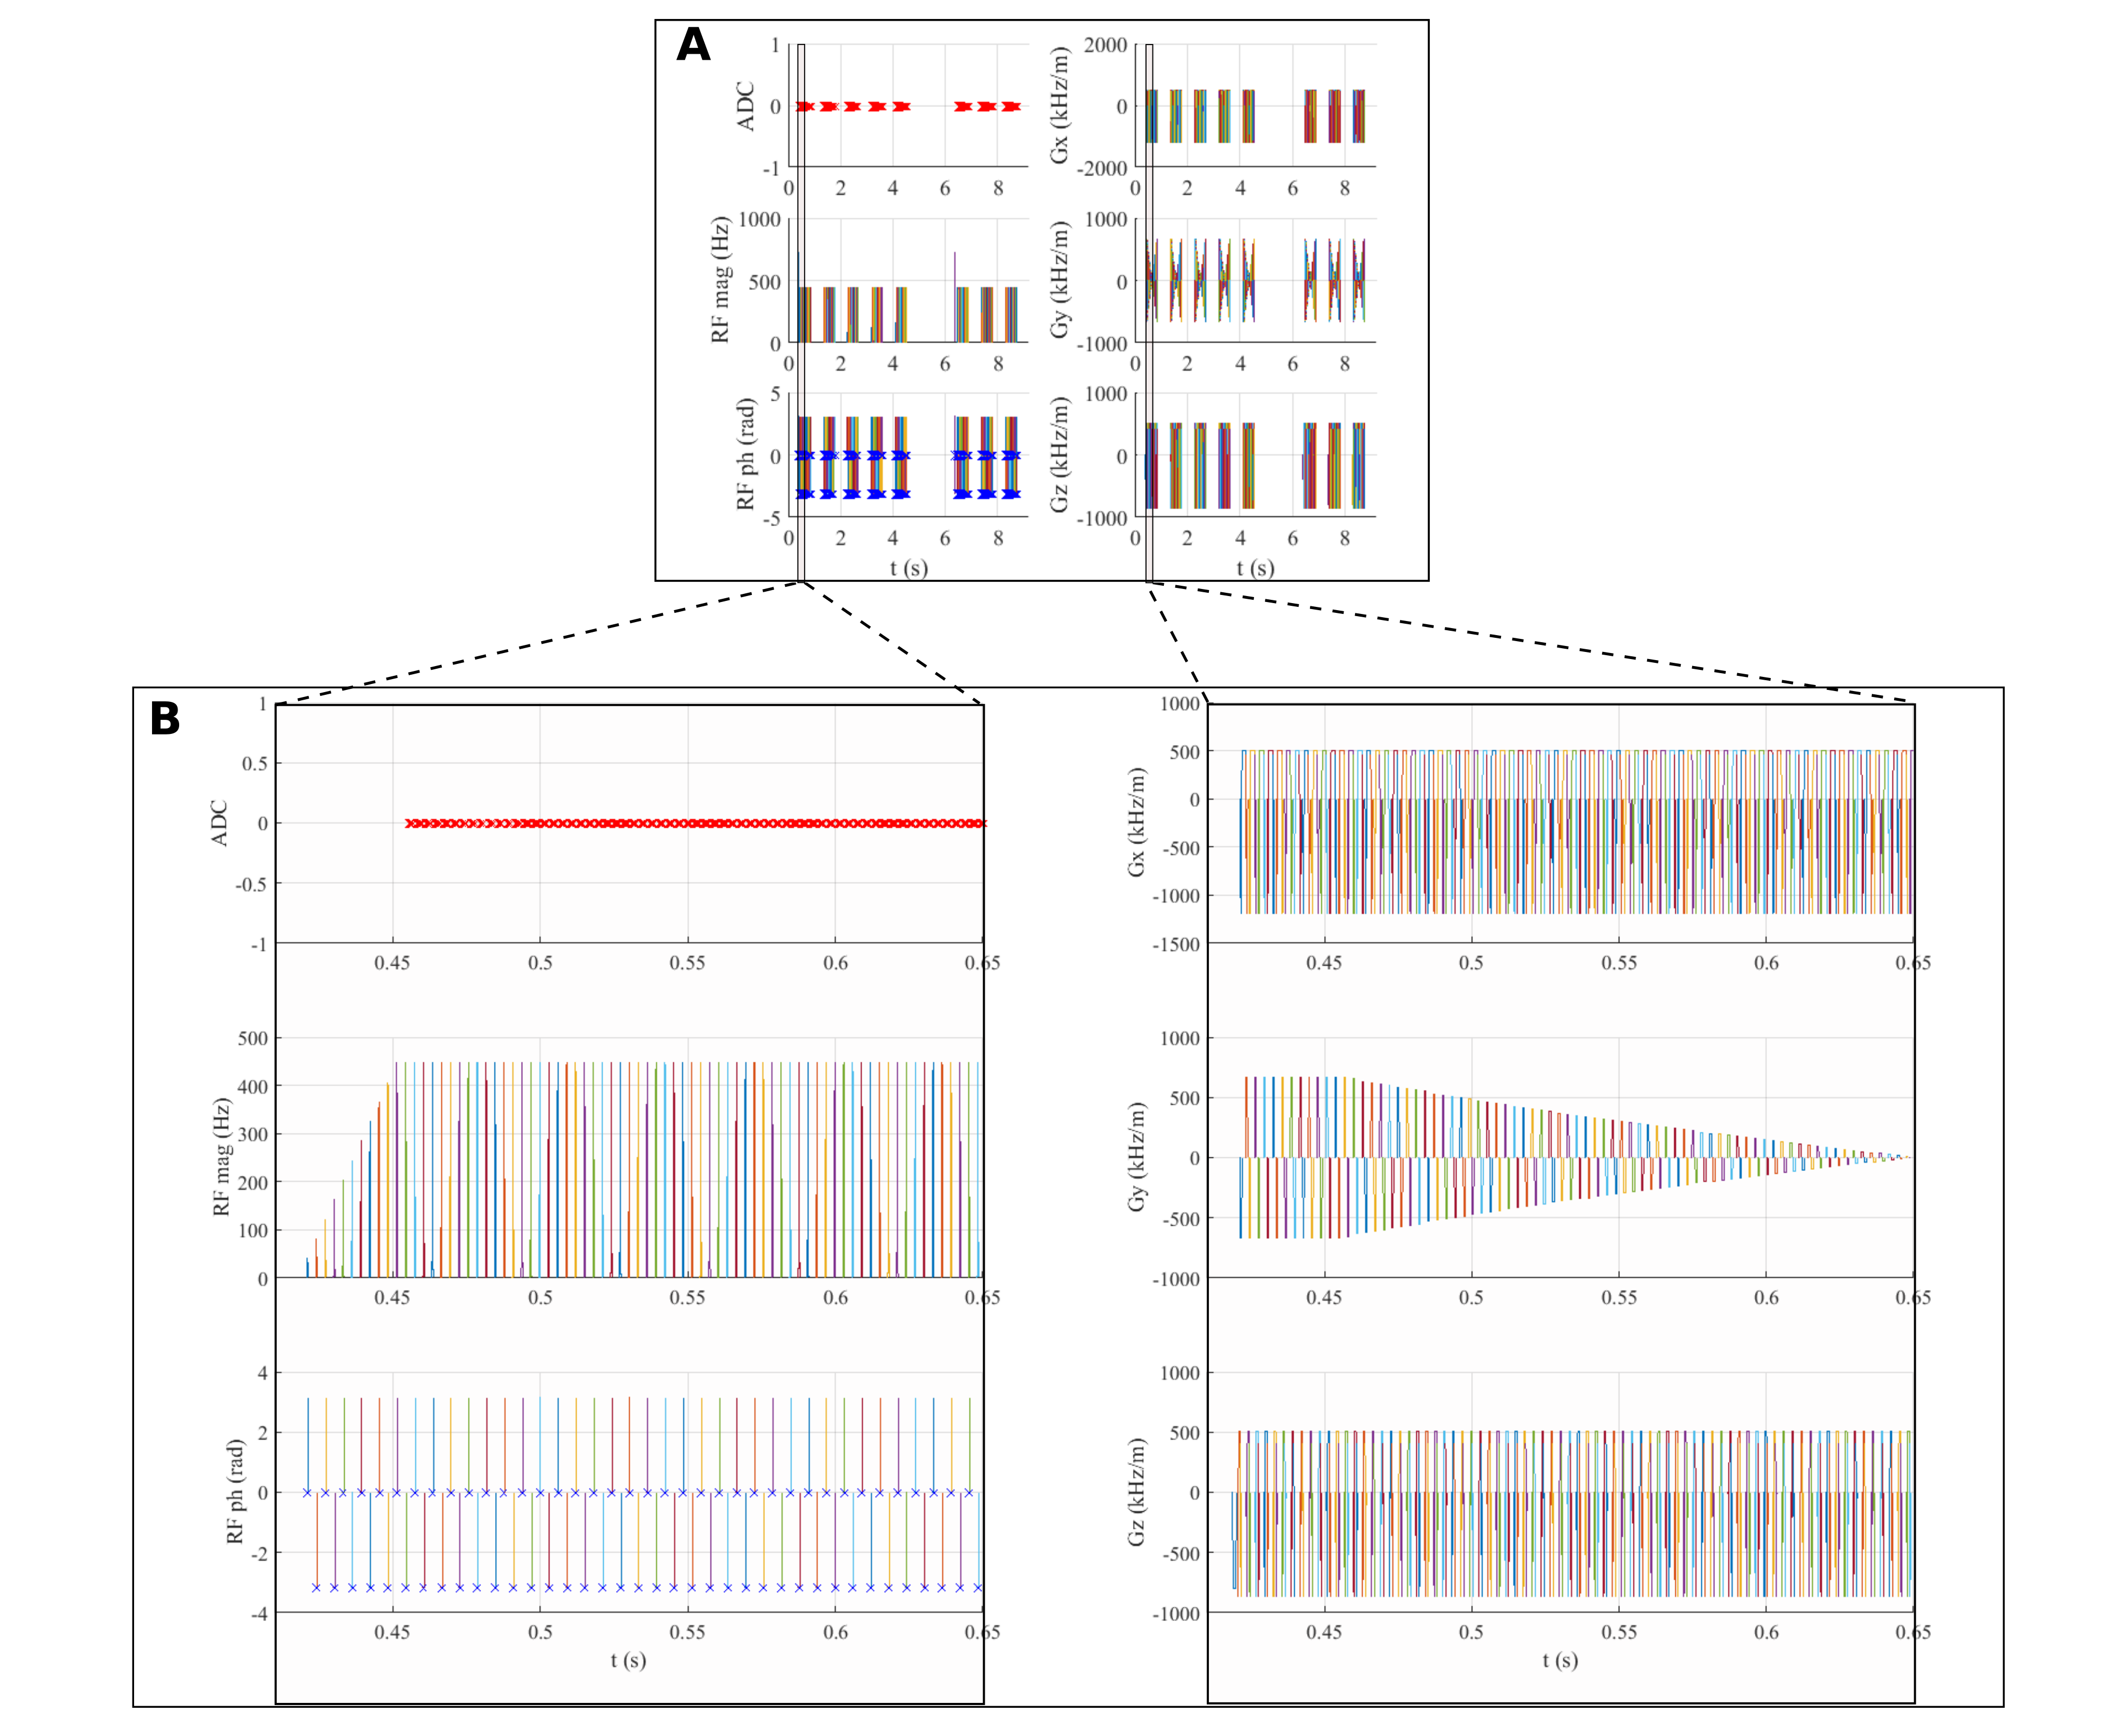
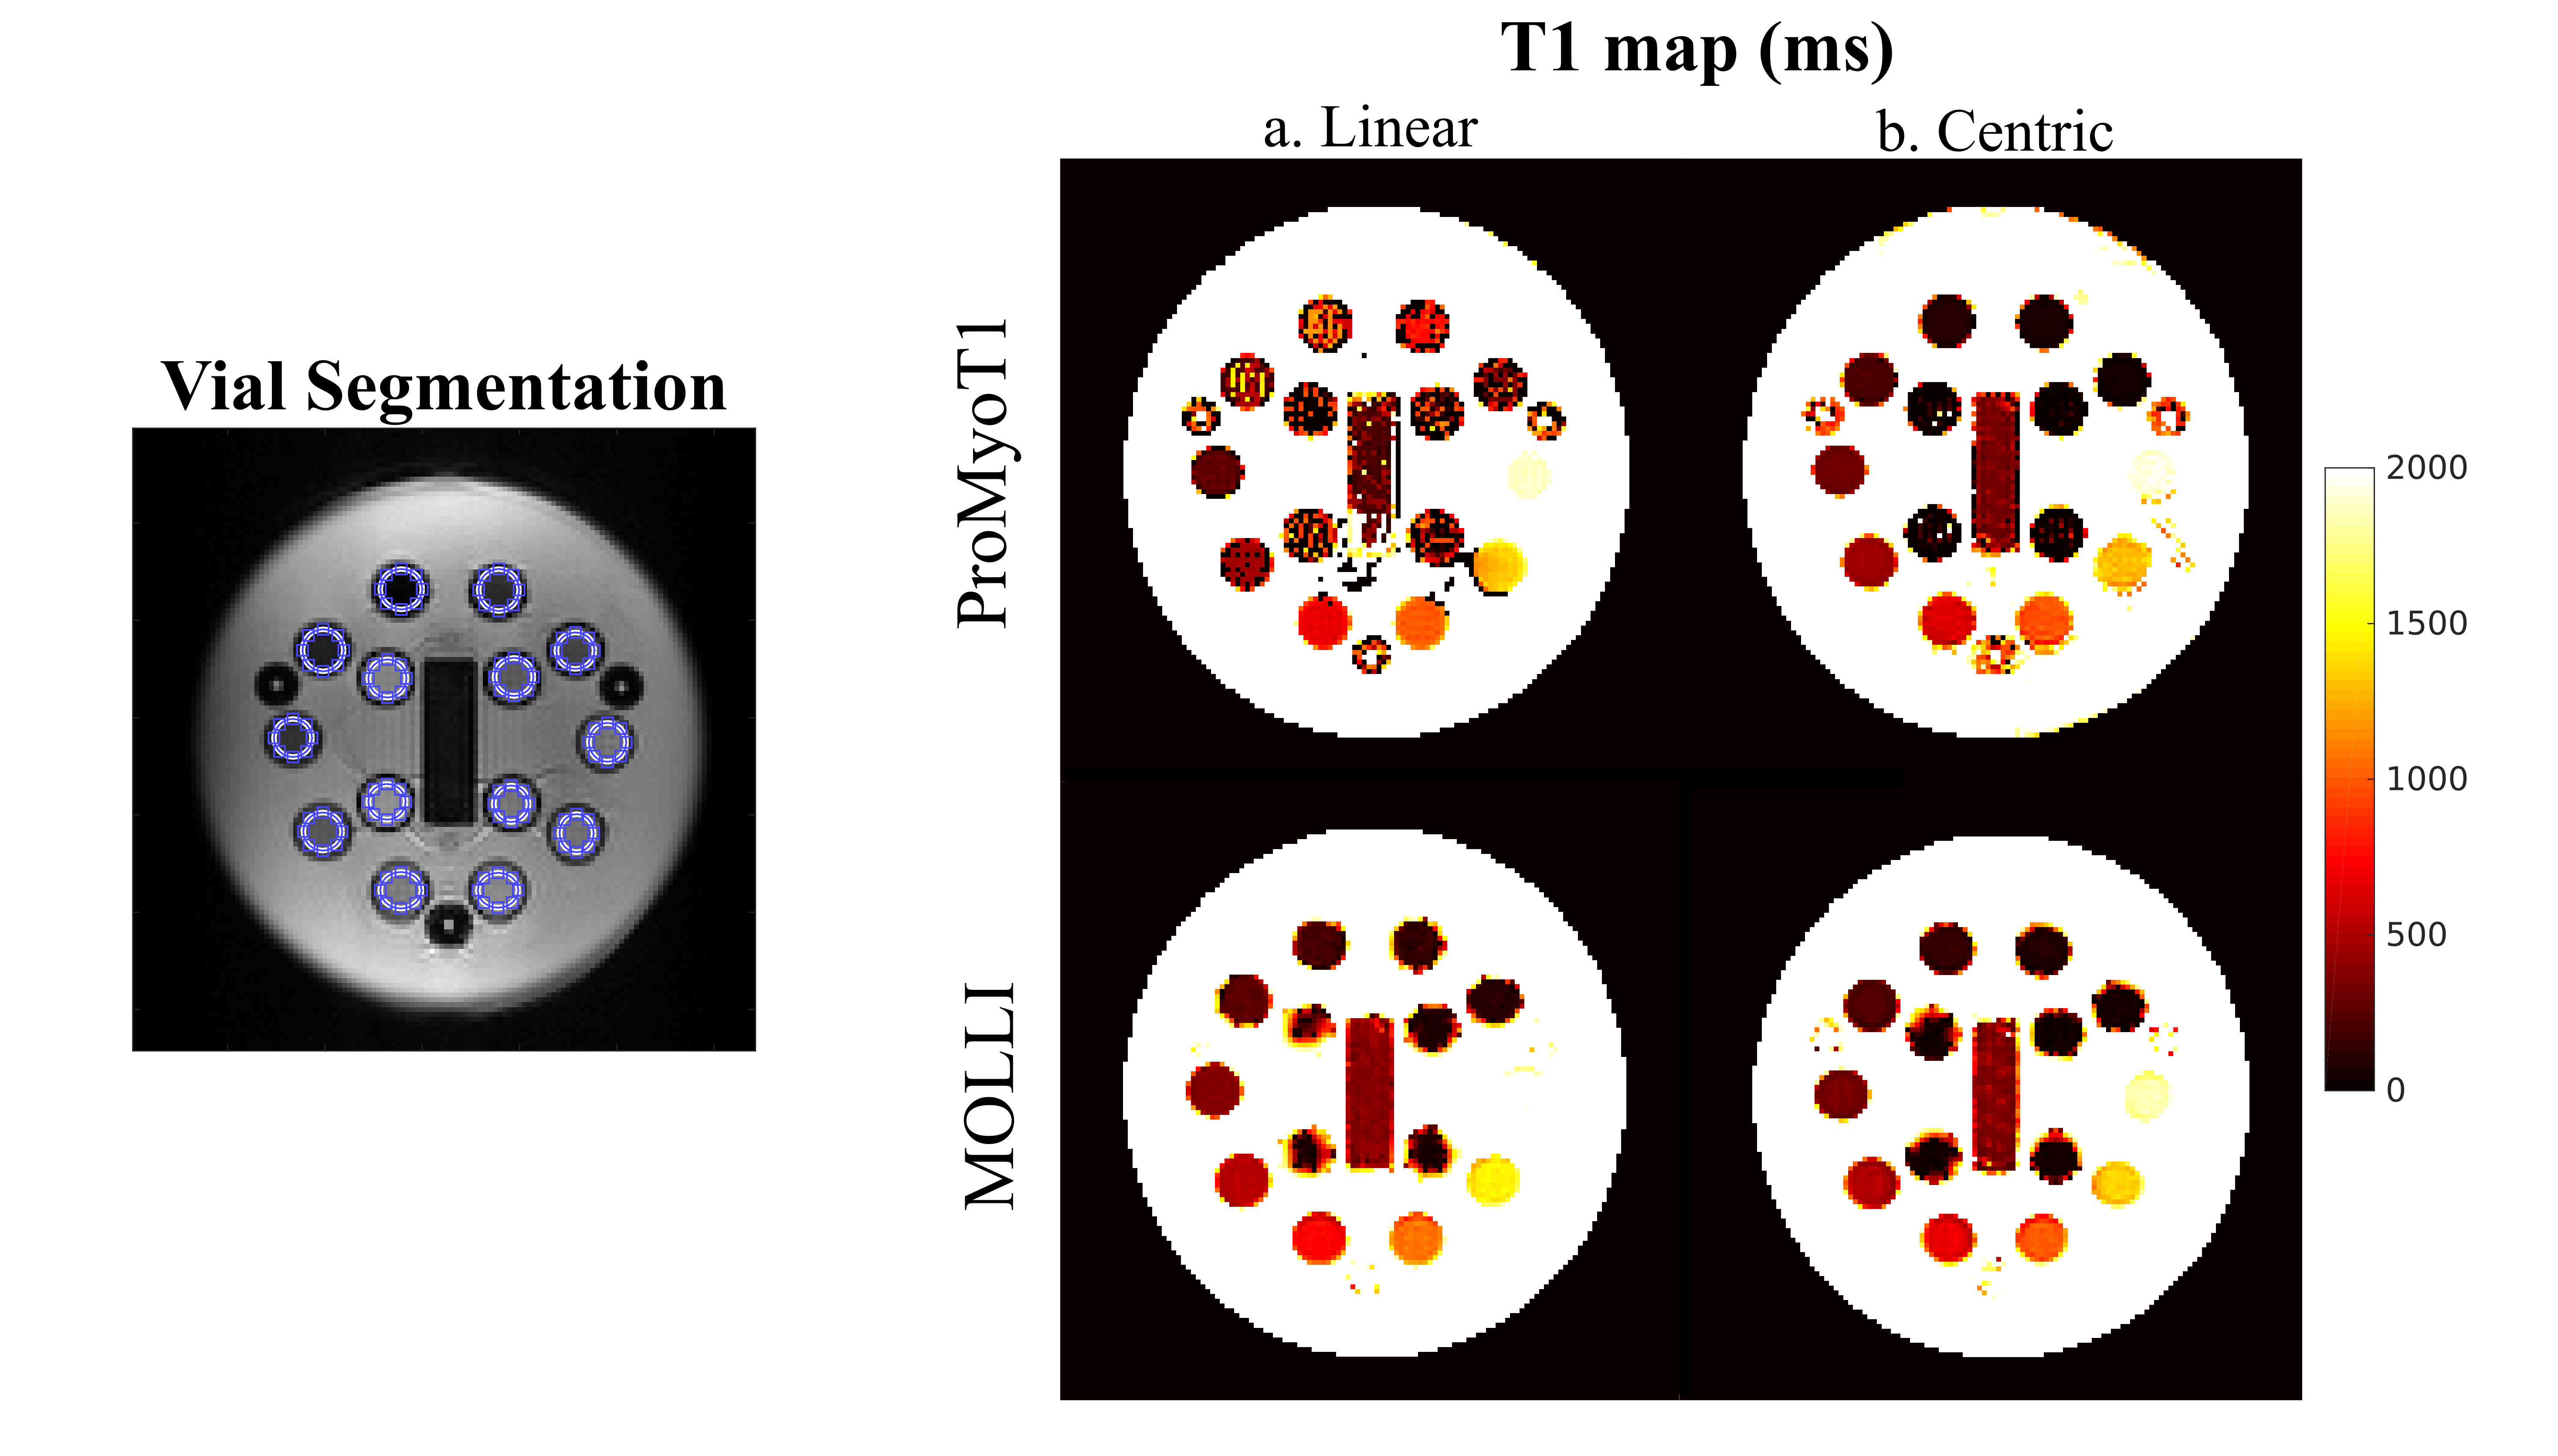
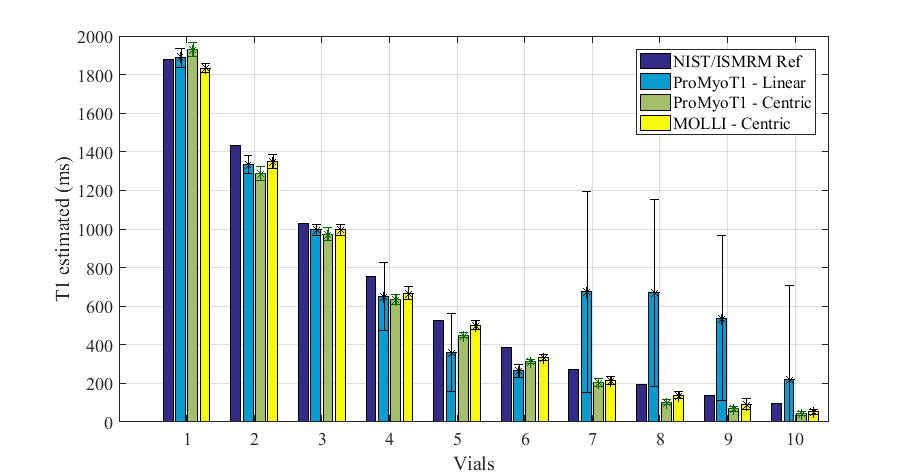
An inversion-recovery sequence using a balanced steady-state free precession (bSSFP) readout, with inversion and triggering schemes based on the MOLLI sequence was developed in Pulseq for Matlab with the following parameters: TR/TE=3.04/1.52 ms, bSSFP readout after a linear ramp-up of 11 pulses, a sinc RF pulse excitation pulse (490 µs) with flip angle of 35º, slice thickness of 6 mm, 200×200 mm2 field-of-view (FOV), and 128×128 matrix size (Fig. 1 and 2). Linear and centric filling orders were implemented. An adiabatic hyperbolic secant non-selective inversion RF pulse with duration 10.24 ms was applied.3 Physiologic triggering was incorporated into the sequence according to a 5(3)3 scheme, with a trigger delay of 550 ms considering a simulated ECG signal at RR=1000 ms.4 Initial times of inversion (TI) were 100 ms and 180 ms for centric filling; the minimum TI allowed for linear filling (218 ms) was applied. ProMyoT1 implementation is available at https://github.com/ANG13/ProMyoT1.The sequence was tested in a Siemens Aera 1.5 T scanner in the ISMRM/NIST phantom.5 Image reconstruction and T1 estimation were performed offline using Matlab; for T1 mapping the function lsqcurve was employed considering the 3-parameter model. Conservative segmentation of each vial of the ISMRM/NIST phantom was performed to avoid neighborhood contamination. Mean and standard deviation of T1 estimates were calculated for each vial (Fig. 4). The obtained T1 estimates were compared with the reference tabulated T1 values. A clinical MOLLI sequence with similar acquisition parameters (FOV=200x200 mm2; matrix 128x128, slice thickness 7 mm; TR/TE=2.91/1.45 ms) was also acquired.
Results
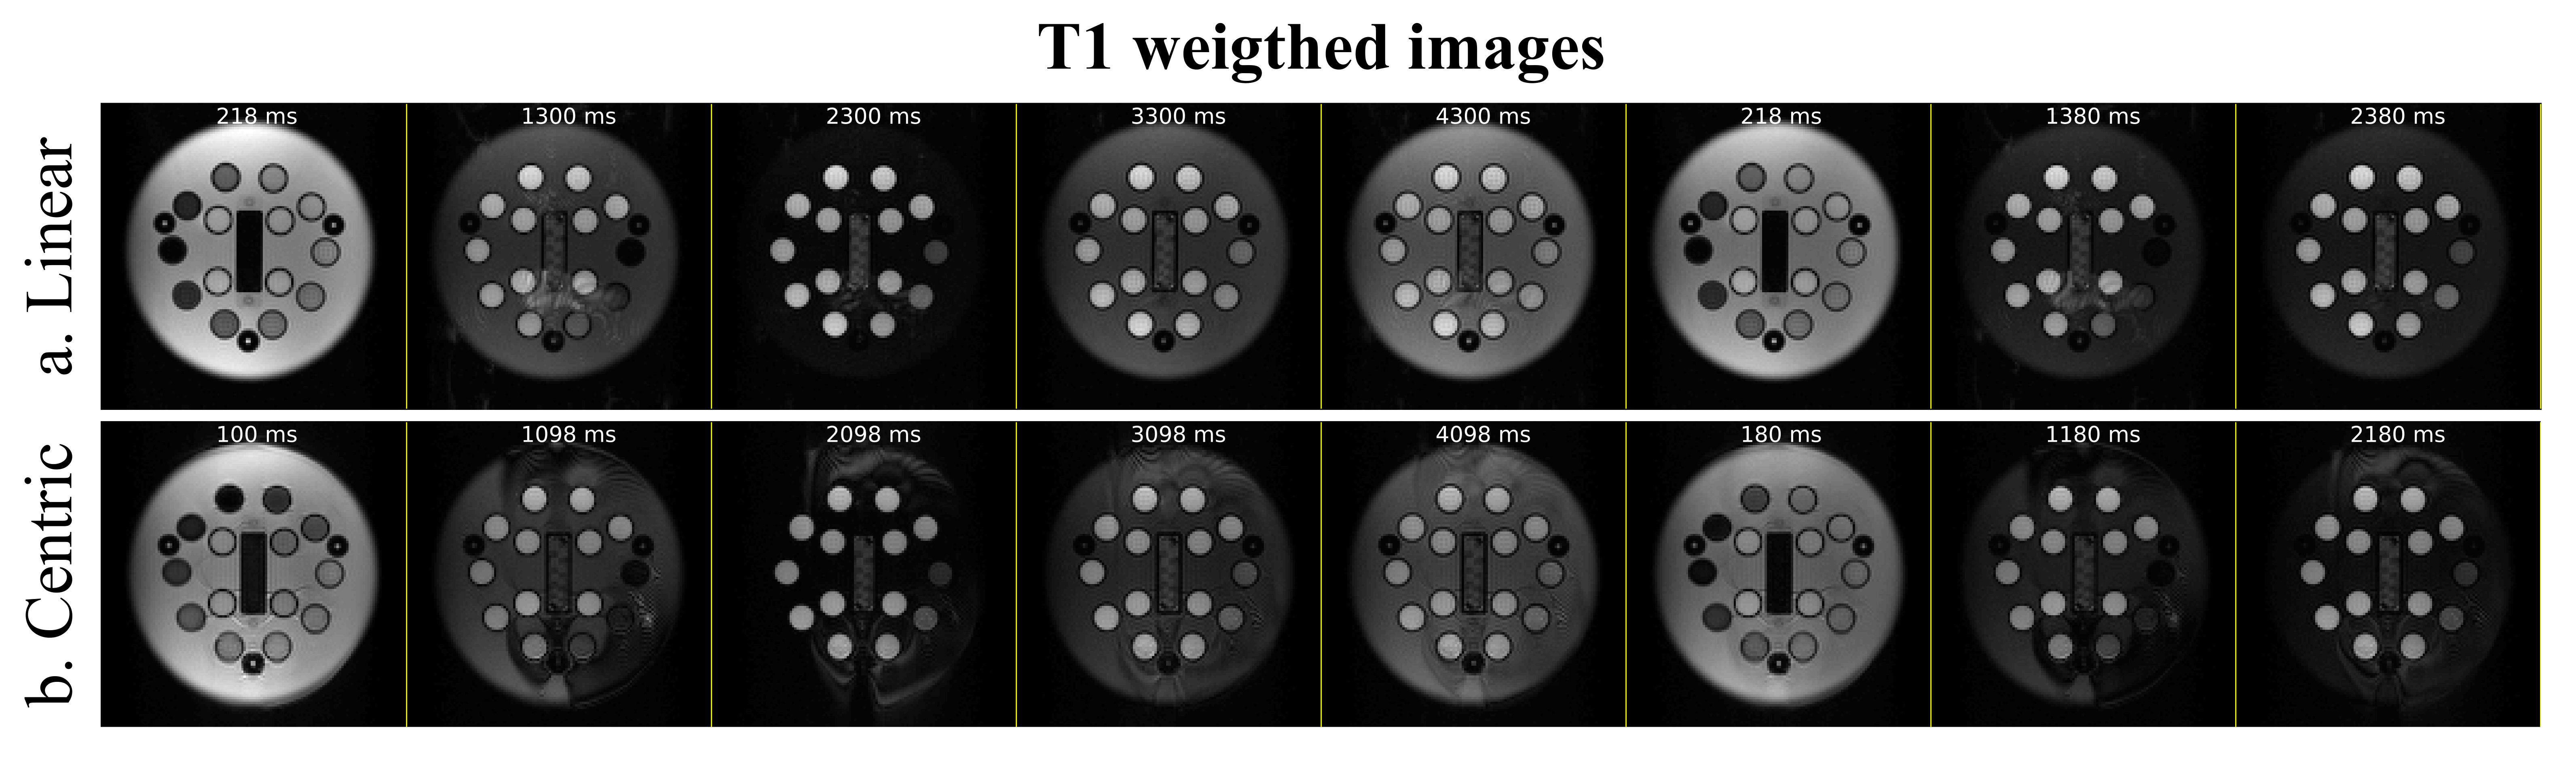
T1 weighted images acquired with the implemented open-source mapping sequence using linear and centric filling orders are presented in Fig. 3. The T1 weighted images obtained with linear filling order show less artefacts compared to the centric filling order images; this is likely to result from the higher sensitivity of the latter scheme to eddy currents resulting from fast gradient switching. The linear filling order acquisition was not able to correctly estimate T1 in vials with lower reference T1 (<300 ms), but for values similar to the typical T1 in the normal myocardium (T1 reference =1027 ms) the estimated T1 was 995±27 ms (Fig. 4 and 5). The centric approach was able to estimate T1 with errors between -18% to -3%, and the T1 estimate was 973±32 ms for a reference T1 of 1027 ms. Similar results were obtained with the clinical MOLLI sequence (Fig. 5) for which the T1 estimated for that same vial was 995±30 ms.Discussion
ProMyoT1 allowed to estimate T1 values similar to the ones obtained with a clinically used method. The overestimation observed when using the linear filling order acquisitions for lower reference T1 values may be due to the limitation in the minimum attainable inversion time (218 ms in contrast to 100 ms used for the centric implementation). Although this was a preliminary study, and despite the presence of visible artefacts in the T1 weighted images obtained using the centric acquisition, it was possible to correctly estimate the T1 values without visible variations within each vial in the final map, and obtain a good agreement with the reference clinical MOLLI sequence. In both tested ProMyoT1 implementations, the discrepancy observed relative to the tabulated NIST T1 values are in line with those described in the literature for T1 values typical of healthy myocardium.6 In the near future, the source of the observed artefacts, likely to be related to eddy-current effects, will be investigated and mitigation strategies will be implemented. ProMyoT1 with radial readout for fast acquisition will be studied.Conclusion
ProMyoT1 is the groundwork for further developments of myocardium T1 mapping. Its accessibility allows faster implementation of new ideas, while its applicability to different vendors makes it an easier route to study reproducibility of new methods. Further work involves testing ProMyoT1 in different scanners and in vivo for reproducibility. In addition, ProMyoT1 with faster non-cartesian readouts is being developed.Acknowledgements
Fundação para a Ciência e a Tecnologia (SFRH/BD/120006/2016, PTDC/EMD-EMD/29686/2017) e Programa Operacional Regional de Lisboa 2020 (LISBOA-01-0145-FEDER-029686).References
[1] Messroghli DR, Greiser A, Fröhlich M, et al. Optimization and validation of a fully-integrated pulse sequence for modified look-locker inversion-recovery (MOLLI) T1 mapping of the heart. J Magn Reson Imaging. 2007;26(4):1081-1086.
[2] Layton KJ, Kroboth S, Jia F, et al. Pulseq: A rapid and hardware‐independent pulse sequence prototyping framework. Magn Reson Med. 2017;77: 1544-1552.
[3] Kellman P, Herzka DA, Hansen MS. Adiabatic inversion pulses for myocardial T1 mapping. Magn Reson Med 2014;71:1428-1434.
[4] Layton K, Zaitsev M, Kroboth S. Open file format for MR sequences Version 1.3.0. University Medical Centre Freiburg. 2019. Accessed: https://pulseq.github.io/specification.pdf
[5] Jiang Y, Ma D, Keenan KE, et al. Repeatability of magnetic resonance fingerprinting T1 and T2 estimates assessed using the ISMRM/NIST MRI system phantom. Magn Reson Med. 2017;78(4):1452–1457.
[6] Kellman P, Hansen MS. T1-mapping in the heart: accuracy and precision. J Cardiovasc Magn Reson. 2014;16:2.
Figures