3597
T2* VERSUS NATIVE T1, T2 MAPPING IN PATIENTS WITH SUSPECTED MYOCARDIAL IRON OVERLOAD1Department of Radiology, Christian Medical College, Vellore, India
Synopsis
Parametric techniques like native T1 and T2 mapping showed a strong positive correlation with T2* in the non-invasive assessment of cardiac iron overload. T1 mapping was shown to be superior to T2 mapping in the diagnosis of cardiac iron overload. 30% of the study population had normal T2* values, but low T1 values. T1 mapping may be more sensitive in the detection of patients with early/mild cardiac iron overload, who are being missed by T2*.
Introduction
In patients requiring repeated blood transfusions, myocardial iron quantification is essential in preventing iron overload cardiomyopathy, managing chelation therapy, and monitoring treatment response during follow-up. T2* imaging has been the most used technique in the non-invasive assessment of cardiac iron overload1. Native T1, T2 mapping values are also known to reduce with iron overload. The purpose of the study design was to i) determine the native myocardial T1, T2, and T2* values in patients with suspected cardiac iron overload ii) to determine the level of correlation between native myocardial T1, T2, serum ferritin, cardiac function parameters and T2* values iii) to compare T1 and T2 mapping in the estimation of cardiac iron overloadMethods
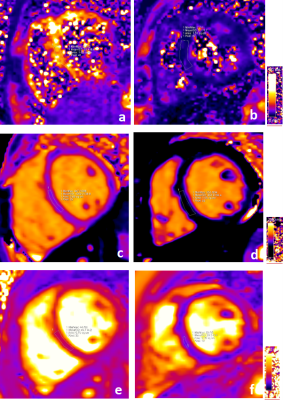
Forty consecutive patients with suspected iron overload referred for MRI assessment were included in the study after informed consent. The study was performed on a 1.5T clinical MRI scanner (Siemens Magnetom Avanto fit, Erlangen, Germany). Short axis cine SSFP images were acquired through the ventricles. Single mid-ventricular short-axis slices were obtained for T2*, T1, and T2 mapping using MyoMaps. Manually drawn large ROIs (>20 pixels) placed in the mid myocardium were used to measure the T2*, T1, and T2 values - See Figure 1. Left ventricular function was calculated using standard post-processing software (Siemens syngo workstation).Results
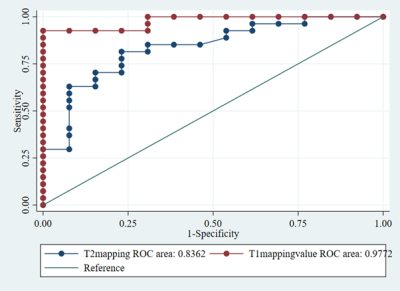
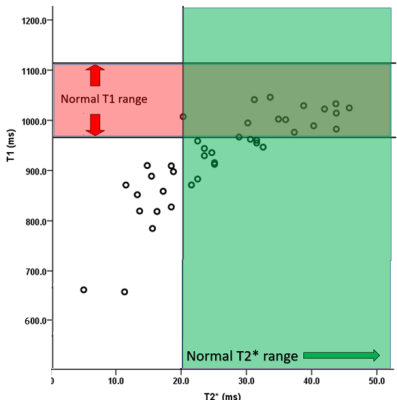
Of the 40 patients studied, 27 patients (67.5%) had no evidence of cardiac iron overload (CIO); whereas 13 patients (32.5%) had evidence of cardiac iron overload diagnosed as T2* value< 20ms. Among the 13 patients, 7 had mild cardiac iron overload (T2* of 15-20ms); 5 had moderate cardiac iron overload (T2* of 10-15ms); 1 had severe cardiac iron overload (T2* <10ms). A strong positive correlation was established between cardiac T2* and T1 mapping (r=0.821) (p <0.001) and between cardiac T2* and T2 mapping (r=0.828)(p <0.001) in the overall study population. For the mean T1 and T2 values in patients with and without cardiac iron overload -see Figure 2. Among the patients with cardiac iron overload, a strong positive correlation was established between cardiac T2* and T1 mapping (r=0.771) (p = 0.002), and a moderate positive correlation was established between cardiac T2* and T1 mapping (r=0.642) (p = 0.018).T1 mapping was shown to be superior to T2 mapping (p-value = 0.02) in the diagnosis of cardiac iron overload (with T2* as reference standard) – See Figure 3. 30% of the study population had normal T2* values, but low T1 values (<966ms). The normal range for T1 mapping established in our institution on this scanner is 1040 + 74 ms. Other parameters like patient age, serum ferritin, and cardiac function showed only weak correlations with cardiac T2*, T1, and T2 mapping.
Discussion
Our results showed the entire spectrum of cardiac iron deposition ranging from normal to severe iron deposition. The strong positive correlation between cardiac T2* and T1, T2 mapping is consistent with several previous studies1,2,3,4,5,6,7,8,9,10. All patients with cardiac iron overload on T2* imaging (T2* values of < 20 ms) also had T1 values below normal limits. In addition, there was a subset of 30% of our patients with normal T2* values (>20ms), but with T1 values below the normal range (<966ms) – See Figure 4. As there was no other reason for subnormal T1 values in these patients, we postulate that T1 mapping could potentially be more sensitive in the detection of patients with early/mild cardiac iron overload, who are being missed by T2*. Limitations of our study were that we did not have a control arm of normal subjects, and ECV estimation was not undertaken. Biopsy and estimation of actual iron load estimation were also not feasible.Conclusion
Cardiac T1 mapping and T2 mapping show a strong positive correlation with cardiac T2* values. T1 mapping could potentially be superior in the diagnosis of patients with early or mild cardiac iron overload, who are possibly being missed by T2* evaluation alone. This will be an interesting area for further research.Acknowledgements
Authors would like to acknowledge the scientific and technical support provided by Research and Collaboration Team of Siemens Healthcare Private Limited, IndiaReferences
1. Alam MH, Auger D, Smith GC, He T, Vassiliou V, Baksi AJ, et al. T1 at 1.5T and 3T compared with conventional T2* at 1.5T for cardiac siderosis. J Cardiovasc Magn Reson [Internet]. 2015 Nov 24 [cited 2017 Oct 13];17
2. Sado DM, Maestrini V, Piechnik SK, Banypersad SM, White SK, Flett AS, et al. Noncontrast myocardial T1 mapping using cardiovascular magnetic resonance for iron overload. J Magn Reson Imaging JMRI. 2015
3. Feng Y, He T, Carpenter J-P, Jabbour A, Alam MH, Gatehouse PD, et al. In vivo comparison of myocardial T1 with T2 and T2* in thalassaemia major. J Magn Reson Imaging JMRI. 2013 Sep;38(3):588–93
4. Camargo G, Rothstein T, Junqueira F, Fernandes E, Lima R, Greiser A, et al. Myocardial iron quantification using modified Look-Locker inversion recovery (MOLLI) T1 mapping at 3 Tesla. J Cardiovasc Magn Reson. 2013 Jan 30;15(1):W8.
5. Krittayaphong R, Zhang S, Saiviroonporn P, Viprakasit V, Tanapibunpon P, Komoltri C, et al. Detection of cardiac iron overload with native magnetic resonance T1 and T2 mapping in patients with thalassemia. Int J Cardiol. 2017 Dec 1;248:421–6.
6. Torlasco C, Cassinerio E, Roghi A, Faini A, Capecchi M, Abdel-Gadir A, et al. Role of T1 mapping as a complementary tool to T2* for non-invasive cardiac iron overload assessment. PLOS ONE. 2018 Feb 21;13(2):e0192890
7. Liu JM, Liu A, Leal J, McMillan F, Francis J, Greiser A, et al. Measurement of myocardial native T1 in cardiovascular diseases and norm in 1291 subjects. J Cardiovasc Magn Reson. 2017 Sep 28;19(1):74
8. He T, Gatehouse PD, Smith GC, Mohiaddin RH, Pennell DJ, Firmin DN. Comparing myocardial T2* and T2 measurements in thalassemia patients. In: Proceedings of the 16th Annual Meeting of ISMRM, Toronto. 2008
9. Guo H, Au W-Y, Cheung JS, Kim D, Jensen JH, Khong P-L, et al. Myocardial T2 Quantitation in Patients with Iron Overload at 3 Tesla. J Magn Reson Imaging JMRI. 2009 Aug;30(2):394–400
10. Alam MH, He T, Smith GC, Baksi AJ, Wage R, Drivas P, et al. Myocardial iron assessment by T1 cardiovascular magnetic resonance at 1.5 Tesla. J Cardiovasc Magn Reson. 2014 Jan 16;16(1):P295.
Figures


