3593
Accelerating Hyperpolarized 13C Spiral Chemical Shift Imaging with Joint Spectral-Spatial Low Rank Plus Sparse Reconstruction1University of Maryland Baltimore, Baltimore, MD, United States, 2Scalar Magnetics, LLC, Cuyahoga Falls, OH, United States
Synopsis
The goal of this study is to incorporate the spectral dimension into the Low Rank Plus Sparse Reconstruction algorithm with application of undersampled dynamic Hyperpolarized 13C imaging. The proposed method can be used to increase temporal and/or spatial resolution without significantly compromising image quality.
Introduction
Iterative low rank plus sparse (L+S) reconstruction has been applied to dynamic hyperpolarized (HP) 13C metabolic imaging in previous studies to accelerate image acquisition with incoherent dynamic sampling patterns1,2. For spectroscopic imaging, the existing L+S reconstruction framework has robust performance by reconstructing the dataset for each frequency point individually1. However, this requires performing the iterative reconstruction multiple times without consideration of the low-rank property in the frequency dimension, leading to excessive reconstruction time and failure when the dimension of the low-rank space is too small. In this study, we extend the L+S reconstruction framework to spiral chemical shift imaging (spCSI) by enforcing the consistency between image space and k-space of the undersampled 2D-spatial-1D-spectral dataset using 3D NUFFT operator. The proposed method was evaluated with digital simulations and retrospective study on preclinical in vivo scan.Methods
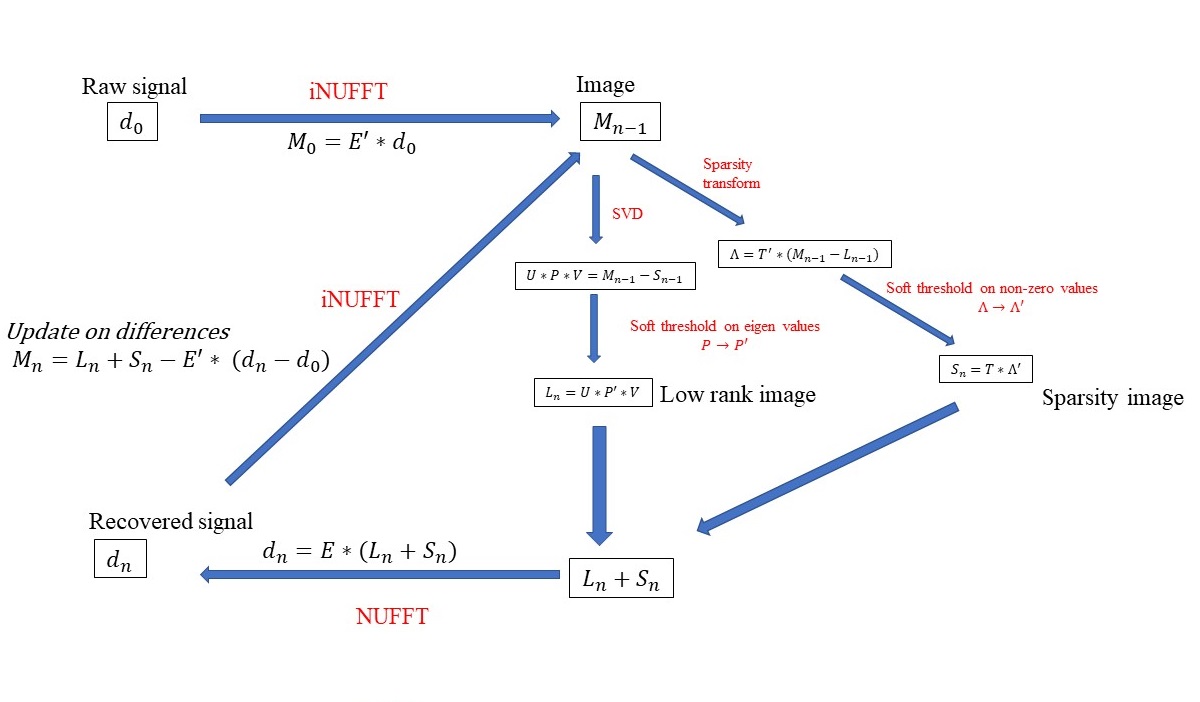
Algorithm: The L+S reconstruction fill the under-sampled k-space through iterative soft thresholding the singular values of the low-rank image space L and the entries of the sparsity image space S. The L+S algorithm for joint spectral-spatial acquisition applies the partial Fourier transform of the under-sampled kx-ky-t data d0 into 3D image space M with dimension [Nx, Ny, Nf] for each dynamic time point. This is achieved through a modified 3D NUFFT/iNUFFT operation given the undersampled k-t trajectory. The L+S reconstruction pipeline follows the same as previous studies1-3, shown in Fig 1.Simulations: The modified L+S algorithm was first tested on digitally simulated 2D spatial-1D spectral dynamic imaging data comprising of 4 discs representing the vasculature, kidneys, and liver/body, and 3 spectral peaks (pyruvate, alanine, and lactate, off-resonance [0Hz, 179Hz, 391Hz] at 3T), each intensity characterized by the typical dynamic measurement in a rat following hyperpolarized pyruvate injection. A previously acquired in vivo rat brain imaging dataset performed on a clinical 3T GE 750w MR scanner (GE Healthcare, Waukesha, WI, USA) was used for retrospective undersampling simulations.
Scan parameters: For both the digital simulation and in vivo scan, the fully sampled 2D single slice spCSI sequence has the following parameters: FOV 4x4 cm, matrix size 16x16, 24 echoes, 8 interleaves, 280 Hz spectral width. The simulated data consisted of 24 dynamic time points over a total scan time of 72 seconds, while the in vivo scan had 16 dynamic time points over 48 seconds. The under-sampled data was extracted from the fully sampled data by choosing 4 out of 8 (50% undersampling) of the interleaves. The order of the sampled and unsampled interleaves was random for each dynamic time point to create incoherence between the k-space and image space for the L+S algorithm to converge.
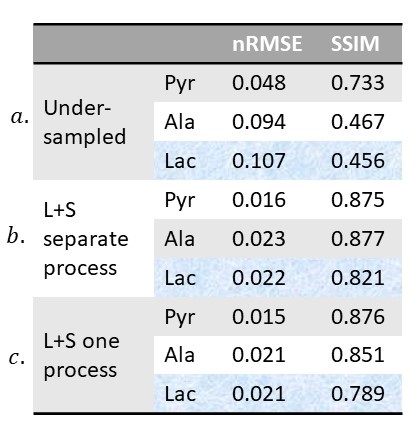
Assessment: The simulated and retrospectively undersampled datasets were reconstructed via the proposed modified L+S algorithm. Metabolic images of pyruvate, lactate, and alanine (for simulated data) were calculated by phasing the spectrum in each voxel and integrating the resulting peak from image space M. The reconstructed images were assessed compared to the images reconstructed from fully sampled k-space data using normalized root mean squared error (nRMSE) and the structural similarity index (SSIM)4. A series of combinations of the threshold parameters λL and λS were tested to determine the optimal values for general application.
Spectral aliasing: With the given 280Hz spectral width, the alanine and lactate resonances are aliased, which requires an additional linear phase correction step during reconstruction5. Two methods were implemented and compared: 1) apply alias correction on the undersampled k-t data for each metabolite of interest and then run the L+S algorithm to get image space M separately. 2) run the L+S algorithm on the undersampled k-t data for only once and get estimated fully sampled k-t data, apply alias correction for each metabolite of interest and get image space M, respectively.
Results and Discussion
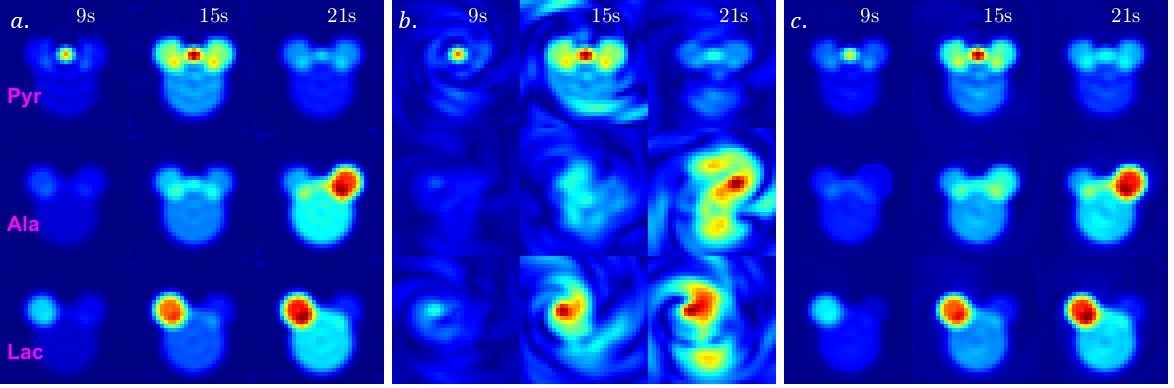
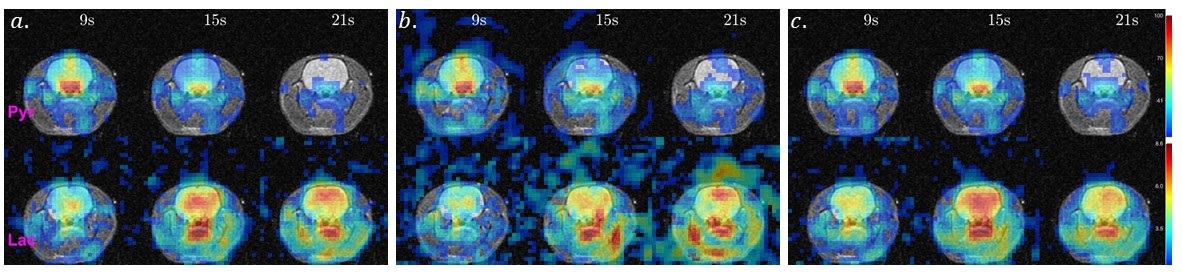
Due to the limited dimension of the low-rank space ([Nx Ny T] = [16,16,24]), reconstruction of the simulated and retrospectively undersampled data with the previously published method (individual L+S iteration on each frequency point) failed as the iterative algorithm did not converge. The metabolic images reconstructed with the proposed method for the simulated dataset at selected time points are shown in Fig 2c. An optimal value of λL = 0.02 and λS = 0.01 were selected based on the nRMSE and SSIM measurements. Assessment results for the two methods to resolve aliased spectral peaks are shown in Fig 3. They lead to similar results in terms of deviation from ground truth, while the latter only require one round of L+S iteration, preferred for the reduction in total reconstruction time.Results for the retrospective study on the in vivo rat brain imaging is presented in Fig 4. Similar to the digital simulations, the L+S algorithm can successfully reconstruct the undersampled in vivo data without significant artifacts.
Conclusion
The presented data demonstrate that the L+S image reconstruction can be applied to undersampled 2D-spatial-1D-spectral spCSI imaging data in a joint 3D scheme to accelerate image acquisition. By incorporating the spectral dimension in a single L+S process, the proposed method has less restriction on the spatial/temporal dimension of the image matrix to make the L+S algorithm converge and significant reduction in reconstruction time.Acknowledgements
This work was supported by NIH grants R21 NS096575, R01 DK106395, R21 CA213020, and R21 CA202694.References
[1] DeVience, Stephen J., Mayer, Dirk. "Speeding up dynamic spiral chemical shift imaging with incoherent sampling and low‐rank matrix completion." Magnetic resonance in medicine 77.3 (2017): 951-960.
[2] Milshteyn, Eugene, et al. "Using a local low rank plus sparse reconstruction to accelerate dynamic hyperpolarized 13C imaging using the bSSFP sequence." Journal of Magnetic Resonance 290 (2018): 46-59.
[3] Otazo, Ricardo, et al. "Low‐rank plus sparse matrix decomposition for accelerated dynamic MRI with separation of background and dynamic components." Magnetic resonance in medicine 73.3 (2015): 1125-1136.
[4] Wang, Zhou, et al. "Image quality assessment: from error visibility to structural similarity." IEEE transactions on image processing 13.4 (2004): 600-612.
[5] Mayer, Dirk, et al. “Fast Metabolic Imaging of Systems with Sparse Spectra: Application for Hyperpolarized 13C Imaging.” Magnetic resonance in medicine 56.4 (2006): 932–937.
Figures