3590
Hyperpolarized [1-13C] pyruvate MR spectroscopic imaging to detect metabolic changes in liver in a MCD rat model of fatty liver disease1Department of Radiology and Biomedical Imaging, University of California San Francisco, University of California San Francisco, San Francisco, CA, United States, 2Department of Pathology, University of California San Francisco, San Francisco, CA, United States, 3Liver center, University of California, San Francisco, CA, United States, 4Department of Medicine, University of California San Francisco, San Francisco, CA, United States, 5Biomedical Magnetic Resonance Laboratory, Washington University School of Medicine, St. Louis, MO, United States
Synopsis
Hyperpolarized 13C MRI was used to noninvasively detect metabolic changes in a rat model of non-alchoholic steatohepatitis. Rats were fed a methionine- and choline-deficient (MCD) diet for up to 18 weeks. In this preliminary study, we showed a significant increase in fat signal fraction and borderline-signifcant decrease in 13C lactate production in rats fed the MCD diet. Findings in this work suggest that HP 13C pyruvate can be a promising tool to monitor noninvasively the progress of fatty liver disease in patients.
Introduction
Non-alcoholic fatty liver disease (NAFLD) is the most common cause of chronic liver dysfunction and a significant public health problem. Non-alcoholic steatohepatitis (NASH) is the progressive and more severe form of NAFLD. There is currently no reliable noninvasive test for monitoring the progression of NAFLD into NASH. Several dietary models have been used to mimic human pathology of NASH. The methionine- and choline-deficient (MCD) diet is a reproducible and widely used model of NASH that induces macrovesicular fat, ballooning of hepatocytes, and fibrosis in rodent livers1,2. Hyperpolarized (HP) 13C MRI is a novel technique for noninvasive characterization of in vivo metabolism in a variety of organs and pathologic conditions. Previous studies have applied HP 13C MRI in mice to detect cellular metabolite abnormalities in models of fatty liver induced by a high fat diet3 and altered markers of oxidative stress that occur with the MCD diet4. In this study, we decided to complement the earlier studies of oxidative stress by focusing on detecting noninvasively metabolic changes in rats fed the MCD diet by using HP 13C pyruvate MRI.Methods
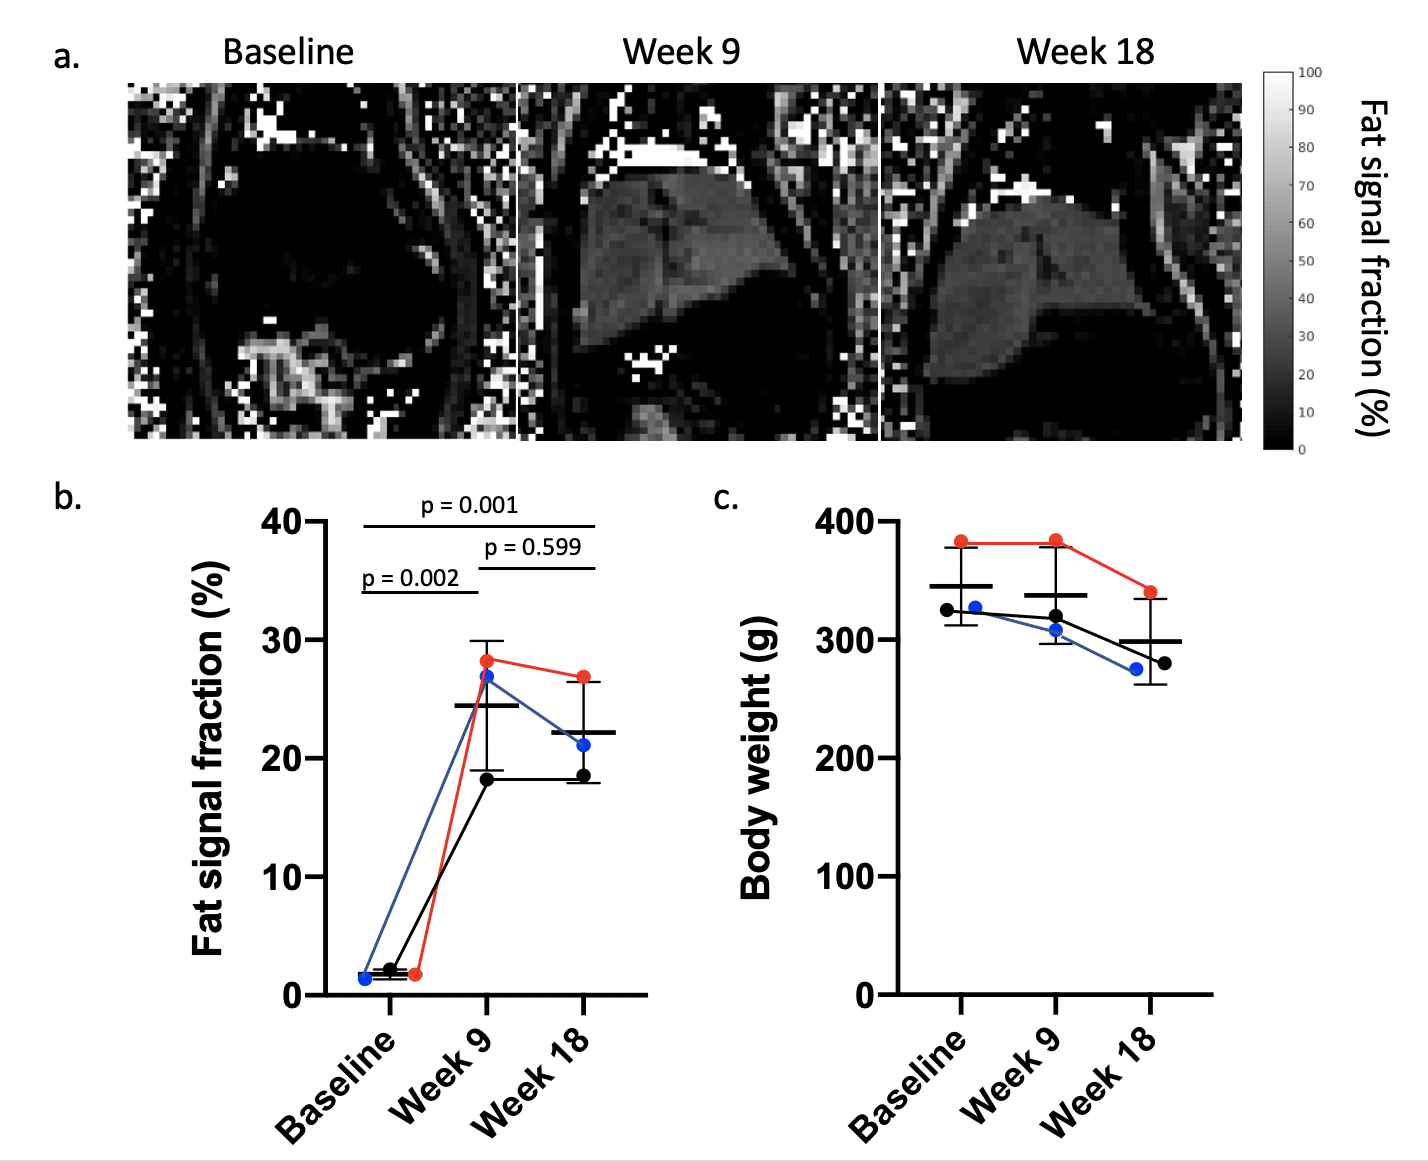
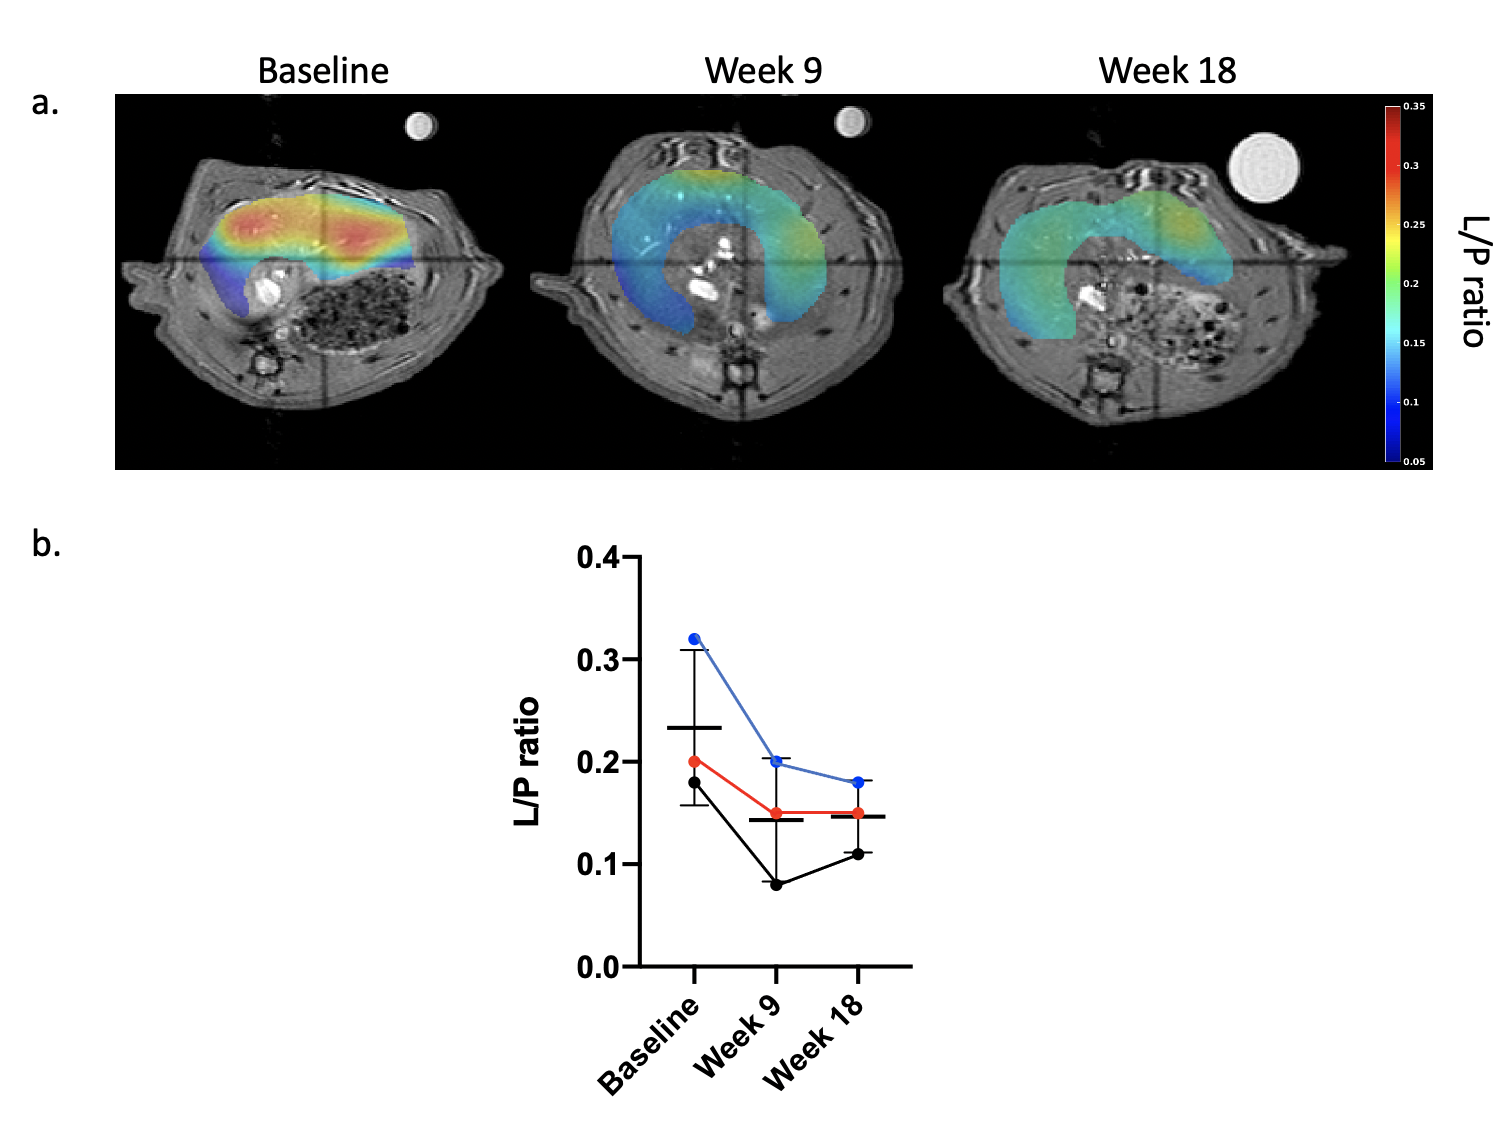
Three 12-week old adult male Wistar rats were placed on an MCD diet (Teklad, TD. 90262) 3 for a total of 18 weeks. MRI scanning was performed on a 3T Bruker system with separate 1H and 13C transmit/receive quadrature volume coils. Rat livers were imaged at baseline, week 9, and week 18 after beginning the diet. Liver fat was quantified using a 2D multi-slice multi-echo gradient echo pulse sequence with the following parameters: TE = 2.2, 3.3, 4.4 and 5.5ms, TR 200ms, flip 15o, number of slices 5, slice thickness 2 mm. For each 13C HP MRI experiment, 2.3mL of 80mM [1-13C]Pyruvate was injected intravenously over 12s and the images were acquired beginning 20s after the start of the injection.13C chemical shift images were acquired with center-out view ordering with slice thickness of 8mm, FOV 80mm x 80mm, matrix 8 x 8, flip 5°. 15 dynamic points were acquired over 45s. Fat fraction maps were generated from multi-echo data using the using the fat-water ISMRM toolbox5. Regions of interest (ROI) were manually drawn on five axial slices in the liver (4105 ± 1703 pixels).13C metabolite maps were generated using the open-source SIVIC package and calculated by integrating the spectral peaks of lactate and pyruvate over time on the whole slice. The area under the curve for each metabolite, within a manually prescribed liver ROI, was used to calculate the lactate/pyruvate ratio.Results
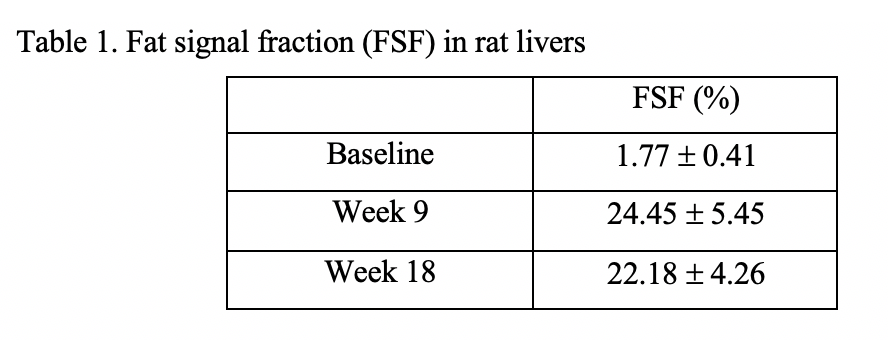
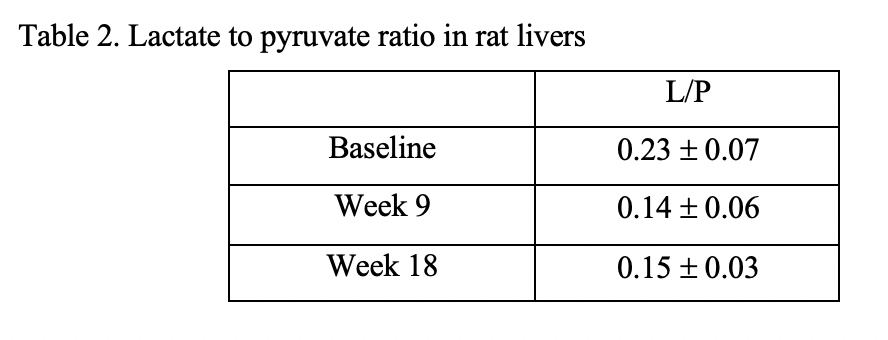
Significantly higher liver fat was observed at week 9 (p = 0.002) and week 18 (p = 0.001) on the MCD diet relative to the baseline (Figure 1 and Table 1). No significant difference in FSF was found between week 9 and week 18 (p = 0.599). All animals exhibited significant weight loss by week 18 (-13.65% ± 2.34%, p = 0.0005), which is an expected feature of this model (Figure 1.c). Figure 2a. displays HP 13C L/P ratio map overlaid on anatomic images in rats fed the MCD diet.From HP 13C MRSI, L/P ratios are shown in Table 2. A borderline-significant decreased in the L/P ratio was found between the baseline and week 9 (paired T-test, p = 0.049). Similarly, L/P ratio was lower at week 18 compared to the baseline (p = 0.086). No significant change in L/P ratio was observed between week 9 and week 18 (Figure 2.b).
Discussion
The present study found that MCD diet can lead to a significantly increased fat signal fraction in liver, consistent with prior work, which can be related to lipid accumulation resulting from a phosphatidylcholine deficiency induced by this model. Moreover, weight loss has been associated with hypermetabolism induced by the MCD diet, which includes increased total body energy expenditure, enhanced fatty acid oxidation, and uncoupling of hepatic mitochondria2. A previous study has suggested that hypermetabolism is related to an increase of fatty acid flux through b-oxidation pathways, without affecting pyruvate metabolism via the action of pyruvate dehydrogenase6. Interestingly, we observed a decrease in lactate in animals on the MCD diet. This result was somewhat surprising given prior studies that showed increased pyruvate-to-lactate conversion in high fat diet models of fatty liver disease3. One possible explanation for the decrease in lactate that is observed may be related to the elimination of methionine from the diet also reduces sulfhydryl intake, potentially blunting the hydride-mediated conversion of pyruvate to lactate.Conclusion
In this preliminary study, we detected changes in liver fat as well as altered metabolic conversion of pyruvate-to-lactate in a dietary model of NASH. Although the observed changes should be confirmed with correlative biochemical and histologic analysis, this work suggests that HP 13C pyruvate is a promising tool to monitor noninvasively the progress of fatty liver disease.Acknowledgements
No acknowledgement found.References
1. Kirsch R, Clarkson V, Shephard EG, Marais DA, Jaffer MA, Woodburne VE, Kirsch RE, Hall Pde L. Rodent nutritional model of non-alcoholic steatohepatitis: species, strain and sex difference studies. J Gastroenterol Hepatol. 2003 Nov;18(11):1272-82. doi: 10.1046/j.1440-1746.2003.03198.x. PMID: 14535984.
2. Rizki G, Arnaboldi L, Gabrielli B, Yan J, Lee GS, Ng RK, Turner SM, Badger TM, Pitas RE, Maher JJ. Mice fed a lipogenic methionine-choline-deficient diet develop hypermetabolism coincident with hepatic suppression of SCD-1. J Lipid Res. 2006 Oct;47(10):2280-90. doi: 10.1194/jlr.M600198-JLR200. Epub 2006 Jul 8. PMID: 16829692.
3. Moon CM, Oh CH, Ahn KY, et al. Metabolic biomarkers for non-alcoholic fatty liver disease induced by high-fat diet: In vivo magnetic resonance spectroscopy of hyperpolarized [1-(13)C] pyruvate. Biochem Biophys Res Commun 2017; 482(1): 112-9.
4. Wilson DM, Di Gialleonardo V, Wang ZJ, et al. Hyperpolarized 13C Spectroscopic Evaluation of Oxidative Stress in a Rodent Model of Steatohepatitis. Sci Rep. 2017;7:46014. Published 2017 Apr 20. doi:10.1038/srep46014.
5. Hu HH, Börnert P, Hernando D, et al. ISMRM workshop on fat-water separation: insights, applications and progress in MRI. Magn Reson Med. 2012;68(2):378-388. doi:10.1002/mrm.24369.
6. Taylor et al. Imaging of hepatic steatosis and hyperpolarized carbon metabolism at 14t - applications to a murine model of non-alcoholic fatty liver disease. Proc. Intl. Soc. Mag. Reson. Med. 19. 2011.
Figures